
Why Does Technical Analysis Actually Work?
Ever opened a book on technical analysis, flipped to page one, and gotten hit with moving averages, MACD, KDJ, head-and-shoulders, Elliott Wave theory? It can feel like you've suddenly stepped into a world of financial jargon.
But before you learn any of these tools, there's a more important question worth answering first: why does technical analysis actually work?
Why should a single candlestick, a moving average, or an indicator provide any insight into where the market might go next? Without a clear answer, every indicator you learn afterward is just memorized rules.
You'll likely end up in one of two places.
First, you mechanically apply indicators to every market. You buy whenever a golden cross appears and sell whenever a death cross appears, only to find that the strategy breaks down when market conditions change.
Second, you get hooked on some "magic pattern" or "sure-fire indicator." A few early wins convince you you've cracked the code, and once it stops working, you start wondering if technical analysis is a scam.
The truth is, technical analysis became a widely used method not because any single indicator is magic, but because it rests on a handful of underlying assumptions.
Understand these assumptions, and you'll know when technical analysis actually works, and when it's prone to breaking down.
Everything you'll learn later, candlesticks, trends, volume, indicators, is really just an extension of these basic ideas.
Assumption One: Price Reflects All Available Information
Here's a question to start with: does a company need good news before its stock can rise?
In theory, yes, good news should push the stock up.
But in real trading, you've probably seen this: a company reports earnings that crush expectations, and on the day the report comes out, the stock doesn't rise. It falls. Sometimes the stock had already been climbing for days before the news was even official.
Why does this happen?
Because the market doesn't wait for news to arrive before trading. Many investors position themselves ahead of time based on all kinds of information, expectations, and market signals.
Maybe an institution spotted improving demand through industry data. Maybe investors anticipated a shift in earnings. Or maybe sentiment simply shifted early.
So price tends to reflect expectations first, and the official announcement just confirms what the market had already priced in.
That's the first foundational assumption behind technical analysis: whatever information exists in the market eventually gets reflected in price through trading activity.
That includes: shifts in a company's fundamentals, changes in industry conditions, policy developments, capital flows, investor sentiment. All of it eventually shows up in price and volume.
So when technical analysis focuses on price, it's not claiming price predicts everything. It's saying: price is the final expression of every market participant's trading decisions.
As a retail investor, you're rarely going to have an information edge ahead of most of the market.
What you can do instead is observe the trail the market leaves behind, which is price and volume.
This assumption does have its limits, though.
Take a small, thinly traded stock: low volume every day, price barely moving for a long stretch. That doesn't necessarily mean there's no information out there. It might just mean too few people are trading it for price to fully reflect the market's view.
That's why technical analysis tends to work best on actively traded names with broad participation and solid liquidity.
Assumption Two: Price Tends to Move in Trends
The second assumption: an uptrend tends to continue, while a downtrend tends to persist.
That sounds obvious, but it's actually one of the core foundations of technical analysis.
If price moved completely at random, technical analysis would be pointless. Up today, up tomorrow, then a random drop the day after, with no pattern to find anywhere.
But real markets don't behave that way. Once a trend forms, it tends to persist for a while.
Why?
A few reasons drive this.
- Investor behavior has inertia. During a rally, investors who are already up on the trade usually don't rush to sell. They tend to think the trend still has room to run, so they keep holding, sometimes adding to the position. That behavior pushes price up further.
- Large institutions cannot build or unwind positions instantly. A retail investor can buy a stock in seconds. An institution building a large position, though, might need days or even weeks. They don't buy it all at once, they go in batch by batch, and that process itself extends the trend.
- The market has a herding effect. The more obvious a direction becomes, the more investors notice it. More capital flows into an uptrend; more investors move to the sidelines or reduce risk exposure during downtrends. That collective behavior reinforces whatever direction was already in motion.
Which is why one of the most important ideas in technical analysis is going with the trend. Instead of trying to nail the exact top or bottom, wait for a direction to emerge, then trade with it.
But this assumption has a weak spot too. A trend is most likely to break down when the market has no clear direction, in a choppy, range-bound market: price bouncing back and forth, indicators firing conflicting signals, a breakout today reversed by tomorrow. In that kind of environment, technical signals get distorted easily.
So trading isn't just about reading a signal. It's also about reading what kind of market you're actually in.
Assumption Three: Human Nature Doesn't Change, So History Keeps Repeating
The third assumption: markets keep changing, but the human nature driving them doesn't.
Every market has the same cast of emotions: greed, fear, hesitation, regret, chasing rallies and panic-selling on the way down. None of that goes away, not over the last hundred years, not over the next hundred. Because people's behavior stays similar, certain classic chart patterns keep showing up again and again.
Take the "head and shoulders top," something you've probably heard of. Most people learn it as: "see a head and shoulders, expect a decline." But what actually matters isn't the shape. It's the market psychology behind it.
At first, price rises and investor confidence builds. Once price reaches a certain point, some investors start taking profit, triggering the first pullback. That's the left shoulder.
Sentiment then recovers, price rallies again, and clears the previous high to set a new peak. At this stage, plenty of investors see price making new highs and assume the uptrend is still strong, so they keep buying in. But as price climbs to this higher level, buying pressure gradually weakens, profit-taking accelerates, and price pulls back again, forming the head.
On the third attempt to push higher, some investors still try to drive the price higher, but the momentum has clearly weakened. The price fails to break above the head's high, creating the right shoulder.
What's really happening underneath is a shift in sentiment: confidence on the first rally, sentiment peaking with more investors chasing on the second, and by the third rally, some capital is still trying to push it up, but there's no fresh buying left to carry it further.
Once enough people realize the rally has run out of steam, profit-takers head for the exits, price breaks below a key level, and the trend reverses.
The chart pattern is just the outcome. Human nature is the cause.
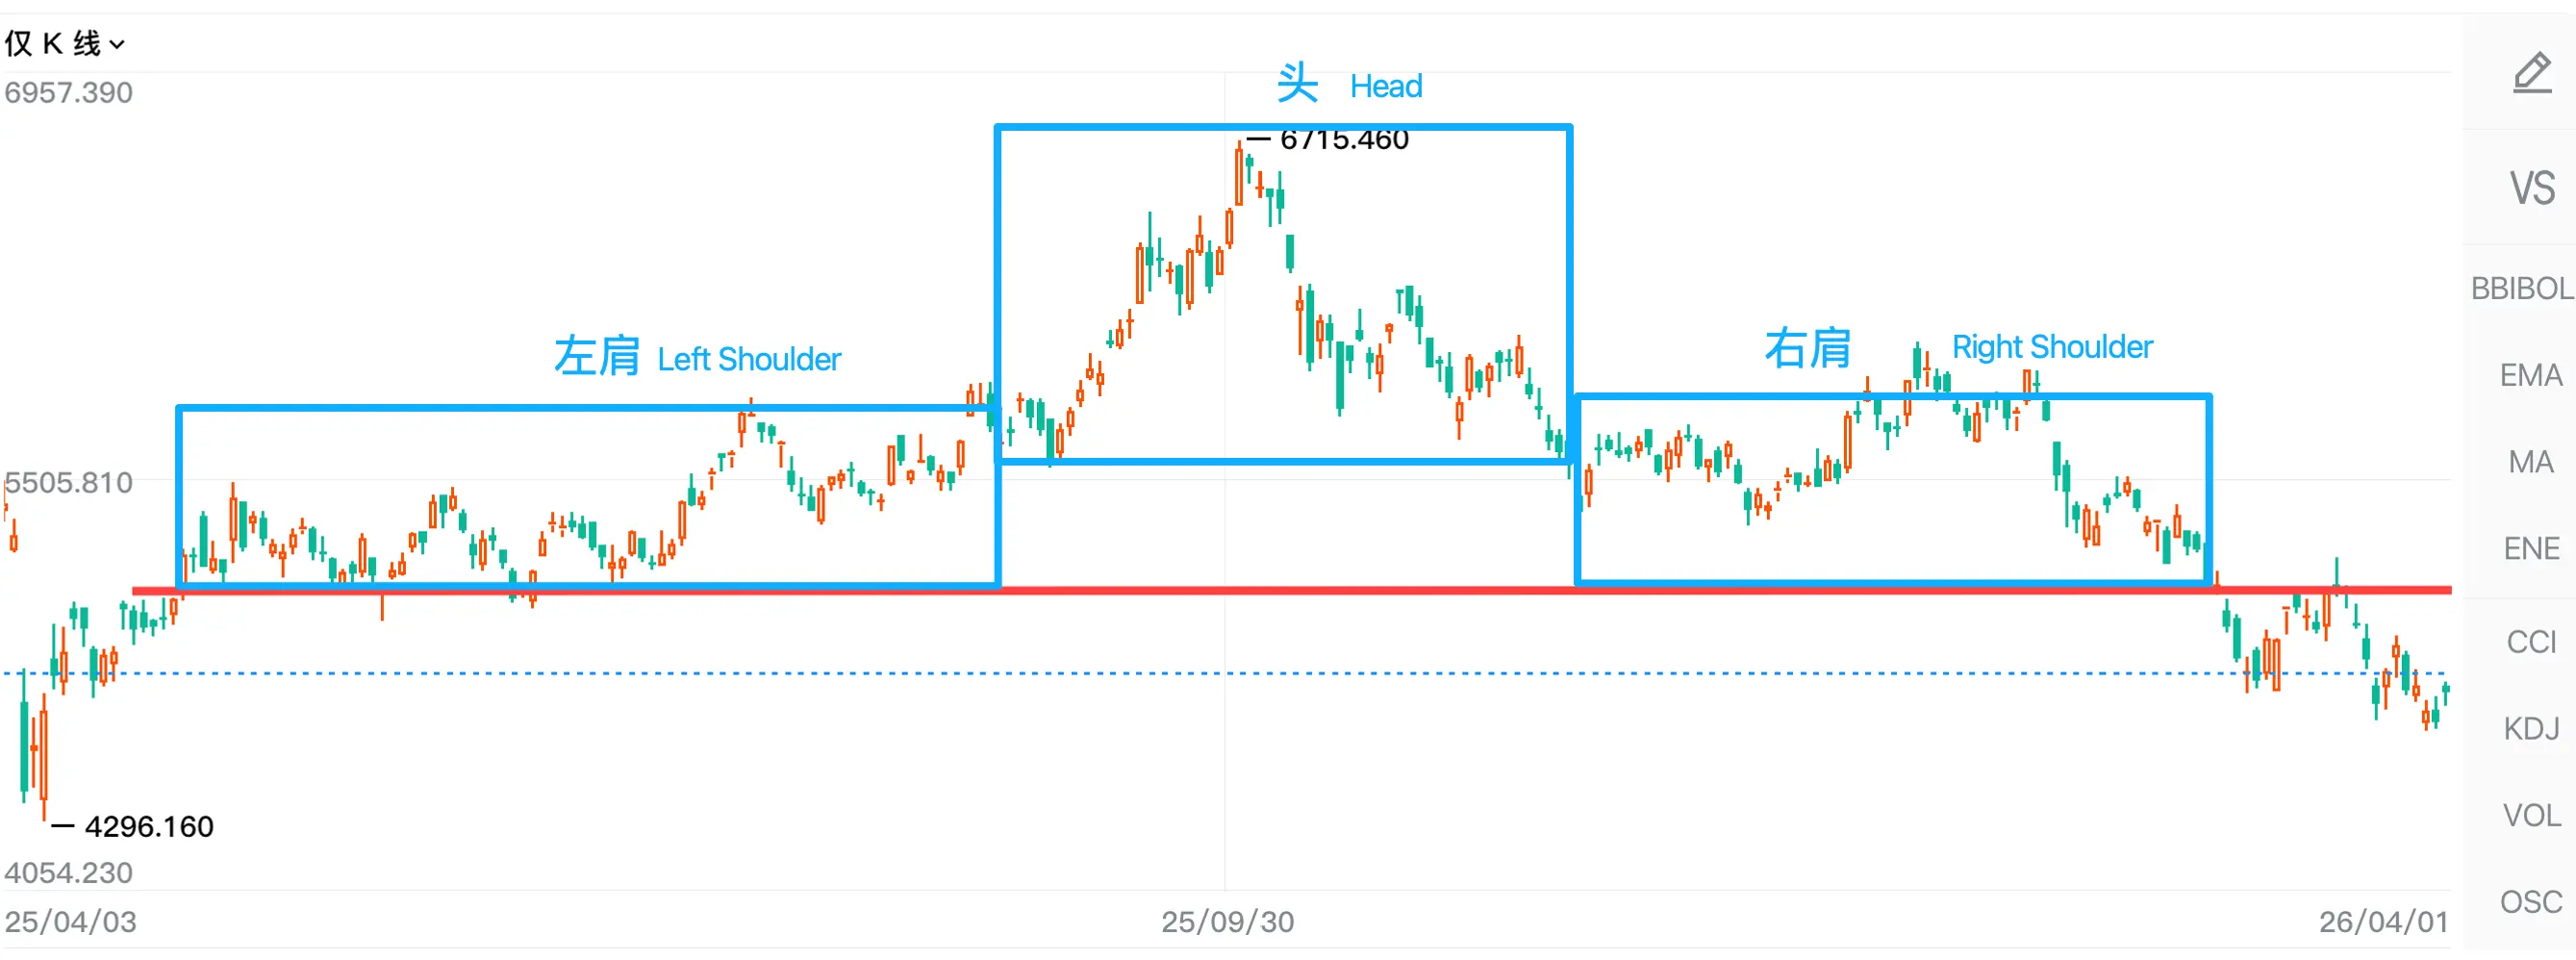
One more thing worth remembering: a chart pattern is never a guarantee of what happens next.
The same pattern, in a different market context, can play out completely differently. Seeing something that "looks like" a head and shoulders doesn't guarantee a decline. What technical analysis gives you is a probability edge, not a certain answer.
Can Technical Analysis Actually Predict the Market?
After looking at these three core assumptions, you might wonder: if technical analysis is not 100% accurate, what is the point of learning it?
The answer is simple: technical analysis was never meant to predict every market move. No method can do that.
What technical analysis gives you is a framework for improving your odds in an uncertain market and building a more disciplined set of trading rules.
By analyzing price, volume, trends, market structure, and technical indicators, you can assess whether the current setup is favorable, whether a trend remains intact, and whether new risks may be emerging.
Like any method, technical analysis works better in some market conditions than others. It tends to be more reliable when:
- The instrument is actively traded and has good liquidity.
- The market is moving in a clear trend.
Its limitations become more apparent during extreme events, such as:
- A sudden major policy shift.
- A black swan event.
- A period of extreme market volatility.
In these situations, prices may move sharply or gap higher or lower, making any form of analysis less reliable.
Technical analysis can also produce repeated false signals during prolonged sideways markets.
This lesson didn't cover a single specific indicator, and it didn't teach you how to draw a line. But it might be the most important lesson in the whole technical analysis framework, because everything you'll learn later (candlestick patterns, trend reading, support and resistance, volume analysis, indicators) is all built on these foundational ideas:
- First, price reflects a large amount of the information in the market.
- Second, price tends to move in trends.
- Third, human nature doesn't change, so history keeps repeating.
The point of remembering these three isn't to recite them as answers. It's so that whenever you see a technical signal going forward, you can pause and ask: "What's the logic behind this signal? Does it actually apply to the market I'm looking at right now?"
Once you start thinking this way, how you approach technical analysis changes. You stop mechanically memorizing "buy on this pattern, sell on that indicator."
Instead, you start genuinely understanding why technical analysis works, and what logic it actually runs on.
Next lesson, we move into the basic tools of technical analysis: candlesticks, trends, and support and resistance.
Disclaimer
This content is provided for investor education and informational purposes only. It is intended to help readers understand relevant financial concepts and indicators and does not constitute investment advice, an offer, or a commitment of any kind. Any views, data, or analysis presented are general in nature and should not be regarded as a recommendation of any specific investment product or strategy.
Investing involves risk, and market fluctuations may result in a loss of principal. Before making any investment decision, readers should exercise independent judgment based on their financial circumstances, investment objectives, and risk tolerance, or consult a licensed financial adviser. The author and publisher accept no liability for any direct or indirect loss arising from reliance on this content.
Related Courses
Volume Analysis
Understand the Relationship Between Price and Volume
Naked Candlestick Analysis
Read the Balance of Power Behind Each Candlestick
Chart Patterns
Understand Reversals and Continuations Through Price Structure
Technical Indicators
Understand MA, MACD, KDJ, and Other Popular Technical Indicators