
Moving Averages: The Simplest Line That Still Works
When you look at a price chart, the first thing you notice is the price itself. But price moves every day, influenced by short-term sentiment, unexpected news, and market noise, making the underlying trend harder to identify.
That's exactly why technical indicators exist. By applying calculations to price and volume data, they help traders get a clearer view of trend direction, momentum, and potential trading opportunities.
Among these indicators, the moving average (MA) is one of the most classic and widely used tools in technical analysis. It helps filter out short-term noise, making the underlying trend easier to see, and it also serves as the foundation for understanding many other indicators.
A moving average is exactly what it sounds like: it adds up the closing prices from the last N days, divides by N, and plots the result as a line. A 5-day MA, for example, averages the last five closes, recalculates every day, and connects the dots into a line.
Why bother? Daily price moves are noisy: they react to short-term sentiment and one-off events, so a raw price chart can look jumpy. A moving average smooths that out, helping you focus on the underlying trend instead of reacting to short-term noise.
Common MA periods are 5, 10, 20, 60, 120, and 250 days. The shorter the period, the more sensitive it is to price changes, but also the more vulnerable it is to short-term noise; the longer the period, the better it reflects the long-term trend, but the more it lags. Short-term traders tend to watch the 5- and 10-day lines, while those focused on the medium and long term pay more attention to the 60-, 120-, or even 250-day lines.
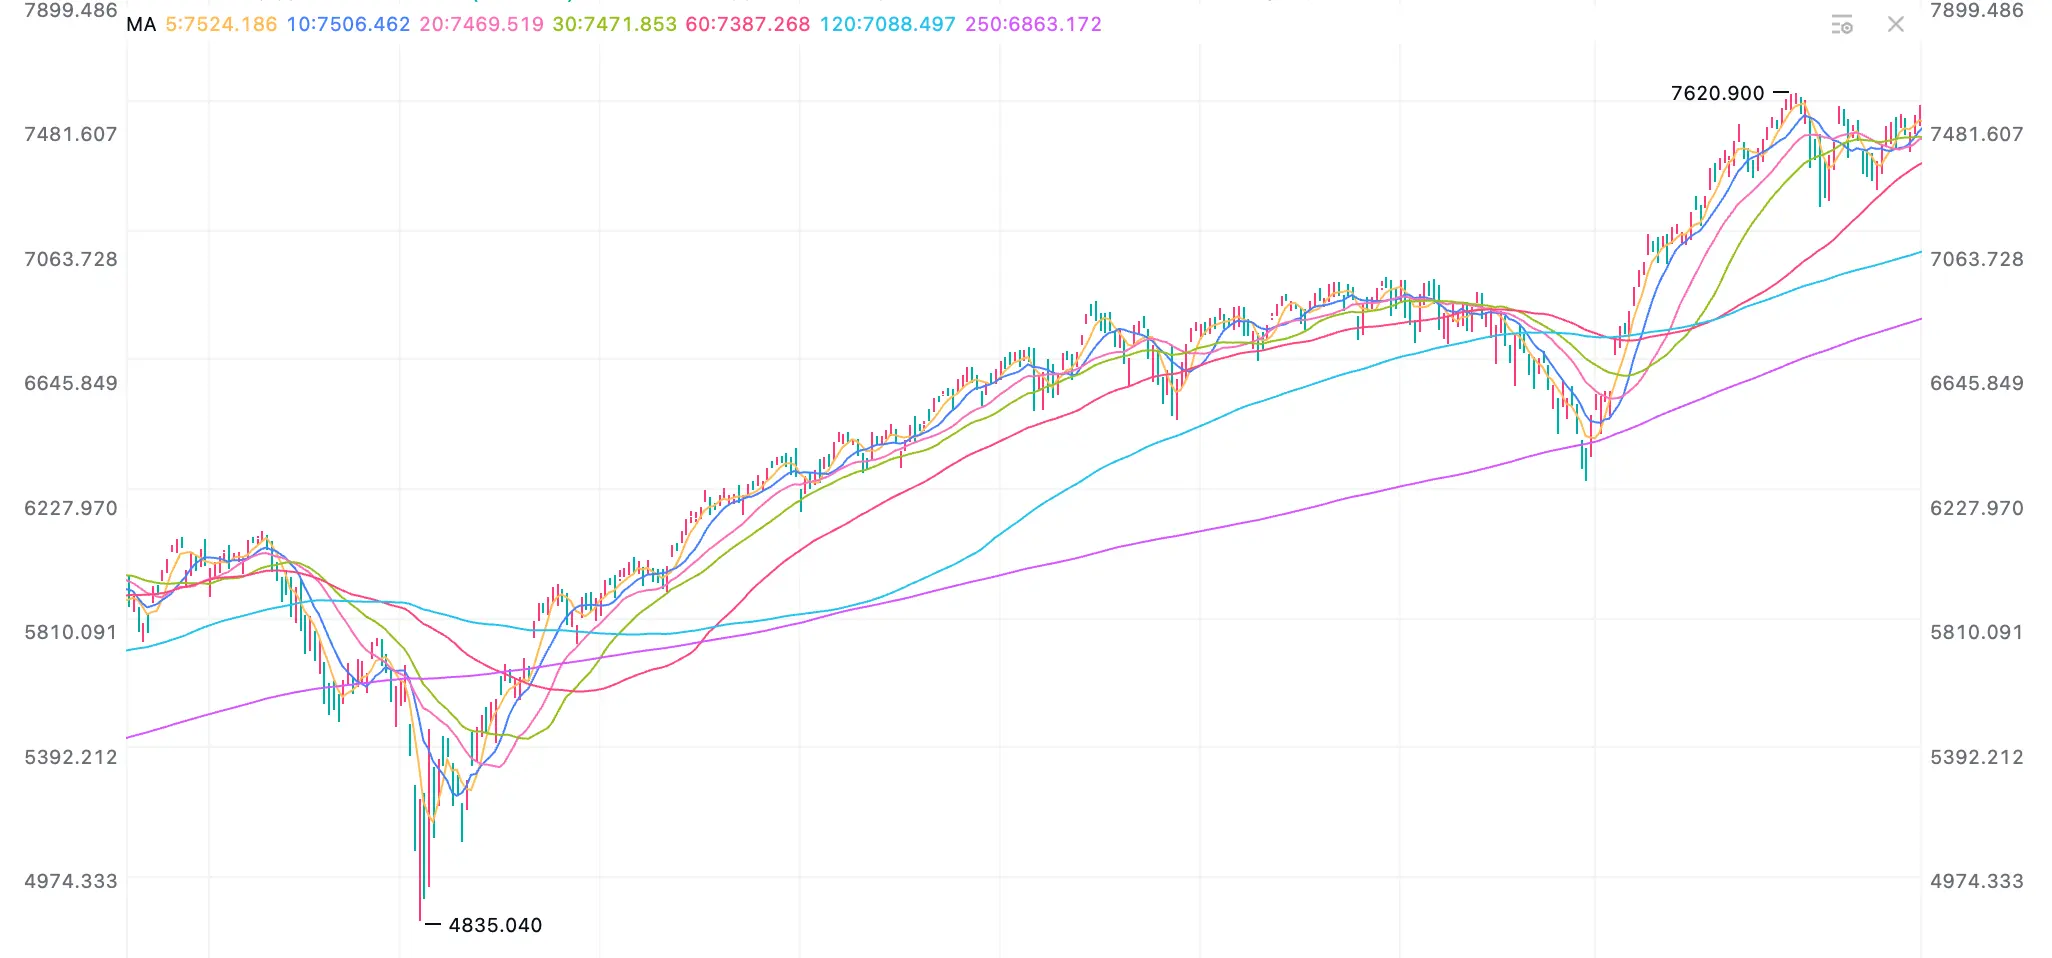
A moving average can also work as a support or resistance level. When price is trading above the moving average, it tends to act as support: pullbacks toward it often attract buyers. When price is below the moving average, it tends to act as resistance: rallies back up to it often run into selling pressure. It's the same logic as the support and resistance levels covered earlier. The only difference is that this support or resistance comes from a calculation, rather than a fixed price point.
Moving Average Alignment
The way moving averages are positioned relative to each other can reveal the strength of a trend.
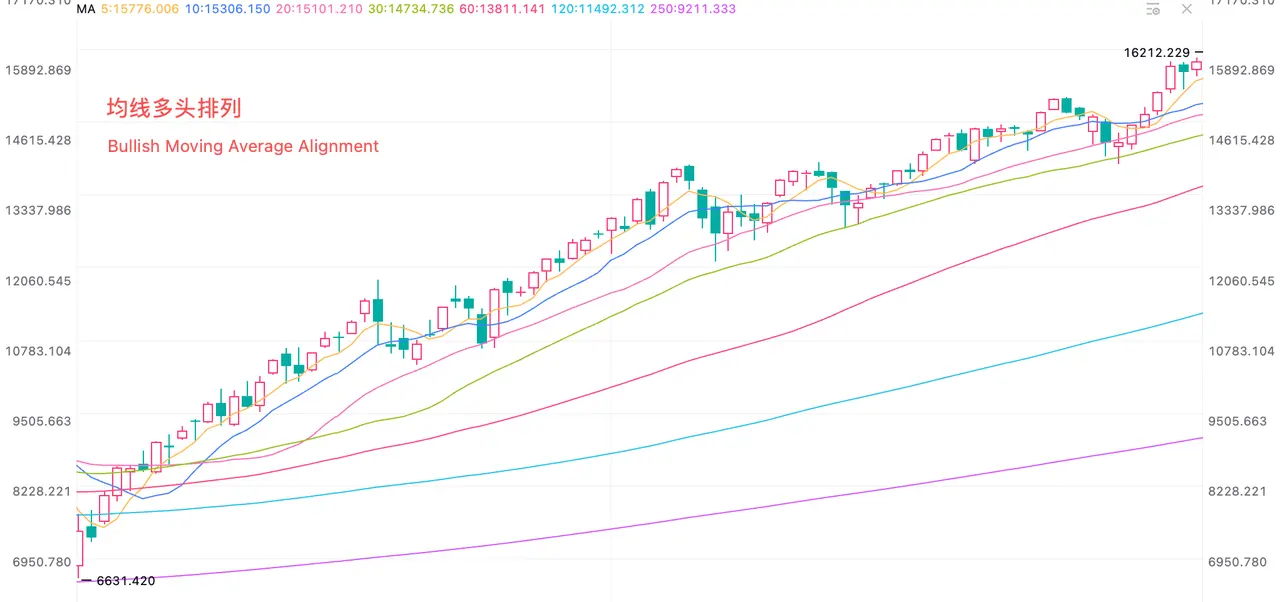
Bullish Alignment
When the short-term MA is above the medium-term MA, and the medium-term MA is above the long-term MA (for example, the 5-day MA above the 10-day MA, and the 10-day MA above the 20-day MA), this is called a bullish alignment.
It means momentum is pointing upward across the short, medium, and long term alike, which is generally considered a healthy sign for the trend.
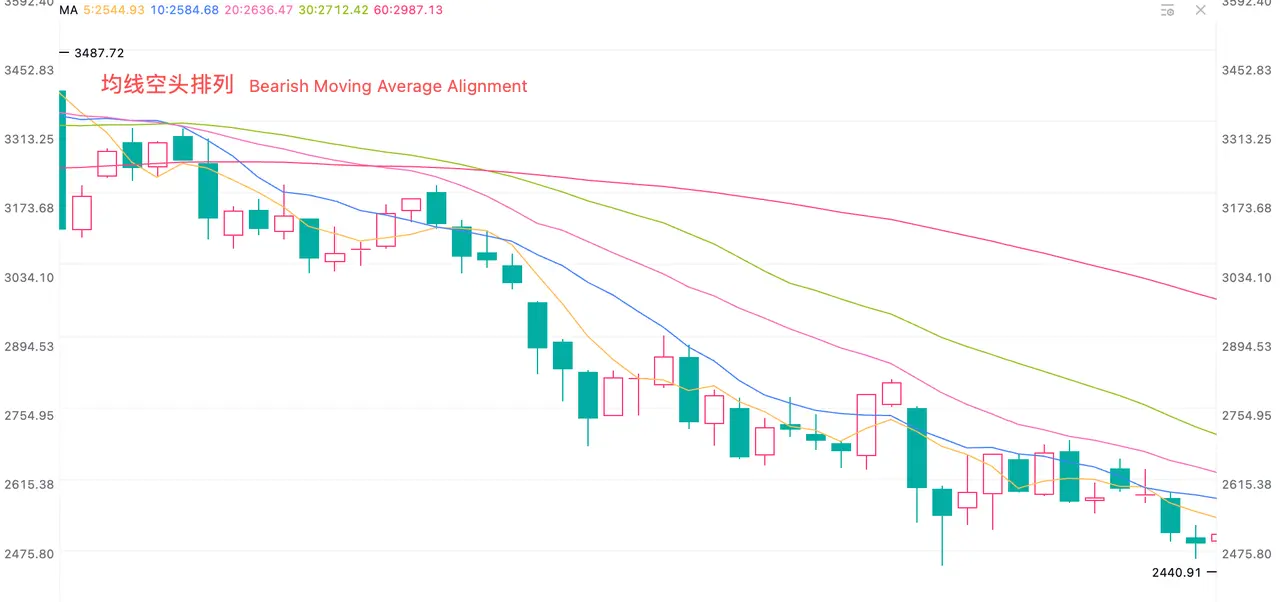
Bearish Alignment
When the order is reversed, with shorter-term averages below longer-term averages, it forms a bearish alignment, signaling a weaker trend.
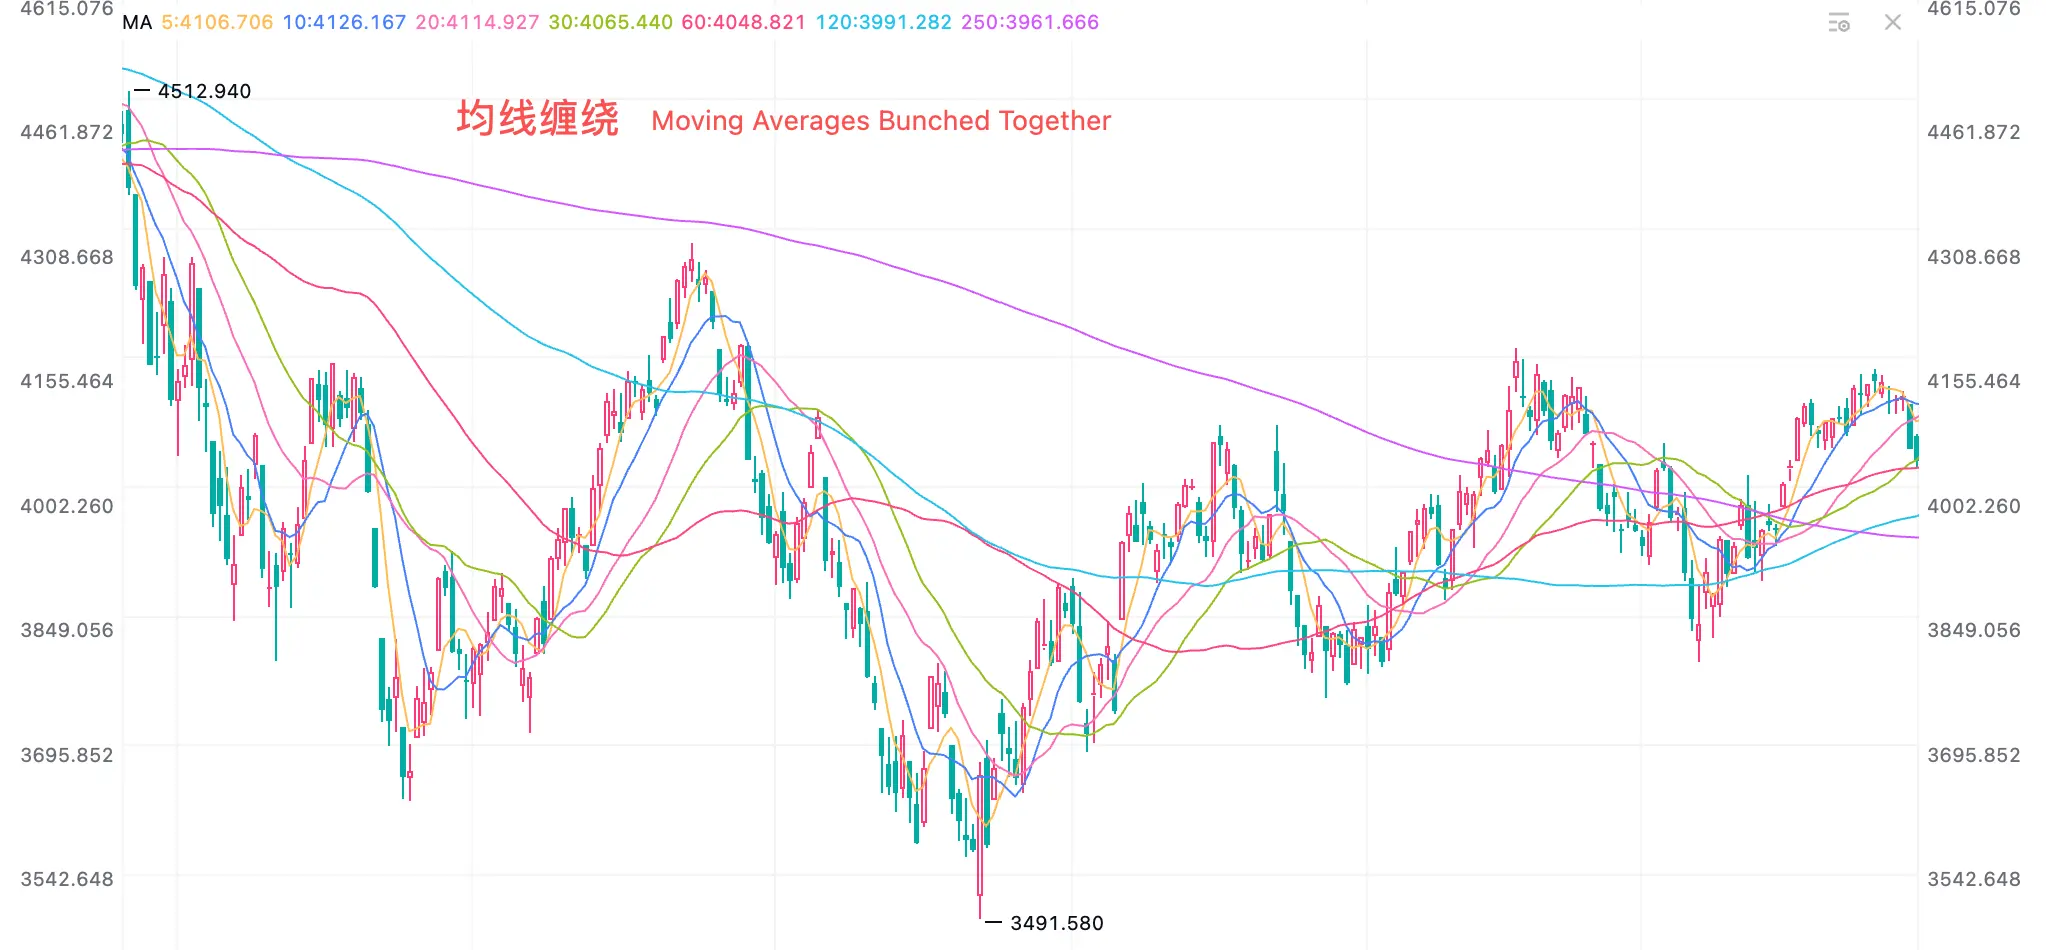
Tangled Averages
When several moving averages become tangled together with no clear order, it usually means the market is moving sideways, with no clear direction.
Golden Cross and Death Cross
Line up two moving averages of different periods, and you get another concept worth knowing: the golden cross and the death cross.
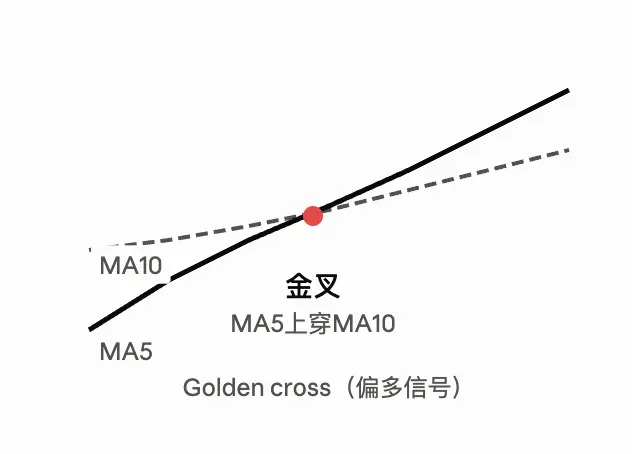
Golden Cross
When the short-term MA crosses above the long-term MA (the 5-day MA crossing above the 20-day MA, for instance), it is generally viewed as a bullish signal: short-term momentum is beginning to outpace the longer-term trend.
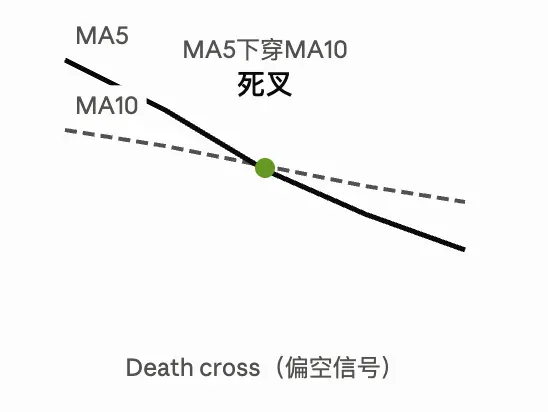
Death Cross
When the short-term MA crosses below the long-term MA, it is generally viewed as a bearish signal: short-term downward momentum is beginning to outpace the longer-term trend.
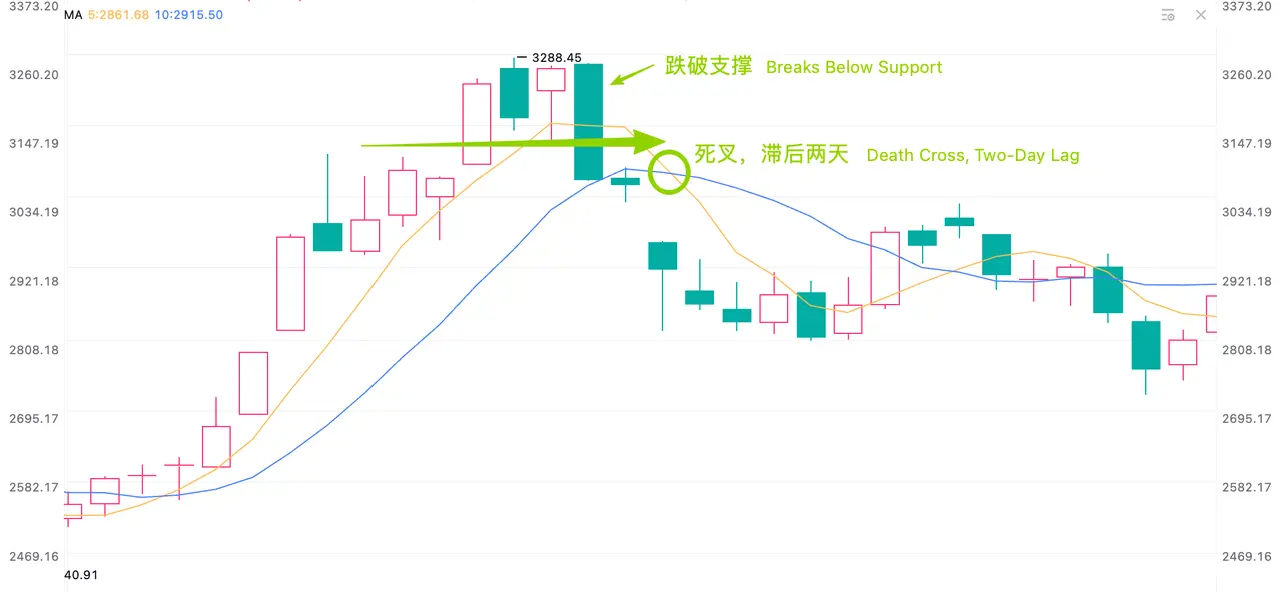
Golden and death crosses are easy to read, but they share a well-known drawback: a moving average is a calculated value, so it is inherently lagging. By the time a cross actually appears, price has often already moved. That's why an MA is better suited to confirming a trend than pinpointing an exact entry or exit. It tells you the probable direction, not the exact moment to act.
By now, you've probably noticed that much of what moving averages do echoes ideas from earlier stages:
- Using an MA as support or resistance follows the same logic as the support and resistance levels covered earlier; the only difference is that this one is calculated rather than manually drawn.
- Bullish and bearish alignment is really another way to confirm the direction and health of the current trend, serving the same purpose that trend lines and neckline breaks served earlier.
So the moving average isn't some standalone new tool. It is the same "read the trend, find support and resistance" thinking from earlier stages, just expressed in a more quantitative form.
This lesson boiled down to three key ideas: how to calculate a moving average, how to use it as support or resistance, and how to read bullish/bearish alignment and golden/death crosses. The moving average is the most basic trend indicator there is, and it is also the foundation for understanding MACD, which is exactly what we'll explore in the next lesson.
Disclaimer
This content is provided for investor education and information-sharing purposes only, to help readers understand relevant financial concepts and indicators. It does not constitute investment advice, an offer, or a solicitation of any kind. Any views, data, or analysis mentioned are general in nature and should not be taken as a recommendation for any specific investment product or strategy.
Investing involves risk, and market fluctuations may result in loss of principal. Before making any investment decision, readers should exercise independent judgment based on their own financial situation, investment objectives, and risk tolerance, or consult a licensed financial advisor. The author and publisher of this content accept no liability for any direct or indirect loss arising from reliance on it.
Related Courses
Technical Analysis from Scratch
Build Your Own Market Analysis Framework
Volume Analysis
Understand the Relationship Between Price and Volume
Naked Candlestick Analysis
Read the Balance of Power Behind Each Candlestick
Chart Patterns
Understand Reversals and Continuations Through Price Structure