Current Ratio Calculation: A Guide to Analyzing Short-Term Liquidity
The current ratio is a key indicator of a company's short-term liquidity. Understanding its calculation, interpretation, and industry benchmarks enables investors to better assess a firm's financial health.
TL;DR:
The current ratio is a key financial metric for assessing a company’s short-term debt-paying ability. It is calculated by dividing current assets by current liabilities. A ratio between 1.5 and 2.0 is generally considered healthy, but it should be evaluated in combination with industry characteristics and other financial indicators.
As an investor, it's crucial to assess whether companies you hold are exposed to liquidity risks. The current ratio is a valuable tool that helps you quickly evaluate a company’s short-term repayment capacity. By analyzing the relationship between current assets and current liabilities, you can better judge whether a company has sufficient financial reserves to handle unexpected cash requirements. This article will guide you through the core points of calculating and understanding the current ratio.
What is the Current Ratio?
The current ratio is a financial analysis indicator used to measure a company’s ability to meet short-term obligations. It reflects how well a company’s assets that can be converted to cash within one year cover its liabilities due within the same period.
What Are Current Assets?
Current assets are items expected to be converted into cash within one year, including:
- Cash and Bank Deposits: The most liquid assets, available for immediate use
- Accounts Receivable: Payments owed by customers from sales that have not yet been collected
- Inventory: Unsold goods and raw materials
- Short-term Investments: Securities that can be liquidated within a year
What Are Current Liabilities?
Current liabilities refer to debts that need to be repaid within one year, mainly including accounts payable, short-term borrowings, taxes payable, and salaries payable.
How is the Current Ratio Calculated?
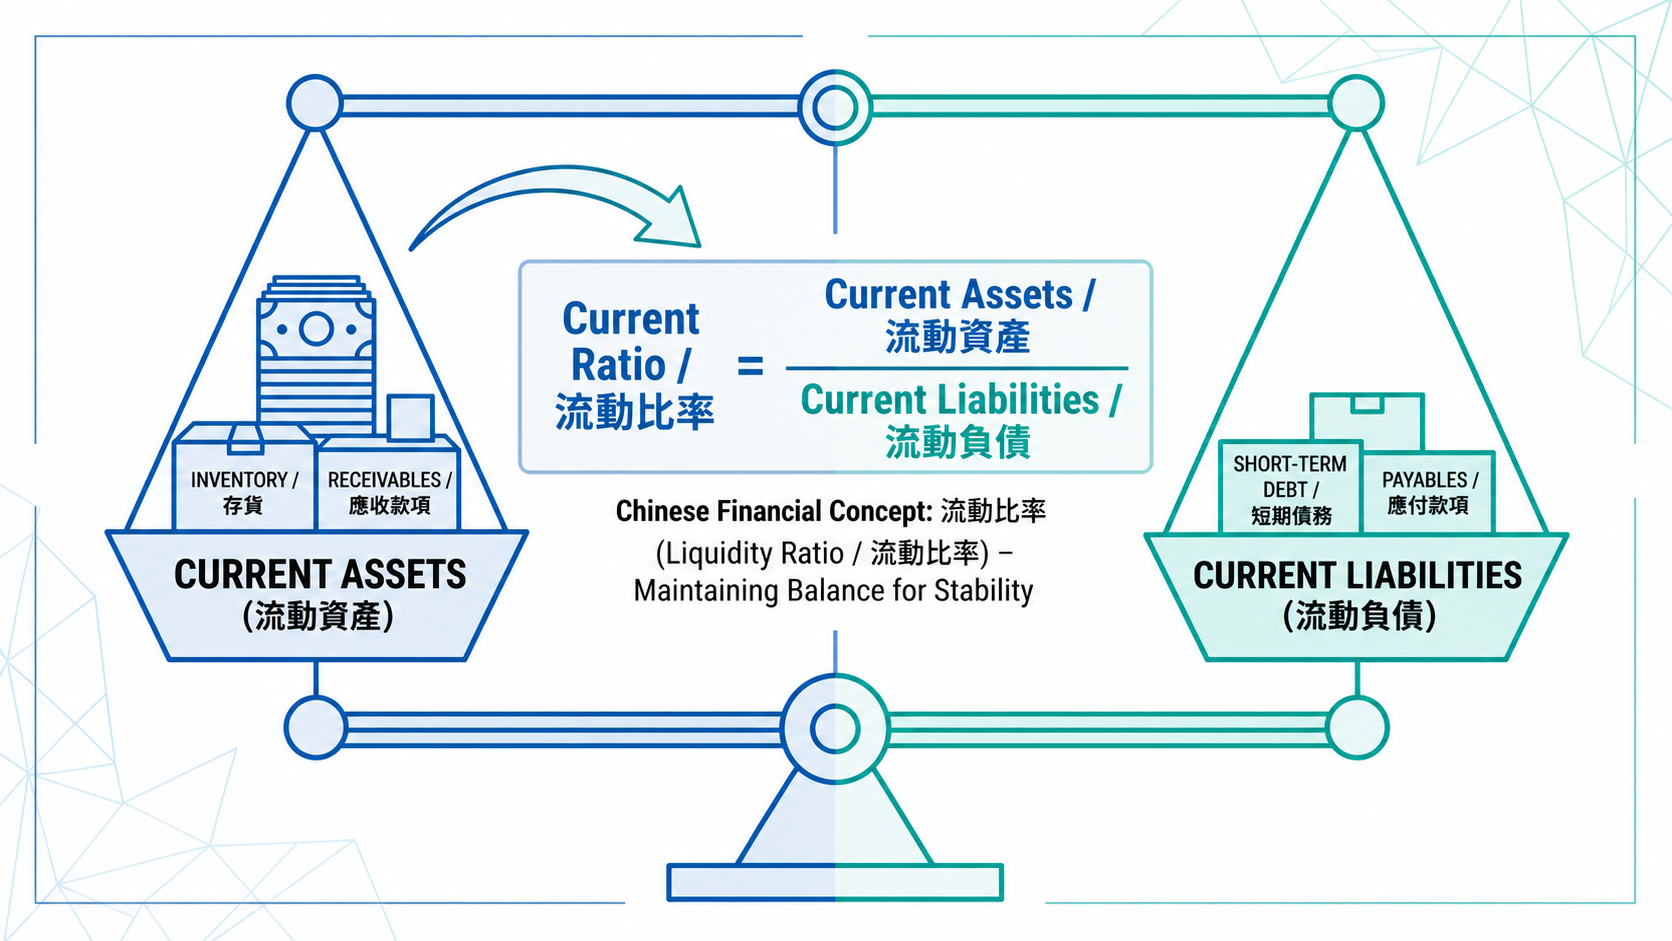
Current Ratio = Total Current Assets ÷ Total Current Liabilities
The result is expressed as a multiple (e.g., 1.5x) or a percentage (e.g., 150%).
Example Calculation
Suppose Company A has current assets of HKD 8 million and current liabilities of HKD 4 million:
Current Ratio = 8 million ÷ 4 million = 2.0
This means that for every HKD 1 of current liabilities, Company A has HKD 2 in current assets, indicating a strong financial cushion. These figures can be found on the company’s balance sheet, and you can look up the financial statements of Hong Kong-listed companies on the Hong Kong Stock Exchange (HKEX).
Tip: It's advisable to compare a company's current ratio trends from the past three to five years. Trends are more insightful than a single period figure.
How to Interpret the Current Ratio?
| Current Ratio | General Interpretation |
|---|---|
| Below 1.0 | Current liabilities exceed current assets, higher short-term repayment risk |
| 1.0 to 1.5 | Can generally meet short-term debt, but with limited financial buffer |
| 1.5 to 2.0 | Usually considered healthy with a comfortable buffer |
| Above 2.0 | Low financial stress, but may indicate under-utilized funds |
When the ratio is below 1.0, even liquidating all current assets might not be enough to pay off short-term debt. Conversely, a very high ratio (e.g., above 3.0) may reflect excessive cash or inventory holdings, pointing to inefficient use of capital.
Note: Investment decisions should be based on a holistic evaluation, including profitability, industry trends, and the company’s overall financial structure. Do not rely solely on the current ratio.
How Industry Differences Affect the Current Ratio

Current ratio benchmarks can vary significantly by industry, so always compare a company’s ratio with industry peers.
- Retail & Food Industry: Inventory turnover is fast; ratios between 1.0 and 1.5 are considered normal
- Manufacturing: Requires holding large amounts of raw materials; ratios usually fall between 1.5 and 2.0
- Technology & Services: Lower inventory levels, so ratios may be lower—but this doesn't mean financial weakness
- Construction & Engineering: Highly volatile cash flows; generally need higher ratios for safety
You can use Longbridge’s stock screener to filter companies by industry and compare current ratios, facilitating peer-to-peer financial data comparisons.
Current Ratio vs. Quick Ratio
The quick ratio also measures short-term repayment ability but uses a more conservative calculation:
Quick Ratio = (Current Assets − Inventory − Prepaid Expenses) ÷ Current Liabilities
The quick ratio excludes inventory and other assets that may be harder to liquidate immediately, providing a clearer picture of a company's debt-paying ability without relying on inventory.
| Indicator | Current Ratio | Quick Ratio |
|---|---|---|
| Includes Inventory? | Yes | No |
| Level of Conservatism | More lenient | Stricter |
| Suitable for Industry Types | Sectors with fast inventory turnover | Companies with a high proportion of inventory |
For manufacturing or retail companies, the quick ratio often gives a better indication of immediate repayment capacity. You can use Longbridge’s analytical tools to check key financial metrics for the companies you follow.
Limitations of the Current Ratio
Does not reflect asset quality: If inventory is unsellable or obsolete, it cannot be realized at book value, which may overstate the actual repayment ability.
Is only a snapshot in time: Financial statements reflect the position at the reporting date. Some companies may accelerate collections or delay payments before period-end, temporarily boosting their current ratio.
Must be combined with cash flow analysis: A high current ratio does not necessarily mean stable cash flow. For a more comprehensive analysis, you can check listed companies’ financial data on the Longbridge market data page.
Frequently Asked Questions
What is considered a healthy current ratio?
Generally, a current ratio between 1.5 and 2.0 is considered healthy. However, industry norms differ; comparing with peers gives a more accurate assessment.
Does a low current ratio mean a company has financial problems?
Not necessarily. For companies in sectors with fast inventory turnover, such as retail or food, a current ratio below 1.5 may be normal. Assessments should take into account industry practices, cash flow, and other financial metrics.
Where can I find a company’s current ratio data?
You can find these figures in the balance sheet section of a company’s financial report, or check the financial data of Hong Kong–listed companies using the Longbridge market data tool.
Conclusion
The current ratio is a fundamental tool for assessing a company’s short-term financial health, but it is not the only measure you should consider. Understanding how to calculate it, interpreting its value accurately, and comparing it across industries and alongside other financial indicators helps you evaluate the short-term debt-paying ability of the companies in your portfolio more comprehensively. Financial analysis is an ongoing process, and building a complete analytical framework is a long-term pursuit.
Which analytical tools you use will depend on your investment goals, risk tolerance, market outlook, and level of experience. Regardless of the tool you select, it is important to fully understand its function, risk characteristics, and trading rules, and to set up sound risk management plans. To learn more about investing, visit Longbridge Academy or download the Longbridge App.