Financial Statements: A Complete Guide for Stock Investors
Understand the three core financial statements every stock investor needs to know: income statement, balance sheet, and cash flow statement.
TL;DR: Financial statements serve as the primary diagnostic tools for assessing a company's fundamental health and intrinsic value. Investors must master the interplay between the income statement, balance sheet, and cash flow statement to distinguish genuine growth from mere accounting maneuvers. Together, they confirm if a business is a cash-generating engine or a "paper tiger" sustained by debt.
Every listed stock is an equity stake in a living business whose narrative is written in numbers. Financial statements are where that narrative unfolds. For investors seeking to transition from speculative guesswork to evidence-based conviction, deciphering these documents is not just a technical skill—it is a competitive necessity.
Mastering this framework does not require a CPA designation; rather, it demands a disciplined eye for how capital flows through an organization. This guide deconstructs the three essential pillars of financial reporting, the ratios that reveal operational efficiency, and a systematic process for evaluating securities. You can also explore investment education resources at Longbridge Academy to build your financial literacy further.
Why Financial Statements Matter for Stock Investors
When you buy a share of stock, you are buying a small ownership stake in a real business. The price you pay should reflect what that business is genuinely worth — and financial statements provide the underlying data to make that assessment.
According to the US Securities and Exchange Commission (SEC), public companies are required to release financial statements on a quarterly and annual basis. This transparency allows investors to compare performance against historical results, industry peers, and broader market expectations.
Financial statements help investors answer five fundamental questions:
Growth Trajectory: Is the company expanding its top-line revenue and bottom-line earnings sustainably?
Solvency: Does the enterprise possess sufficient assets to extinguish its liabilities?
Cash Quality: Is the business converting accounting profits into tangible liquidity?
Debt Profile: Is the leverage ratio manageable relative to interest coverage?
Capital Allocation: Is management reinvesting profits with a high return on invested capital (ROIC)?
While these documents offer unparalleled transparency, investors should remain aware of their inherent limitations: they are backward-looking by nature and subject to accounting estimates that can occasionally mask underlying operational friction.
The Three Core Financial Statements
Publicly traded firms utilise three distinct yet integrated reports to communicate their financial status. Each document offers a specialised lens through which to view the business.
The Income Statement
The income statement — also called the profit and loss (P&L) statement — reports a company's revenues, expenses, and profits over a specific period, typically a quarter or a full year.
It begins at the top with total revenue (also called the "top line") and works downward:
Revenue minus the cost of goods sold (COGS) equals gross profit
Gross profit minus operating expenses equals operating income
Operating income minus interest and taxes equals net income (the "bottom line")
Investors track how revenue and net income change over time. Most income statements show figures for the current period alongside the same period in the prior year, making it easy to spot growth trends or deterioration. Key metrics include earnings per share (EPS) and profit margins.
The Balance Sheet
The balance sheet provides a snapshot of what a company owns and owes at a specific point in time — typically the end of a quarter or financial year. It follows one simple equation:
Assets = Liabilities + Shareholders' Equity
Assets: Cash, receivables, inventory, property, and investments
Liabilities: Short-term debt, accounts payable, and long-term borrowings
Shareholders' equity: What remains for shareholders after subtracting all liabilities from assets
A company whose assets significantly exceed its liabilities generally signals financial stability. If liabilities are growing faster than assets over several periods, that warrants closer scrutiny.
The Cash Flow Statement
The cash flow statement tracks the actual movement of cash in and out of a business over a period. It is divided into three sections:
Operating activities: Cash generated from core business operations
Investing activities: Cash from or spent on capital expenditures and acquisitions
Financing activities: Cash flows related to debt, share issuances, or buybacks
Tip: A company can report positive net income while simultaneously running low on cash. Positive operating cash flow confirms the business model is working in practice, not just on paper.
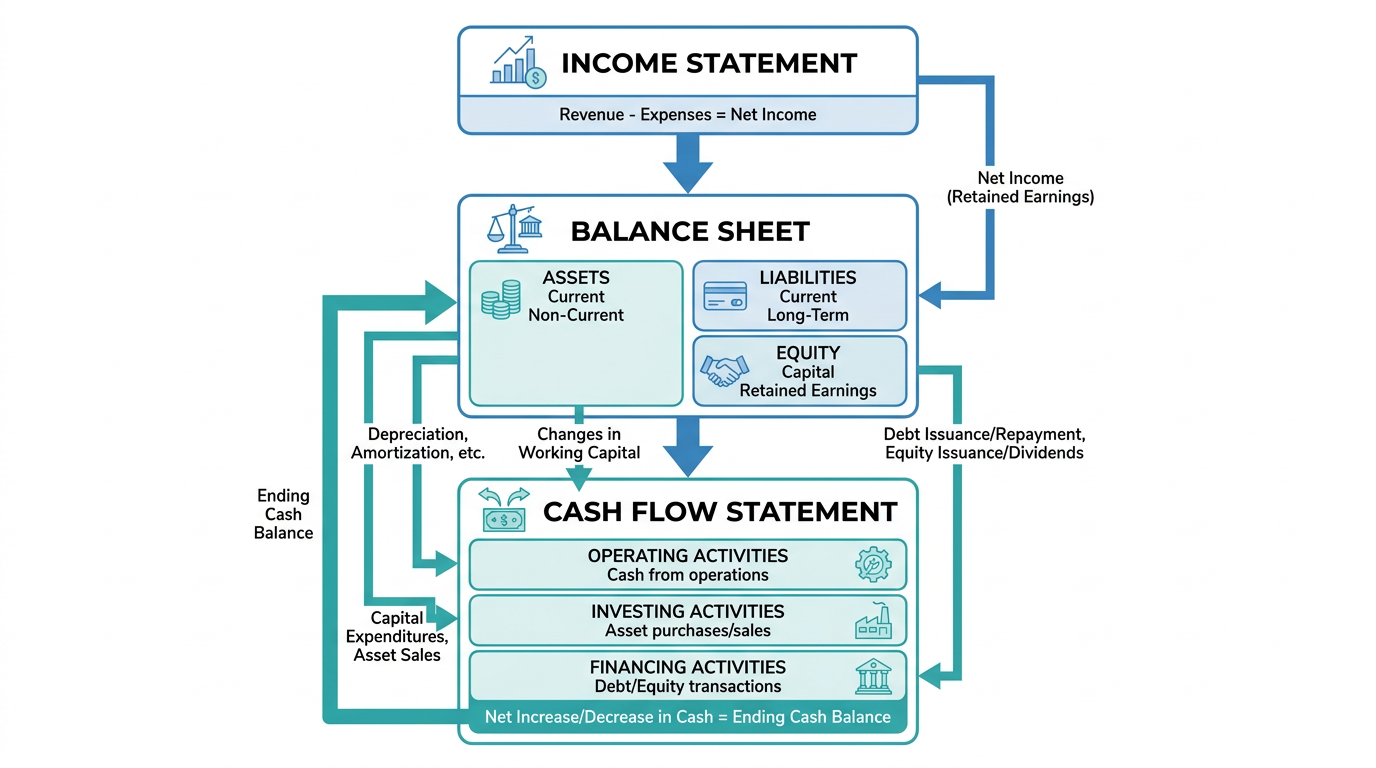
How the Three Statements Connect
These documents form a closed-loop system. They are not isolated silos but rather different perspectives of the same economic entity.
Net income from the income statement flows into the balance sheet as "retained earnings" within shareholders' equity. Simultaneously, depreciation expenses recorded on the income statement are added back in the cash flow statement because they represent a non-cash charge. Finally, the "ending cash balance" on the cash flow statement must match the "cash and cash equivalents" line item on the balance sheet.
When these connections fail to align—for example, if a company reports soaring profits while its cash balance steadily evaporates—it often signals aggressive revenue recognition or brewing liquidity trouble.
Key Financial Ratios Every Investor Should Know
Ratios transform raw data into actionable intelligence, facilitating "apples-to-apples" comparisons between companies of vastly different scales.

You can screen stocks by financial metrics using Longbridge's stock screener to filter companies before diving deeper into their statements.
Ratios from the Income Statement
Gross profit margin: Gross profit divided by revenue. Measures production efficiency.
Net profit margin: Net income divided by revenue. Indicates overall profitability after all costs.
Price-to-earnings (P/E) ratio: Share price divided by earnings per share (EPS). A widely used measure of whether a stock appears expensive or reasonably valued.
Ratios from the Balance Sheet
Current ratio: Current assets divided by current liabilities. A ratio above 1 suggests the company can meet short-term obligations.
Debt-to-equity (D/E) ratio: Total liabilities divided by shareholders' equity. Acceptable levels vary considerably by industry. While some debt can magnify returns, excessive leverage increases the risk of bankruptcy during a credit crunch.
Ratios from the Cash Flow Statement
Free cash flow: Operating cash flow minus capital expenditures. Consistent positive free cash flow provides flexibility to reinvest, pay dividends, or reduce debt.
Operating cash flow to net income: A ratio consistently below 1 over multiple periods may warrant closer examination.
Tip: No single ratio tells the full story. Always evaluate ratios in context — against the company's own history and against peers in the same sector.
How to Analyse Financial Statements Step by Step
A systematic approach reduces the risk of overlooking important details:
Step 1: Start with the income statement. Review revenue trends across four to eight quarters and check whether gross margins are stable, expanding, or compressing.
Step 2: Move to the balance sheet. Assess total debt relative to equity and assets. Check whether cash has been growing or declining over recent periods.
Step 3: Review the cash flow statement. Confirm operating cash flow is consistently positive and compare free cash flow with net income to assess earnings quality.
Step 4: Read the notes and MD&A (Management Discussion and Analysis). The MD&A explains management's view of risks and outlook. Footnotes contain disclosures on accounting policies and contingent liabilities that affect how numbers should be interpreted.
Step 5: Look for patterns over multiple periods. Trends across several years are far more reliable than a single quarter, which can be distorted by one-time events.
For well-researched analysis on specific companies and sectors, explore in-depth research and company analysis through Longbridge's Dolphin Research.
Where to Find Financial Statements
For US-listed stocks, the SEC's EDGAR database (sec.gov) hosts quarterly 10-Q filings and annual 10-K reports. Singapore-listed companies publish statements via the Singapore Exchange (SGX) at sgx.com. Hong Kong-listed companies file through the Hong Kong Exchanges and Clearing (HKEX) platform.
You can also track live market data and access financial information for stocks across multiple markets within the Longbridge platform.
Tip: Go directly to the company's investor relations page or the relevant exchange database for primary source documents, rather than relying on third-party summaries.
Common Red Flags in Financial Statements
Knowing what signals concern is as valuable as knowing what signals strength:
Revenue growing but margins shrinking: May indicate rising costs or pricing pressure
Net income rising but operating cash flow falling: Could suggest aggressive revenue recognition or working capital issues
Debt increasing without corresponding revenue growth: Raises questions about how borrowings are being used
Frequent restatements: Repeated accounting corrections may indicate weak internal controls
Qualified auditor opinions: Any opinion other than a standard unqualified report warrants investigation
These patterns do not automatically disqualify a stock — but they do merit better questions before committing capital.
Frequently Asked Questions
What are the three main financial statements?
The three main financial statements are the income statement, the balance sheet, and the cash flow statement. Each measures a different aspect of financial position and performance, and they should be read together for a complete picture.
How often do companies publish financial statements?
Public companies publish financial statements quarterly and annually. In the US, these are filed as 10-Q (quarterly) and 10-K (annual) reports with the SEC. Singapore-listed companies report via SGX; Hong Kong-listed companies file through HKEX.
Do I need an accounting background to read financial statements?
No. Most investors can develop a working understanding by learning the key components of each document and the main ratios derived from them. Starting with companies in industries you know well is an effective approach.
What is the difference between profit and cash flow?
Profit (net income) reflects revenues minus expenses under accounting rules and can include non-cash items. Cash flow tracks actual cash moving in and out of the business. A company can be profitable on paper while generating little cash, which is why both metrics matter.
Where can I find a company's financial statements?
US filings are accessible through the SEC's EDGAR database. Singapore-listed companies publish through the SGX; Hong Kong-listed companies file through HKEX. Many brokers also aggregate this data within their platforms.
Conclusion
Financial statements are the ultimate "truth serum" in the world of investing. They provide a transparent, standardised language for evaluating business performance across borders and industries. By integrating the income statement, balance sheet, and cash flow statement, you move away from following market "hype" and toward building a portfolio based on structural business strength.
While fundamental analysis cannot eliminate market volatility, it provides the conviction necessary to hold through downturns and the discipline to sell when the underlying business reality no longer justifies the stock price.
Explore the range of investment products available on Longbridge across Singapore, US, and Hong Kong markets.
The choice of financial instruments depends on your investment objectives, risk tolerance, market outlook, and experience level. Regardless of the method selected, it is essential to fully understand its mechanics, risk characteristics, and execution rules, while maintaining a robust risk management plan. You can learn more about investment strategies through the Longbridge Academy or by downloading the Longbridge App.