
Doji: Buyers and Sellers Fight to a Draw
Have you ever spotted a candlestick on a chart and found yourself wondering: is the market about to turn?
Starting with this lesson, we’ll learn how to read price action directly from candlesticks.
This approach sets technical indicators aside and focuses on the shape of each candlestick, where it appears, and the price action around it to gauge market sentiment and the balance between buyers and sellers.
Each candlestick is formed by four prices: the open, close, high, and low. Its body and wicks show how price moved during a single trading period.
We’ll begin with individual candlesticks, starting with the doji.
A doji is easy to recognize. The open and close are very close together, leaving a body that looks almost like a line. Its upper and lower wicks can vary in length.
Here’s the story behind the shape: price moved up and down during the trading period, but by the close, it had returned to roughly where it started. Buyers and sellers pushed back and forth, and for the moment, neither side gained a clear advantage.
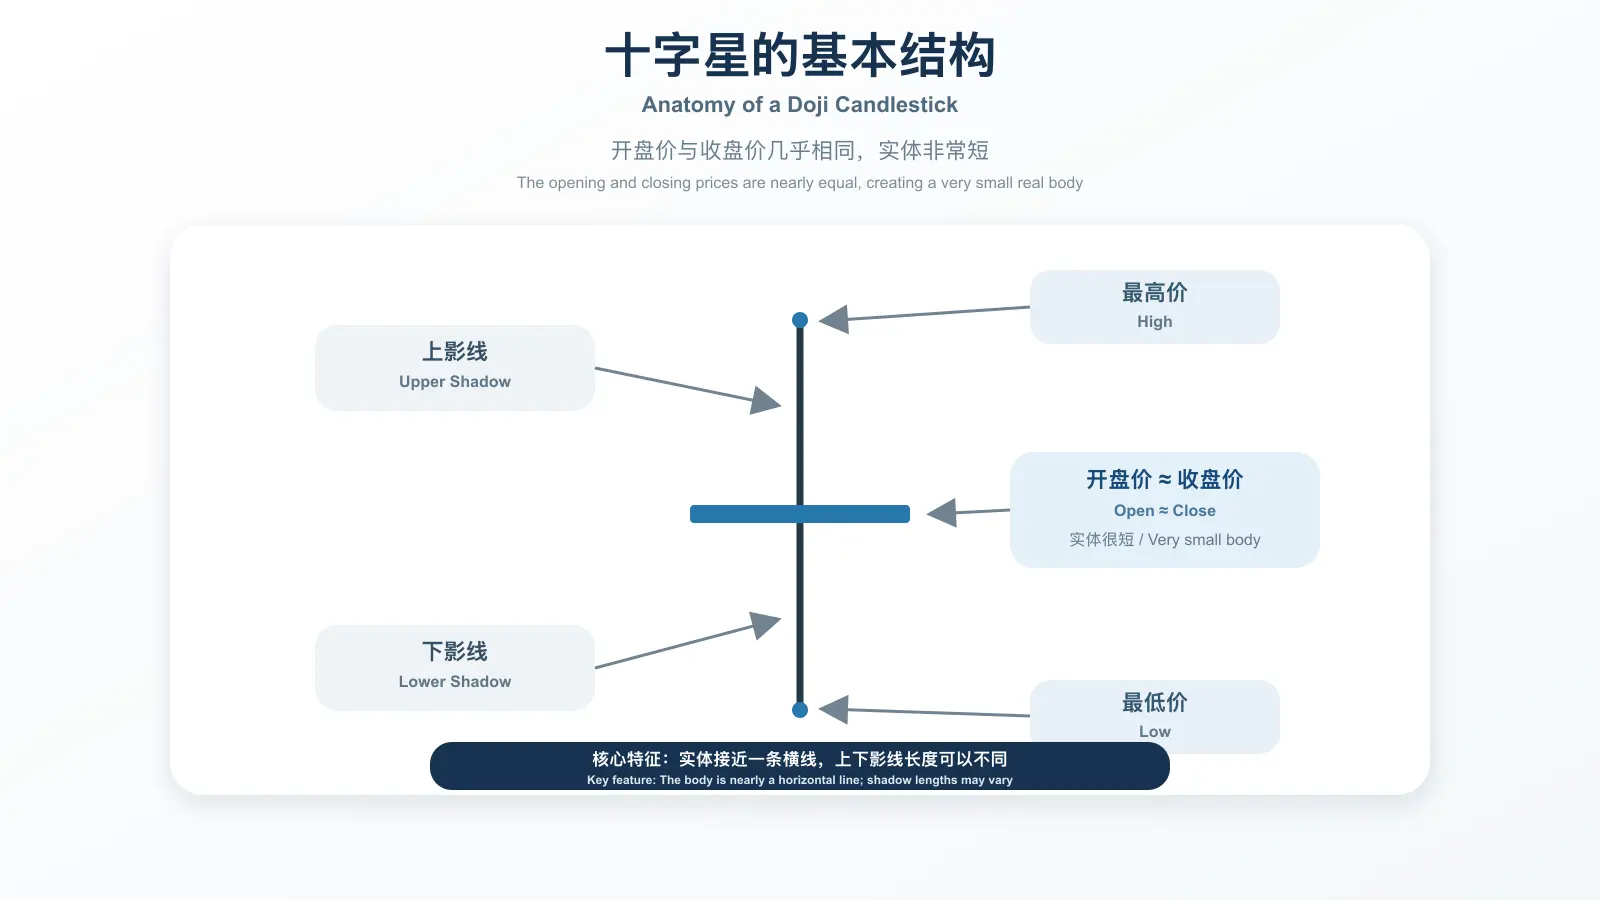
A doji does not tell you on its own whether price will rise or fall next. It is better understood as a sign of hesitation, or a temporary pause in the force that had been driving the move.
- After a sustained rally, a doji near the highs may suggest that buyers are beginning to hesitate and that upward momentum is weakening. Watch for further signs of weakness.
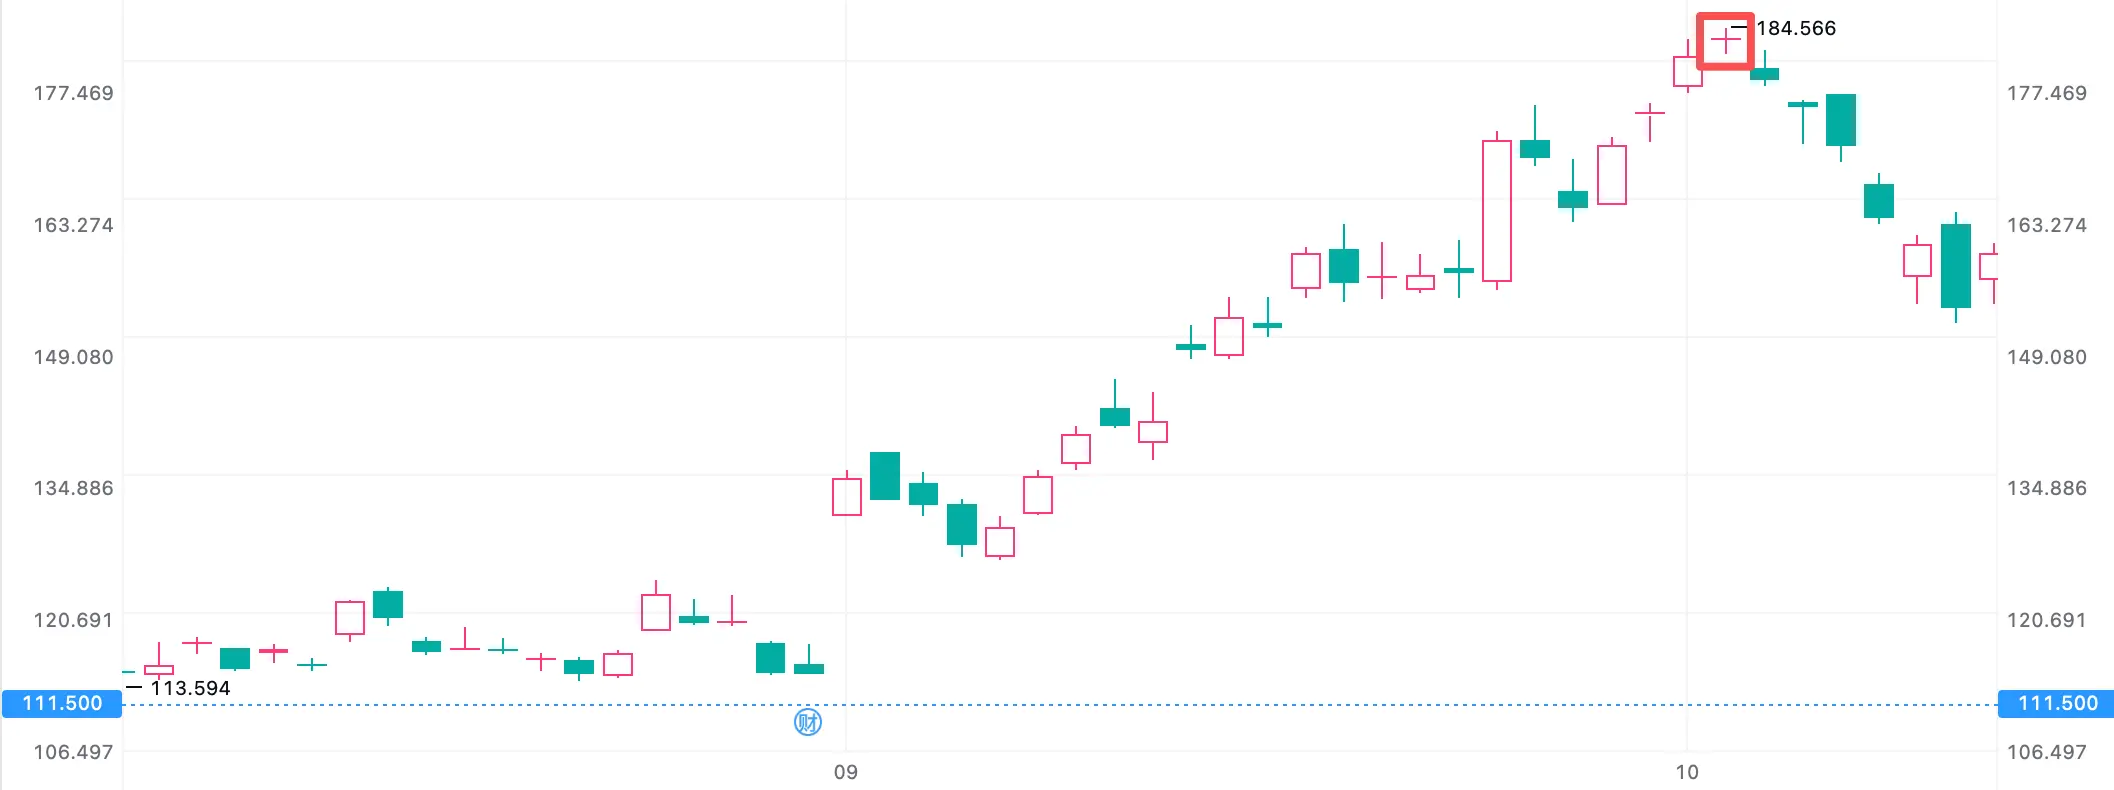
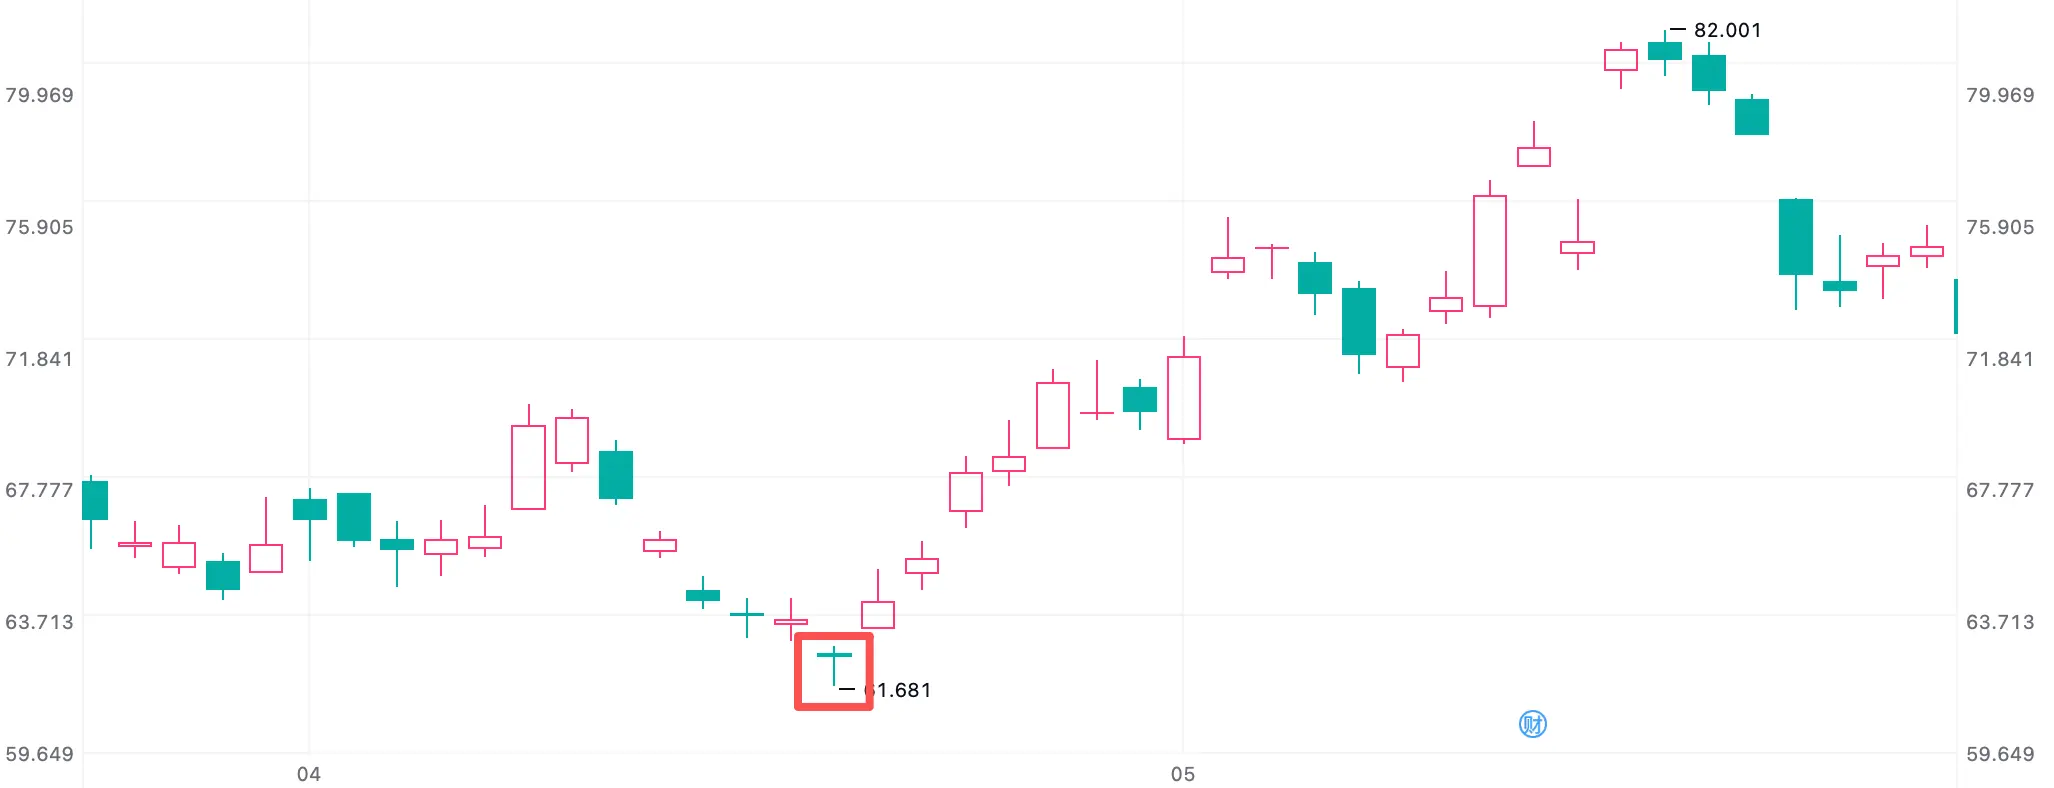
- After a sustained decline, a doji near the lows may suggest that selling pressure is beginning to ease and that price may be attempting to stabilize.
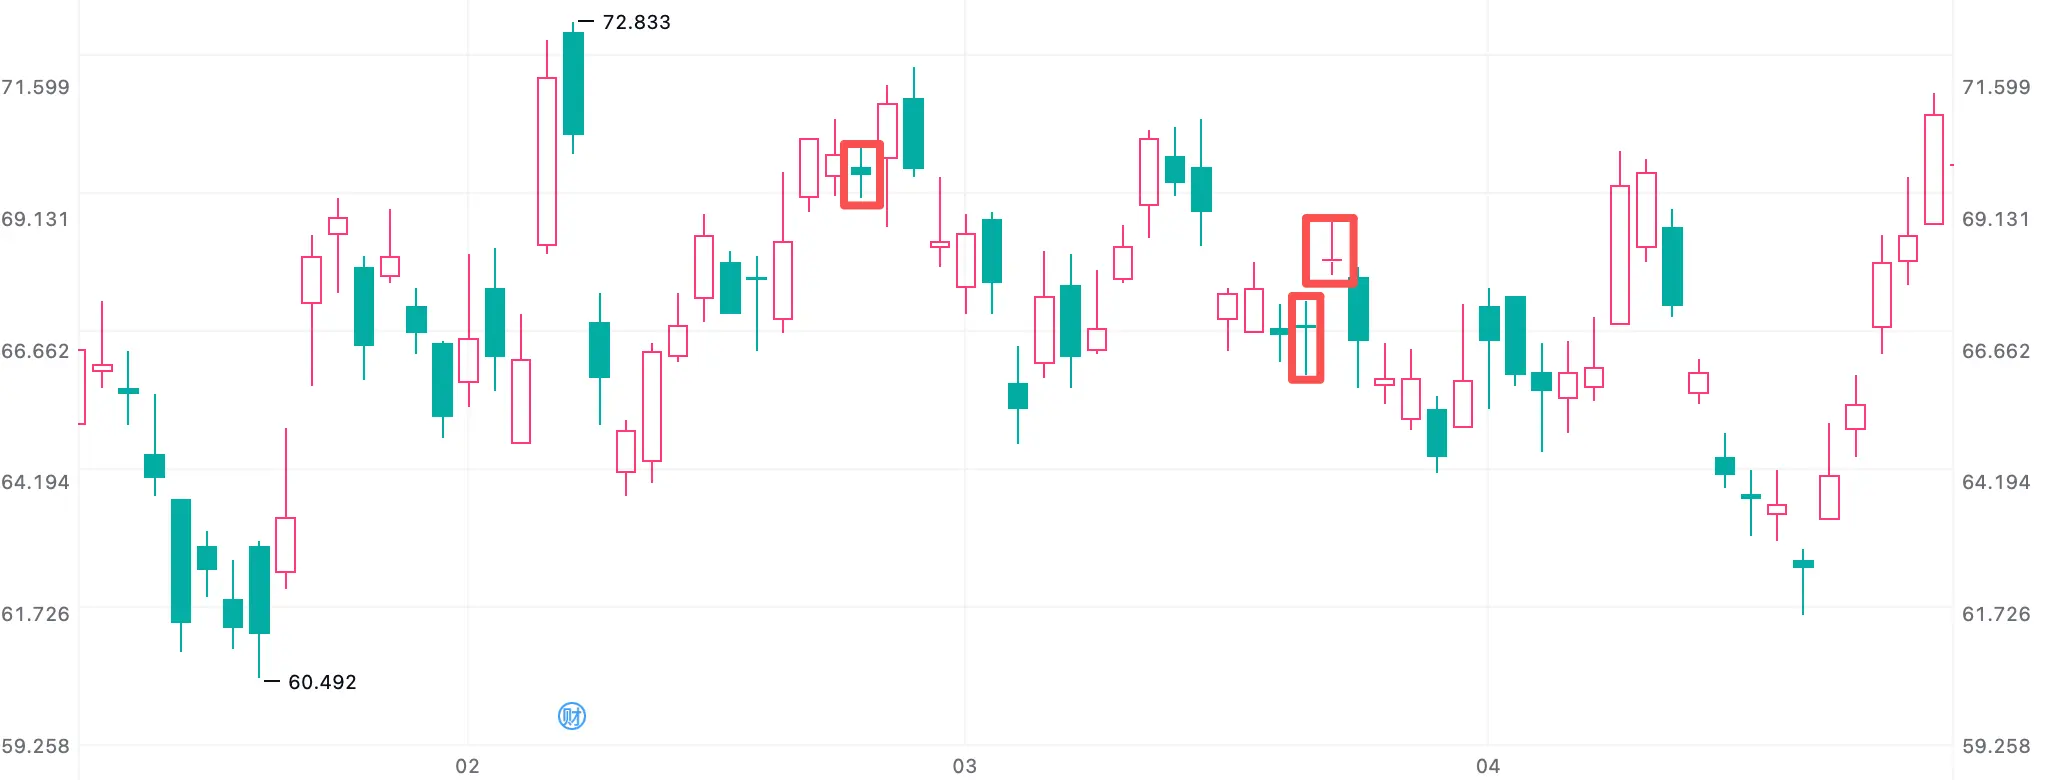
- Within a range that has no clear direction, a doji usually reflects ordinary back-and-forth trading between buyers and sellers and carries relatively little significance.
So when you spot a doji, don’t rush to call a reversal. First look at where it appears, then watch the candlesticks that follow to see whether they provide further confirmation.
At its core, a doji captures a moment of hesitation between buyers and sellers. What that hesitation means depends on the prior trend, where the doji appears, and how price behaves afterward.
The shape is only a clue. Context gives it meaning, and what happens next provides confirmation.
In the next lesson, we’ll look at two other common single-candlestick patterns: the hammer and the hanging man. They share the same shape, but where they appear gives them different names and different meanings.
Disclaimer:
This content is for investor education only, intended to help readers understand financial concepts and indicators. It is not investment advice, an offer, or a commitment of any kind. Views, data, and analysis here are general and not a recommendation for any specific product or strategy.
Investing carries risk, and market moves can result in loss of principal. Before making any investment decision, use independent judgment based on your own finances, goals, and risk tolerance, or consult a licensed financial advisor. The author and publisher accept no liability for losses arising from reliance on this content.
Related Courses
Technical Analysis from Scratch
Build Your Own Market Analysis Framework
Volume Analysis
Understand the Relationship Between Price and Volume
Chart Patterns
Understand Reversals and Continuations Through Price Structure
Technical Indicators
Understand MA, MACD, KDJ, and Other Popular Technical Indicators