
Draw the Trendline First, Read the Pattern Second
Give the same price chart to two people and ask them each to draw a trendline, and you'll often get two different answers: one says the trend is still intact, the other says price has already broken it. More often than not, the disagreement isn't about skill. It comes down to a different read on which levels matter and how the trendline itself should be defined.
Starting with this lesson, we're moving into the study of chart patterns. Before we get into specific patterns like the double bottom, head-and-shoulders top, and triangles, there's one foundational skill to master first: how to draw a trendline worth paying attention to, and how to use it to spot whether the trend is changing.
Many classic patterns look completely different from each other, but the underlying logic never changes: which direction price was originally moving in, which levels kept influencing market behavior, and when that original rhythm broke down.
A Trendline Is More Than a Line Between Two Points
Let’s quickly review the basic method:
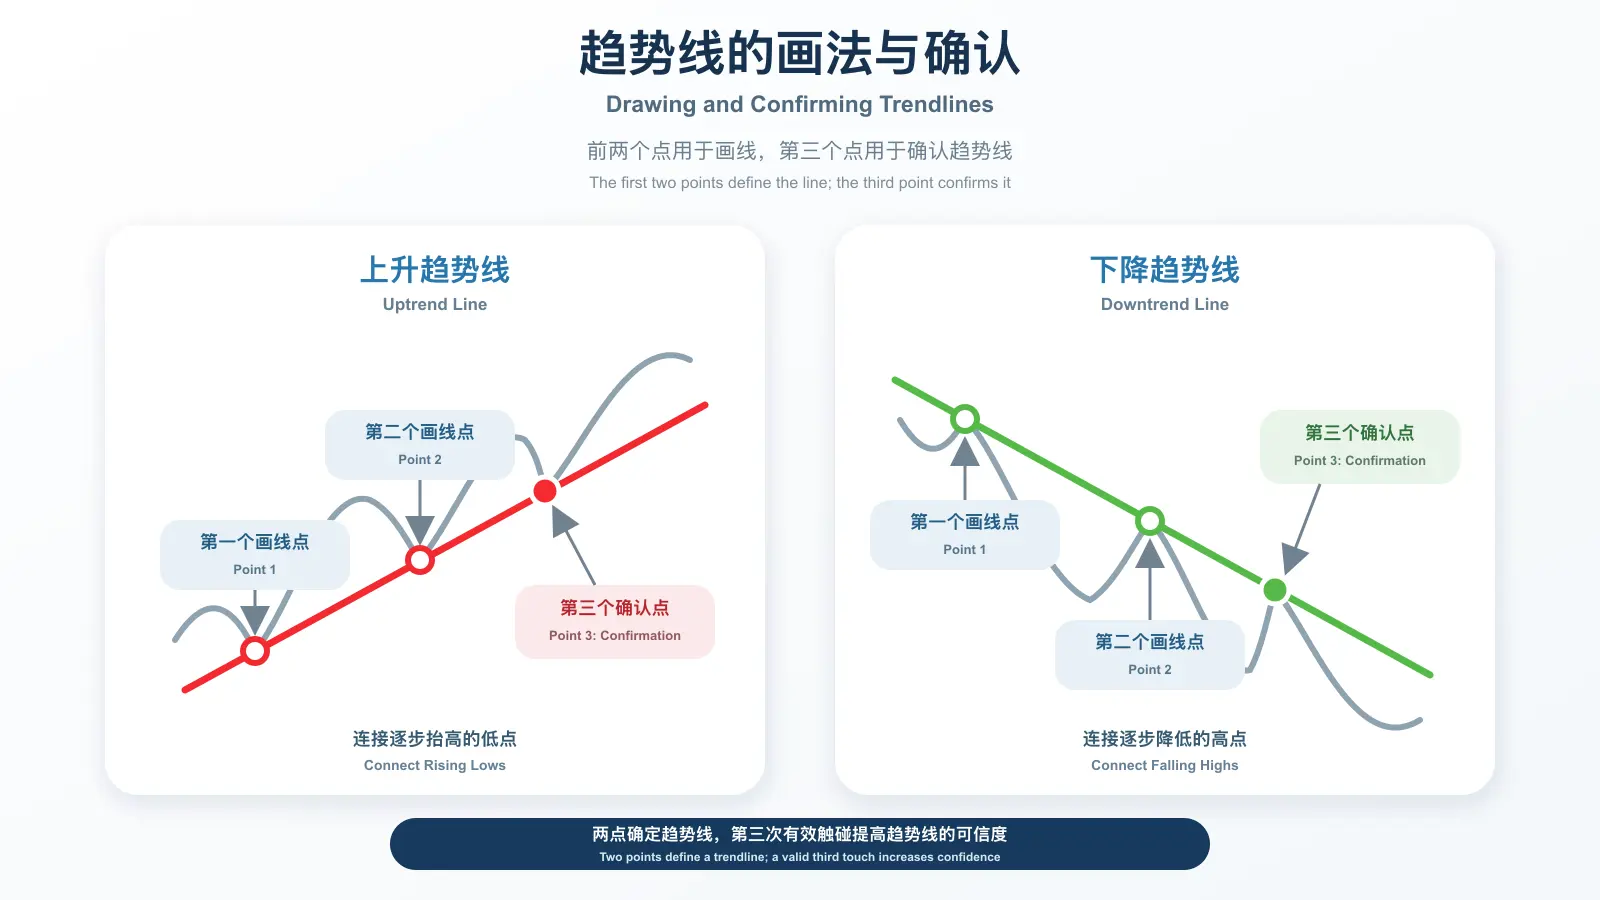
- In an uptrend, connect two or more clear lows to draw an uptrend line.
- In a downtrend, connect two or more clear highs to draw a downtrend line.
The idea is simple. But when looking at an actual chart, beginners often choose any two points that seem close enough and connect them. This may give you a line, but it does not necessarily mean that the line reflects the main trend.
A useful trendline will generally meet a few basic conditions.
- Use at Least Two Points—Preferably Three or More
Two points are enough to draw a straight line, but a line based on only two points may still be a coincidence.
If price later returns to the same area and a third clear high or low also lies roughly along the line, it means price has followed a similar path more than once. This usually makes the trendline more useful as a reference.
- Connect Clear Highs or Lows, Not Minor Price Swings
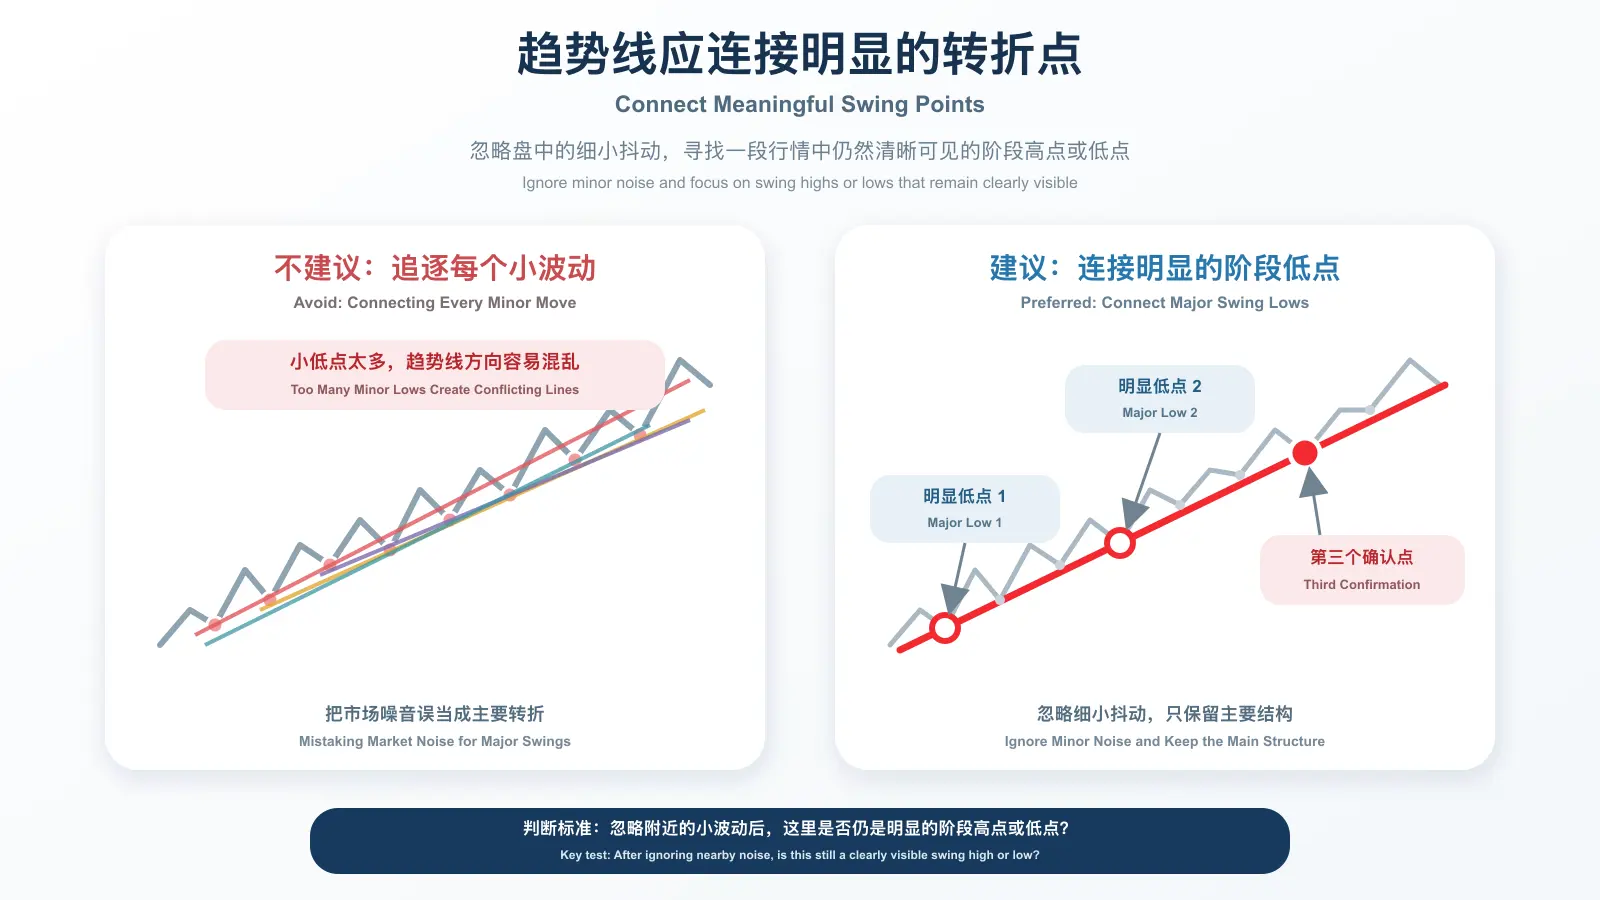
A trendline should connect the more obvious turning points in a price move, not just any small intraday dip or bounce.
When price is moving back and forth within a narrow range, it is easy to pick two minor lows and connect them. If you keep doing this, you may end up with many lines pointing in different directions. The more lines you draw, the harder it becomes to see the real trend.
To decide whether a point is worth using, ask yourself: if I ignore the smaller price movements around it, does this point still stand out as a clear swing high or swing low?
If the answer is no, it is probably not a good point to use for the main trendline.
- Do Not Mistake a Sharp Short-Term Move for the Main Trend
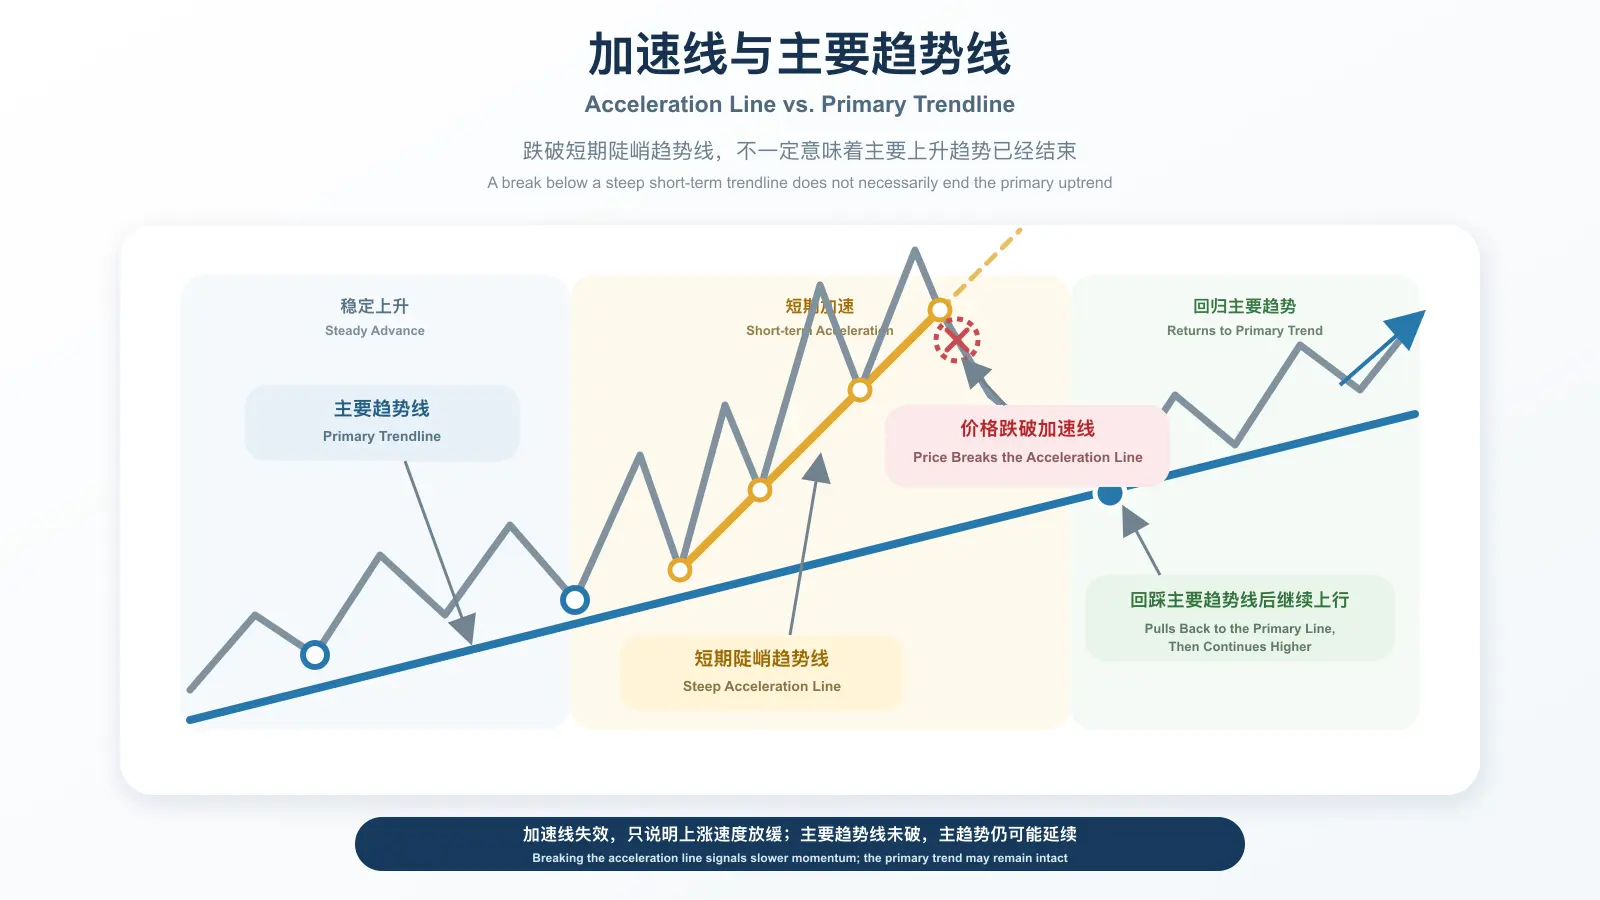
Sometimes price rises or falls very quickly over a short period, creating an extremely steep trendline. The acceleration may be real, but it is usually difficult to maintain for long.
Once price returns to a more normal pace, it may quickly cross that steep line. A break below a steep uptrend line does not necessarily mean that the broader uptrend has reversed. Similarly, a break above a steep downtrend line does not necessarily mean that a longer-term decline is over.
The first thing it tells you is that the short-term acceleration has ended.
However, a break in the short-term trend should not be ignored. Even if price eventually continues along a gentler main trend, it may first go through a deeper pullback or remain in a sideways range for an extended period. It may take a long time for price to return to the pace of the main trend.
For this reason, you need to assess the short-term trend and the main trend separately. If your position or trading plan was based on the short-term acceleration, a break of that trendline should prompt you to reduce your position, exit, or reassess the trade according to the risk management rules you set in advance. You should not simply keep waiting because “the long-term trend may still be intact.”
When drawing your lines, you can look for another trendline with a gentler slope that connects more of the clear highs or lows. Use that line to track the main trend, while keeping the steeper line as a short-term acceleration line.
This lets you see two things at the same time: whether the short-term move has ended and whether the broader trend is still intact.
Once the Trendline Is Drawn, How Can You Tell Whether the Trend Is Changing?
The real purpose of a trendline is not simply to connect a few highs or lows. It is to help you see whether the way price was moving has begun to change.
In an uptrend, price spends most of its time above the uptrend line. When price pulls back toward the line and then turns upward again, it usually means that the line is still acting as support and the existing uptrend remains intact for the time being.
If price clearly breaks below the uptrend line and then fails to move back above it during the next rebound, the previous uptrend may be starting to change.
The opposite applies in a downtrend. Price spends most of its time below the downtrend line. When price rebounds toward the line and then falls again, the line is still acting as resistance, suggesting that the existing downtrend may be continuing. The downward trend may begin to change if price breaks above the trendline and then holds above it.
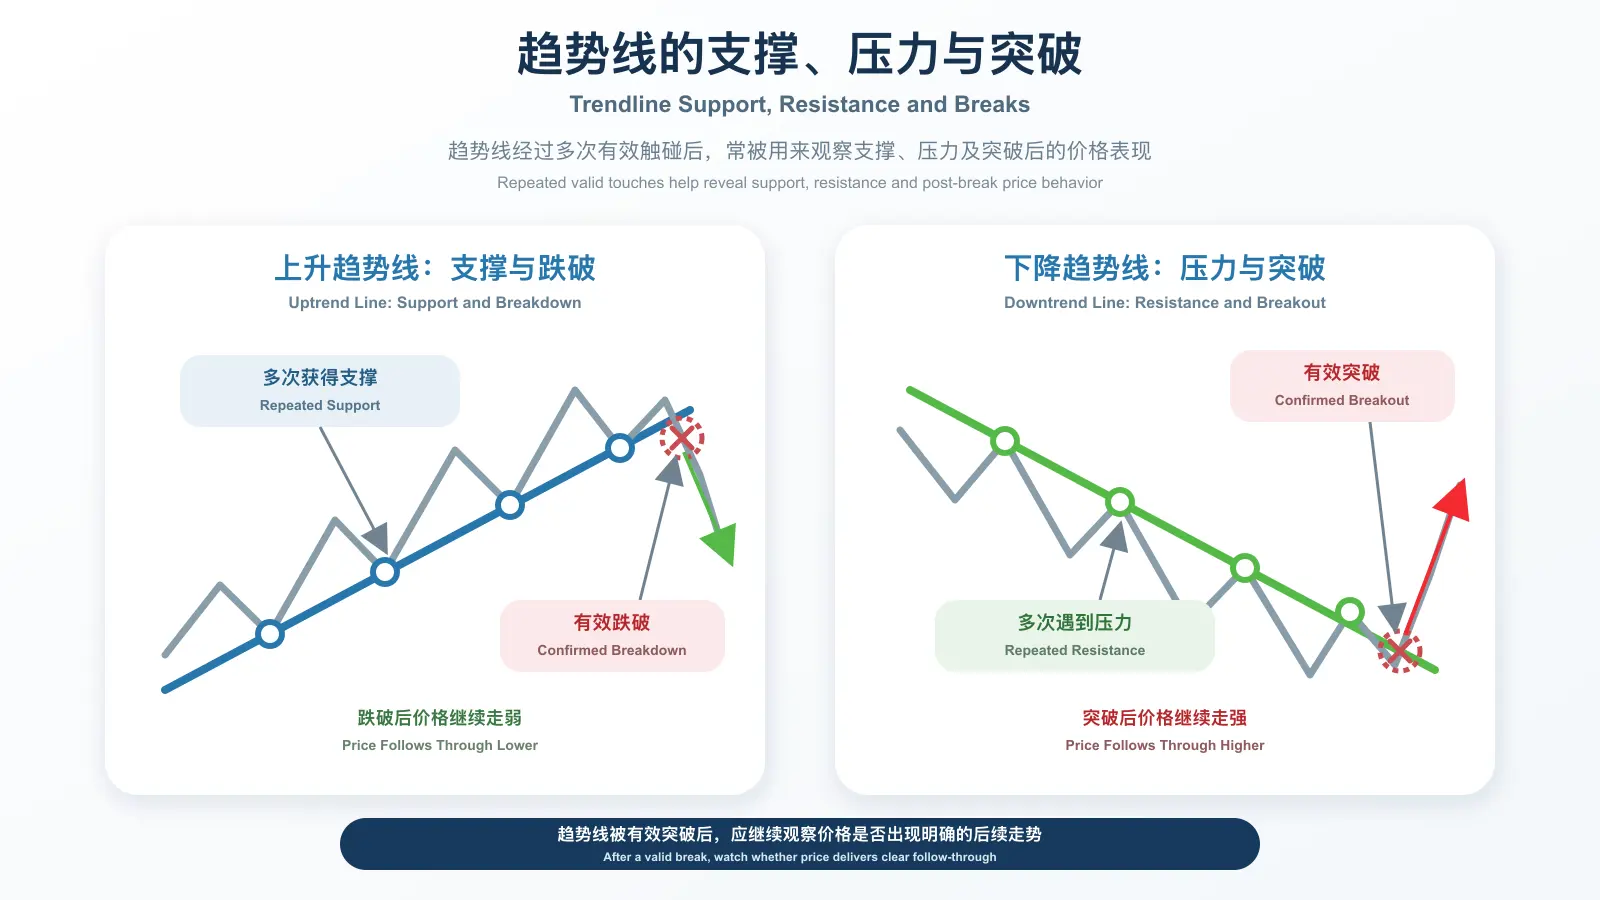
However, crossing a trendline does not automatically mean that the trend has reversed.
Sometimes price moves briefly across a trendline during the trading session but returns to the original side by the close. At other times, price breaks through the line but quickly moves back. In both cases, the price movement that follows has not yet confirmed the break.
To decide whether a trendline has truly been broken, continue watching for the following:
- Whether the closing price is on the other side of the trendline.
- Whether price continues moving in the direction of the break over the next few periods.
- Whether support and resistance switch roles when price returns to test the trendline.
- Whether trading volume is higher than it has been in recent periods when the break occurs.
These conditions do not all need to appear at the same time. However, the more confirmation you see, the more seriously the break should generally be taken.
Even then, a break below an uptrend line is only a warning that the trend may be weakening. It does not mean that price will immediately enter a downtrend. Similarly, a break above a downtrend line is only a sign that price may be gaining strength. It does not mean that a new uptrend has already formed.
To determine whether the trend has truly reversed, you still need to watch the highs, lows, and key price levels that follow.
Extending a Trendline into a Trend Channel
Another common way to use a trendline is to extend it into a trend channel.
In an uptrend, begin by connecting several clear lows to draw an uptrend line. Then draw a roughly parallel line on the other side, connecting the highs. The area between these two lines forms a rising channel. During this stage of the trend, price often moves back and forth within this channel.
For a downtrend, begin by connecting several clear highs to draw a downtrend line. Then draw a roughly parallel line below it, connecting the lows to form a falling channel.
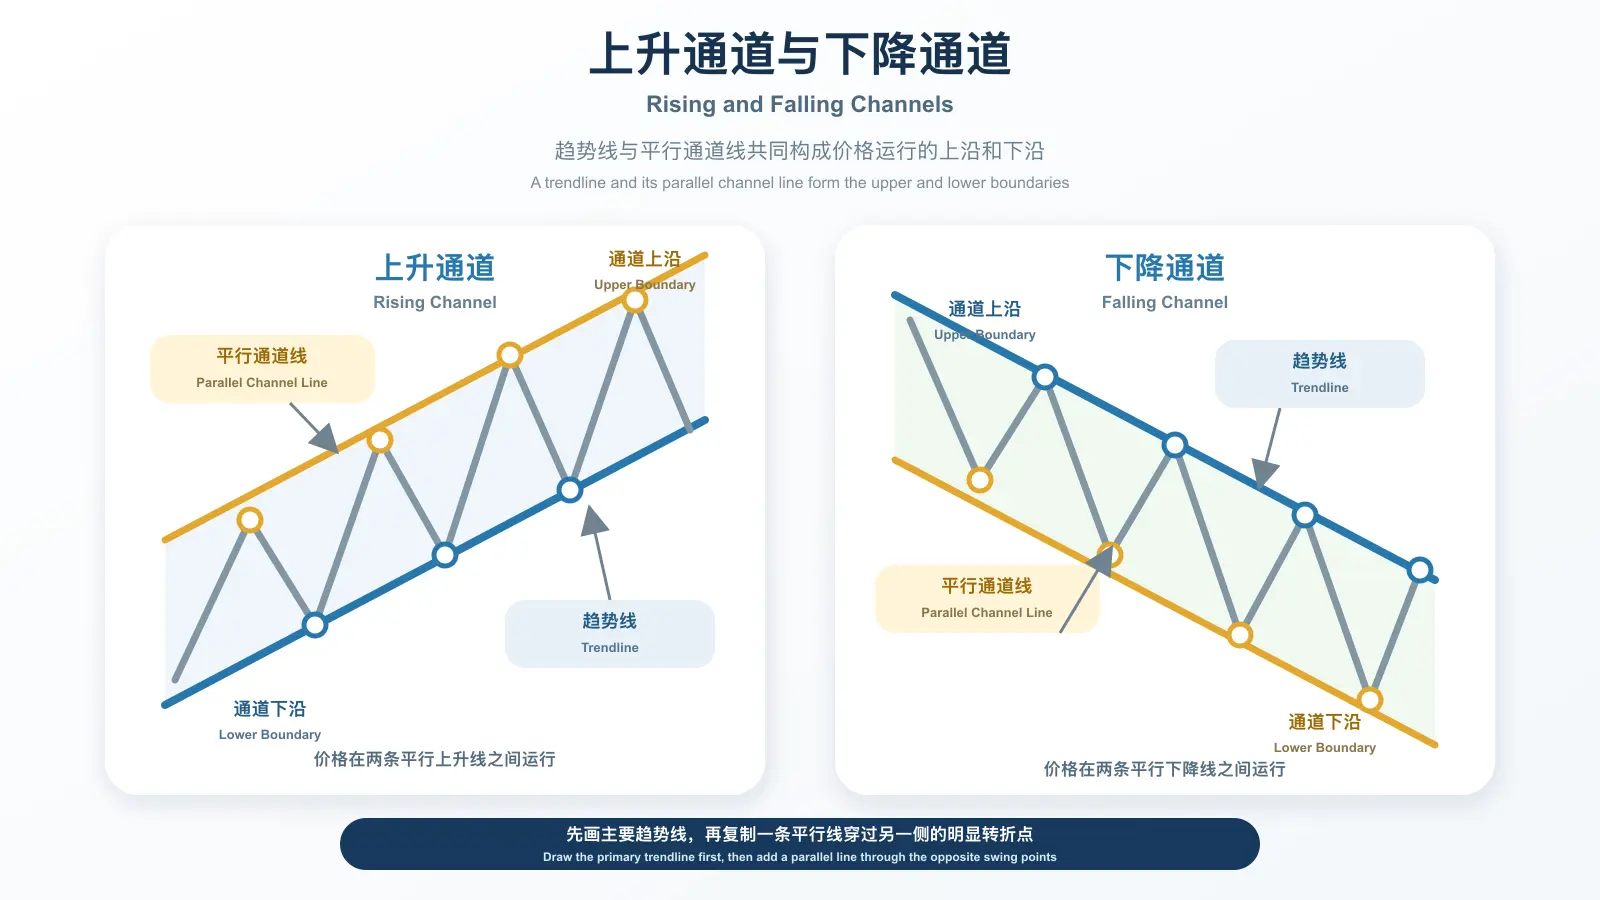
A trend channel gives you a clearer reference range:
- When price is near the lower boundary, it is usually at a relatively low level within the channel.
- When price is near the upper boundary, it is usually at a relatively high level within the channel.
- When price repeatedly moves between the two boundaries, the existing trend may still be continuing.
- When price moves clearly outside the channel and does not return, the previous trend may be starting to change.
These are only relative highs and lows. Being near the lower boundary does not mean that you should automatically buy, just as being near the upper boundary does not mean that you should automatically sell.
What matters is what price does after reaching the edge of the channel: does it find support, meet resistance, or break straight through?
A Channel Is a Reference Range, Not a Track Price Must Follow
Trendlines and channels are not mathematically precise tools.
The two sides of a channel may not be perfectly parallel, and price will not always reverse the moment it touches one of the lines. Some candlesticks may briefly move beyond the edge of the channel, while some reversals may happen before price reaches the line.
There is no need to keep changing the angle of a line just to make every point touch it. You also should not treat one or two minor moves outside the line as proof that the trend has reversed.
A trendline helps you organize seemingly messy price movements into a general trend that is easier to follow. It is a reference, not a rule that price must obey.
After all this explanation, the best way to understand trendlines is to practice drawing them yourself.
Find a price chart and identify the clear highs and lows. Draw the main trendline, then add a parallel line to form a channel. Finally, observe what happens each time price approaches one of the channel boundaries.
With practice, you will gradually realize that what matters is not how neatly the line is drawn. What matters is whether the line helps you see if the previous trend is still intact.
In the next lesson, we will introduce the neckline. It is one of the most important lines in many classic chart patterns and can be thought of as the dividing line between buyers and sellers within a pattern.
Once you understand the neckline, it will become much easier to determine whether a double bottom, double top, or head-and-shoulders pattern has truly been completed.
Disclaimer
This content is for investor education only, intended to help readers understand financial concepts and indicators. It is not investment advice, an offer, or a commitment of any kind. Views, data, and analysis here are general and not a recommendation for any specific product or strategy.
Investing carries risk, and market moves can result in loss of principal. Before making any investment decision, use independent judgment based on your own finances, goals, and risk tolerance, or consult a licensed financial advisor. The author and publisher accept no liability for losses arising from reliance on this content.
Related Courses
Technical Analysis from Scratch
Build Your Own Market Analysis Framework
Volume Analysis
Understand the Relationship Between Price and Volume
Naked Candlestick Analysis
Read the Balance of Power Behind Each Candlestick
Technical Indicators
Understand MA, MACD, KDJ, and Other Popular Technical Indicators