
WMT: Gas Price Spike — Can the Retail King Hold Up?

Before the U.S. market opened on May 21, 2026 (Beijing time), Walmart (WMT) reported Q1 FY27 results (Feb 1–May 1, 2026). Top line beat, but a sharp rise in fuel costs weighed on margin release, and guidance came in below some bullish buy-side expectations, driving intraday weakness. $Walmart(WMT.US)
1) Walmart U.S.: the e-comm flywheel keeps accelerating. Core U.S. comps rose 4.1%, steady overall. Mix-wise, transactions accelerated to +3.0% (vs. +1.6% YoY), while average ticket slowed to +1.1% (vs. +2.8%), signaling a shift from inflation-led price lift to value-led traffic gains and improving growth quality.
E-commerce grew 26%. Within that, Walmart Connect (ads) rose 44% and 3P Marketplace jumped 50% (fastest in ~10 quarters), underscoring a broad-based acceleration in high-margin flywheels.
2) Sam's Club (U.S.): higher volume, lower ticket. Ex-fuel comps rose 3.9% in North America, with transactions up 6.2% and accelerating QoQ, while average ticket fell 2.2%. The ticket pressure mainly reflects a higher mix of lower-ticket, high-frequency grocery and trade-down to Member's Mark private label replacing some higher-priced brands.
E-comm grew 23%. Reserved delivery surged over 90%, contributing roughly half of e-comm growth, suggesting Sam's is expanding into higher-frequency, more immediate-use cases.
3) Walmart International: China Sam's remains the brightest star. By region, China grew 22% YoY, with Sam's still the No.1 growth engine and transactions sustaining double-digit growth, and an exceptionally strong Chinese New Year. This indicates China Sam's is still in a three-fold resonance of store expansion, strong same-store growth, and rising digital penetration.
Walmex (Mexico & C. America) grew 4.1% YoY with some deceleration QoQ, which we attribute to 3P drag. Canada grew 7.4% YoY, benefiting from higher e-comm penetration and a modest QoQ acceleration.
4) Higher fuel costs constrained margin release. Consolidated GPM expanded 20bps YoY to 25.1%. Despite upstream cost inflation and largely stable shelf prices, the modest GPM improvement points to a higher mix of high-margin advertising.
On opex, surging fuel prices lifted fulfillment costs, pushing SG&A up 30bps YoY to 20.9%. Operating income reached $7.5bn (+5% YoY), lagging revenue growth.
5) Key financials at a glance:

Dolphin Research view:
On the positives first — the variables anchoring Walmart’s valuation have broadly continued to improve. These are the true drivers of the multiple.
a) E-comm remains on a high-growth track: global e-comm rose 26%, with U.S. e-comm contributing 530bps to comps (vs. 520bps in Q4), shifting from an incremental channel to a core engine.
b) Ads, the highest-margin business, kept accelerating: global ads rose 37%, with Walmart Connect +44% and faster QoQ, implying traffic monetization is far from a ceiling. This strengthens the structural margin story.
c) Marketplace sales up nearly 50%, a 10-quarter high — more 3P sellers broaden SKUs, lift search and conversion, and reinforce ad monetization. E-comm, ads, and Marketplace are three blades of the same flywheel, and all three are spinning faster.
The sticking point is guidance not moving higher and cautious commentary on the call:
Management flagged that elevated fuel is squeezing consumer budgets, that the Q1 tax refund tailwind will fade from Q2, and that retail price inflation could tick higher in H2 if the high-cost backdrop persists. The market reads this as a tougher macro and heightened consumer strain, which goes straight to the valuation debate.
Before 2022, Walmart traded at a 20–30x retail multiple; in less than two years since H2 2024, it rerated to 45x+. The reset rests on Walmart’s shift from a traditional retailer to an omnichannel fulfillment plus high-margin tech-enabled platform — namely 3P Marketplace, ads, and membership, all high-margin, high-growth, asset-light, driving OP growth to outpace revenue and loosening the low-margin, low-beta retail multiple constraints. Meanwhile, 4,600+ stores have evolved into fulfillment hubs, enhancing resilience and cyclicality management.
But a tech-like multiple assumes sustained OP growth outpacing revenue and repeated guidance raises. With Q1 OP up 5% vs. revenue up 7.3% and no full-year guide-up, both pillars were absent this quarter, prompting a valuation check.
On valuation, based on full-year OP growth guidance of 6–8%, FY27 implies ~42x, down from 45x+, partly digested but still not cheap.
Given high fuel as a likely transitory headwind, and management indicating Q1 is the low point for OP growth, profitability should improve sequentially. With the core flywheel variables — e-comm, ads, Marketplace, membership — all accelerating and still early in profit mix expansion, the story remains intact. If Q2 beats and the FY guide is raised, the multiple could revisit ~45x; in a downside case with prolonged high fuel and weaker consumption, the multiple may compress toward 38–40x. Detailed modeling to follow.
Detailed read-through below:
I. Investment framework
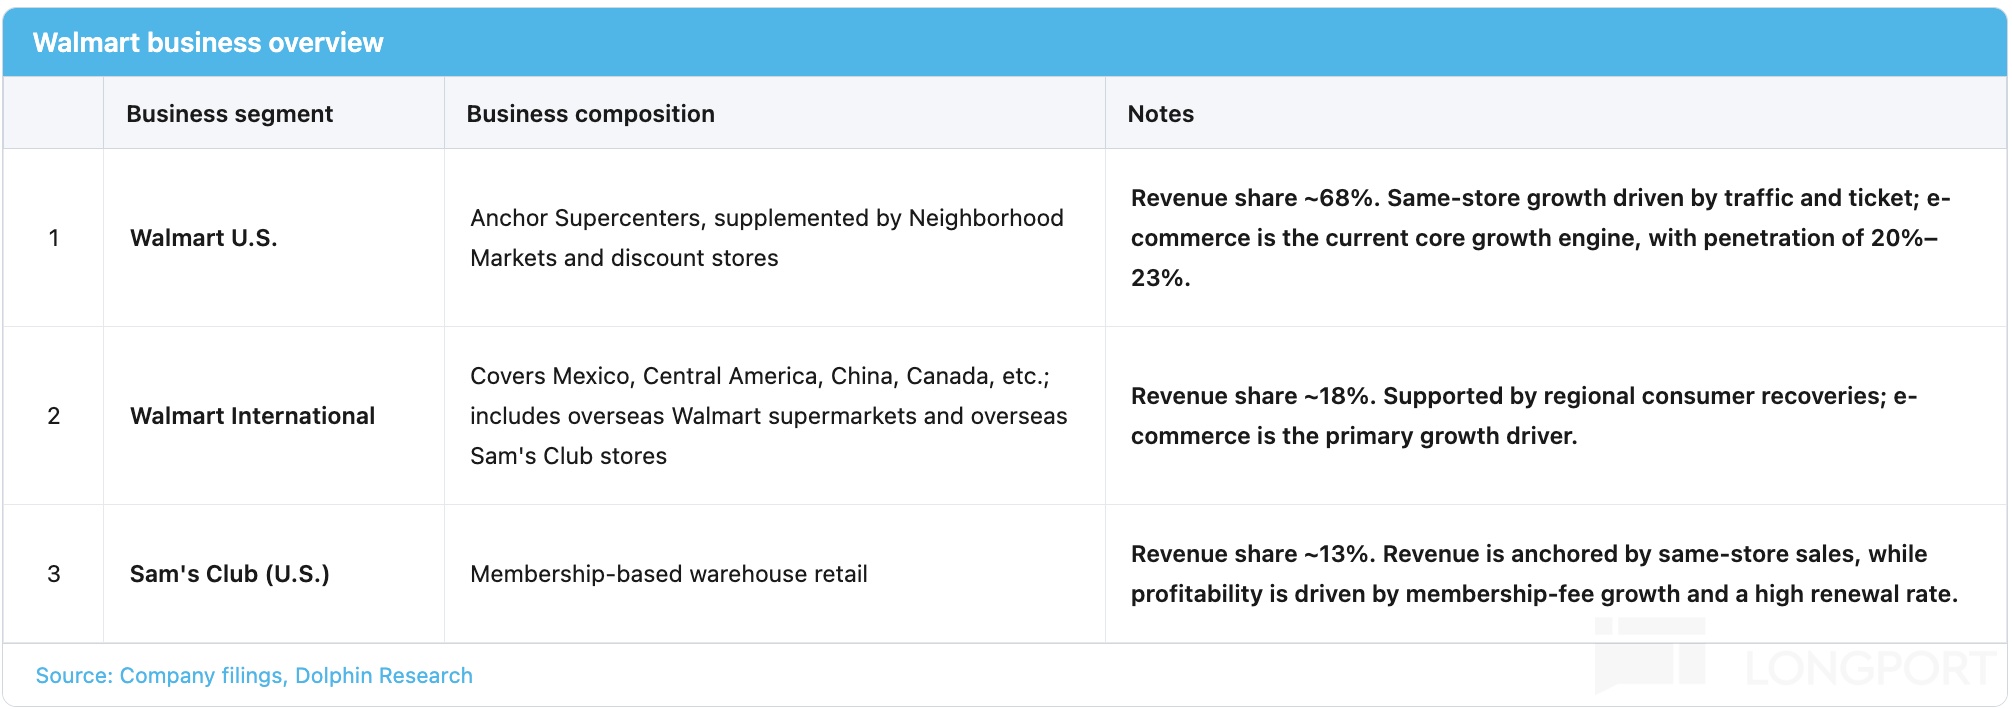
Per disclosures, revenue growth splits into three segments: Walmart U.S., Walmart International, and Sam’s Club U.S. Each segment breaks down further into comps (traffic × ticket), new/closed stores, and e-comm contribution.
(1) Walmart U.S. is the core franchise, with FY26 revenue of ~$483bn (~68% of total). The format is led by Supercenters, complemented by Neighborhood Market and Discount Stores. Comps split into two drivers: transactions and average ticket.
E-comm is the primary growth engine for this segment, now ~20–23% of segment revenue. Internally, it includes 1P first-party sales, 3P Marketplace, Walmart Connect (retail media), and Walmart+ (paid membership), with ads and membership the core profit engines.
(2) Walmart International spans Walmex (Mexico & C. America), China, and Canada, with both Walmart stores and Sam’s Clubs overseas. FY26 revenue was ~$130bn (~18% of total). E-comm penetration varies: China is over 50% (largely Sam’s online), Flipkart in India operates independently, remains loss-making but narrowing losses, while Walmex penetration is ~8–9% and is early in rolling out the U.S.-style ads + Marketplace playbook.
(3) Sam’s Club U.S. is a membership warehouse model, with FY26 revenue of ~$93bn (~13% of total). Revenue relies on steady comps from clubs, while profits leverage membership fee scale and high renewal rates, with Scan & Go and Club Pickup driving digital penetration. In competition with Costco, Sam’s pricing is more aggressive, but product curation and in-club member services still trail somewhat.
II. Walmart U.S.: the e-comm flywheel keeps accelerating
2.1 Volume is the core driver of comps
North America delivered $117.2bn in Q1 FY27 revenue, up 4.5% YoY, steady overall.

Ex-fuel comps rose 4.1%. Transactions rose 3.0% and average ticket rose 1.1%, pointing to a volume-led recovery.
Transactions: we believe the key incremental driver remains ongoing downtrading by higher-income households (>$100k). With sustained upgrades in fresh and private label quality and 3-hour express delivery building out omnichannel fulfillment, convenience and experience keep improving, drawing more high-income households to Walmart.
By category, low-single-digit growth in grocery aligns with resilient staples. General merchandise posted mid-single-digit growth, accelerating from low-single digits last quarter and delivering its strongest share gains in nearly five years.
This matters because only share gains in general merchandise signal rising platform attractiveness. It is a stronger proof-point than staples alone.
Average ticket: food inflation is easing, and Walmart stepped up Rollbacks to drive value for core middle- and lower-income shoppers and take share. Both factors weighed on ticket growth but strengthened wallet share.

Store openings/closures: Walmart added three Supercenters in Q1 FY27, reflecting disciplined expansion. Management indicated the focus is on remodels, digital upgrades, and fulfillment enhancements to lift unit productivity.

2.2 E-comm still in high-growth mode
North America e-comm rose 26% YoY, contributing ~530bps to comps. With U.S. comps at 4.1%, ex-e-comm, physical comps would be negative, reaffirming that the U.S. growth engine has fully shifted to digital.
Within 1P, orders fulfilled within three hours now account for 36% of store-fulfilled orders. This directly validates rising demand for convenience and immediacy in shopping.
Marketplace grew ~50%, a 10-quarter high, indicating the supply side of the ecosystem is improving rapidly. Greater SKU breadth boosts onsite traffic value and ad pricing power.

Ads: as the pivotal lever in Walmart’s shift from low-margin retail to a higher-margin platform, Walmart Connect grew 44% YoY with faster QoQ momentum. Beyond search/display, Walmart began piloting Sponsored Prompt within its in-house AI shopping assistant Sparky, embedding paid product recommendations in natural language answers.
This is an incremental ad surface independent of existing search inventory, avoiding cannibalization. While still early with limited near-term revenue, we believe Sparky’s high-intent conversational context can become a new growth driver for Walmart Connect over time.
Membership: Walmart+ membership fee revenue rose double digits, with net adds hitting a record high in Q1. Benefits like free delivery, fuel discounts, and convenience tie users to Walmart, driving higher frequency and stability and improving ad and recommendation efficiency.

III. Sam’s Club: a ‘more-for-less’ volume story
Sam’s Club U.S. net sales were $23.4bn, up 6.1% YoY and accelerating QoQ. Ex-fuel comps rose 3.9%, with transactions +6.2% and average ticket -2.2%.

Transactions +6.2%, up from +4.8% last quarter, driven by two factors. First, a fuel-station traffic halo as oil spiked post Iran-related tensions: Placer.ai shows Sam’s fuel stations saw weekly traffic up +10–13% YoY in Mar and over +16% in mid-Apr, lifting overall club traffic.
Second, express e-comm fulfillment kept surging. On Apr 22, Sam’s launched an enhanced 1-hour Express Delivery (from 3 hours), covering 600+ clubs, with ~65k early orders averaging ~55 minutes and some in just minutes. Members who frequently use rapid delivery spend ~2x more annually than average members.
Price/ticket: the ticket decline reflects faster growth in low-ticket, high-frequency grocery vs. high-ticket general merchandise and substitution toward Member’s Mark private label. This creates structural pressure on average ticket.
But a lower ticket is not bad — it means members buy more for less, reinforcing value perception and supporting renewals and member growth. This strengthens the long-term unit economics.

E-comm rose 23%, with reserved delivery up over 90% and contributing about half of e-comm growth. This shows Sam’s is moving into more frequent, more immediate demand scenarios.
No new clubs opened in Q1. With recent fee hikes to $60 for base and $120 for Plus, we believe the focus is on protecting renewal rates through the price change.

IV. Walmart International: China Sam’s still shines brightest
Walmart International net sales were $35.1bn, up 18.0% YoY (+10.1% at cc) and accelerating QoQ. Importantly, e-comm rose 27% and membership revenue rose 31%, suggesting the U.S. formula of e-comm + ads + membership is being replicated internationally.

Walmex (Mexico & C. America): 3P became a drag. Walmex revenue was $12.2bn, up 4.1% YoY.
Walmex pre-released Q1: comps +3.1% split into +4.0% ticket and -0.9% traffic. We think high inflation reduced non-essential trips among lower-income shoppers, and the rapid rise of hard discounters siphoned off highly price-sensitive long-tail customers, though Walmart’s traffic decline was milder than the industry (-2% to -3%).
In e-comm, 1P GMV stayed strong at ~20% growth on instant delivery, but 3P Marketplace GMV collapsed from +15% in Q4 to -14%. Management cited delistings of some large 3C sellers due to compliance/credential issues as the core driver.
Beyond the short-term factor, Walmex 3P relies heavily on a few mega sellers (notably large electronics distributors), with thin long-tail SKU breadth and slower merchant onboarding. This has led to share loss in all-category retail traffic and mindshare, making 3P ecosystem build-out a key focus.
Ads did well, with Walmart Connect revenue accelerating to +33% (vs. +5% last quarter) on World Cup advertising brought forward. This is a positive signal for retail media scaling.

China: Sam’s remains the primary growth engine
China revenue rose 22.3% YoY at cc to $8.0bn, with e-comm +31% and digital sales penetration at 50% (+335bps YoY). These are standout metrics within Walmart and across global retail.
Sam’s drove the bulk of growth: transactions stayed in double digits, CNY was very strong, and nine new clubs opened in the last 12 months. This confirms a threefold resonance of store additions, strong comps, and deepening digital penetration in China Sam’s.
At 50% digital mix, China Sam’s has embedded dark stores, on-demand delivery, app ordering, and membership deeply into the model. That boosts club catchment radius, purchase frequency, and inventory efficiency vs. pure offline warehouses.

Canada revenue rose 7.4% YoY at cc to $5.5bn, with e-comm +38% (vs. +31% in Q4). All categories grew, indicating a phase of rapid e-comm penetration gains.

V. Gross margin: best in U.S., stable Intl., near-term pressure at Sam’s
Consolidated GPM expanded 20bps YoY to 25.1%. Despite higher input costs and largely stable shelf prices, the GPM uptick indicates a rising mix of high-margin ads.
By segment, Walmart U.S. GPM rose 29bps YoY, Intl. was flat, and Sam’s fell 26bps. The higher the mix of ads, membership, and digital monetization, the greater the margin improvement.


VI. Higher fuel costs constrained profit release
Opex rose as higher fuel drove up fulfillment costs, lifting SG&A by 30bps YoY to 20.9%. By region, Intl. saw the biggest OP margin pressure due to strategic upfront omnichannel investments in Canada and Mexico and longer logistics chains, making it more exposed to fuel spikes.
Operating income was $7.5bn (+5% YoY), slower than revenue growth. This mismatch explains the market’s focus on cost headwinds this quarter.


<End>
Dolphin Research past coverage on 'Walmart':
Deep Dive
Apr 21, 2026: 'Walmart: What makes the trillion-dollar retail juggernaut tick?'
Risk disclosure and disclaimer: Dolphin Research disclaimer and general disclosure
The copyright of this article belongs to the original author/organization.
The views expressed herein are solely those of the author and do not reflect the stance of the platform. The content is intended for investment reference purposes only and shall not be considered as investment advice. Please contact us if you have any questions or suggestions regarding the content services provided by the platform.
