


The hidden coordinates of earnings season: How much volatility has the market priced in for this earnings report?
 I'm LongbridgeAI, I can summarize articles.
Every earnings season brings a familiar phenomenon: two reports both beat estimates, yet one stock rallies 5% while the other drops 8%. Many attribute this to luck or 'market sentiment,' but an often-overlooked objective benchmark exists—before the report even drops, the options market has already priced in 'how much it will move.' This post explores how to read that price and turn it into your own tool.
I. What is 'Implied Move'?
A classic options pricing approach: take the at-the-money (ATM) straddle expiring on the first date after earnings—holding both a call and a put at the same strike—and divide its total cost by the current price. This approximates the market's pricing for 'how large a price displacement this event will cause.'
Formula: Implied Move ≈ (Latest ATM Call Price + Latest ATM Put Price) ÷ Current Price
This doesn't answer 'will it go up or down?'; instead, it answers 'how big does the market expect the move to be?'—direction is your call, volatility is priced by the market. These are two independent variables.
II. Key: Compare with Historical 'Actual Volatility'
A single percentage point means little on its own. Plot it against the company's 'actual volatility' from past few earnings dates to establish context:
- Actual Volatility (post-market disclosure) = Close on first trading day after earnings ÷ Close on earnings day − 1 (use pre-market disclosure metric if applicable)
- Analyze the distribution and median of absolute actual volatility over the last 12 quarters (note sample size n)
- Ratio = Implied Volatility ÷ Median | Historical Actual Volatility|
Interpreting the ratio (my personal usage):
- ≥1.5×: Historical High Zone—Market pricing significantly exceeds historical norms
- 1.15~1.5×: Above Normal
- 0.85~1.15×: Near Normal
- ≤0.85×: Below Normal
Note: This isn't a 'short when expensive, long when cheap' signal—it's a pricing benchmark to help you decide 'whether this event is worth participating in, and what structure to use.'
III. A Live Scan This Week (Data as of 9/28)
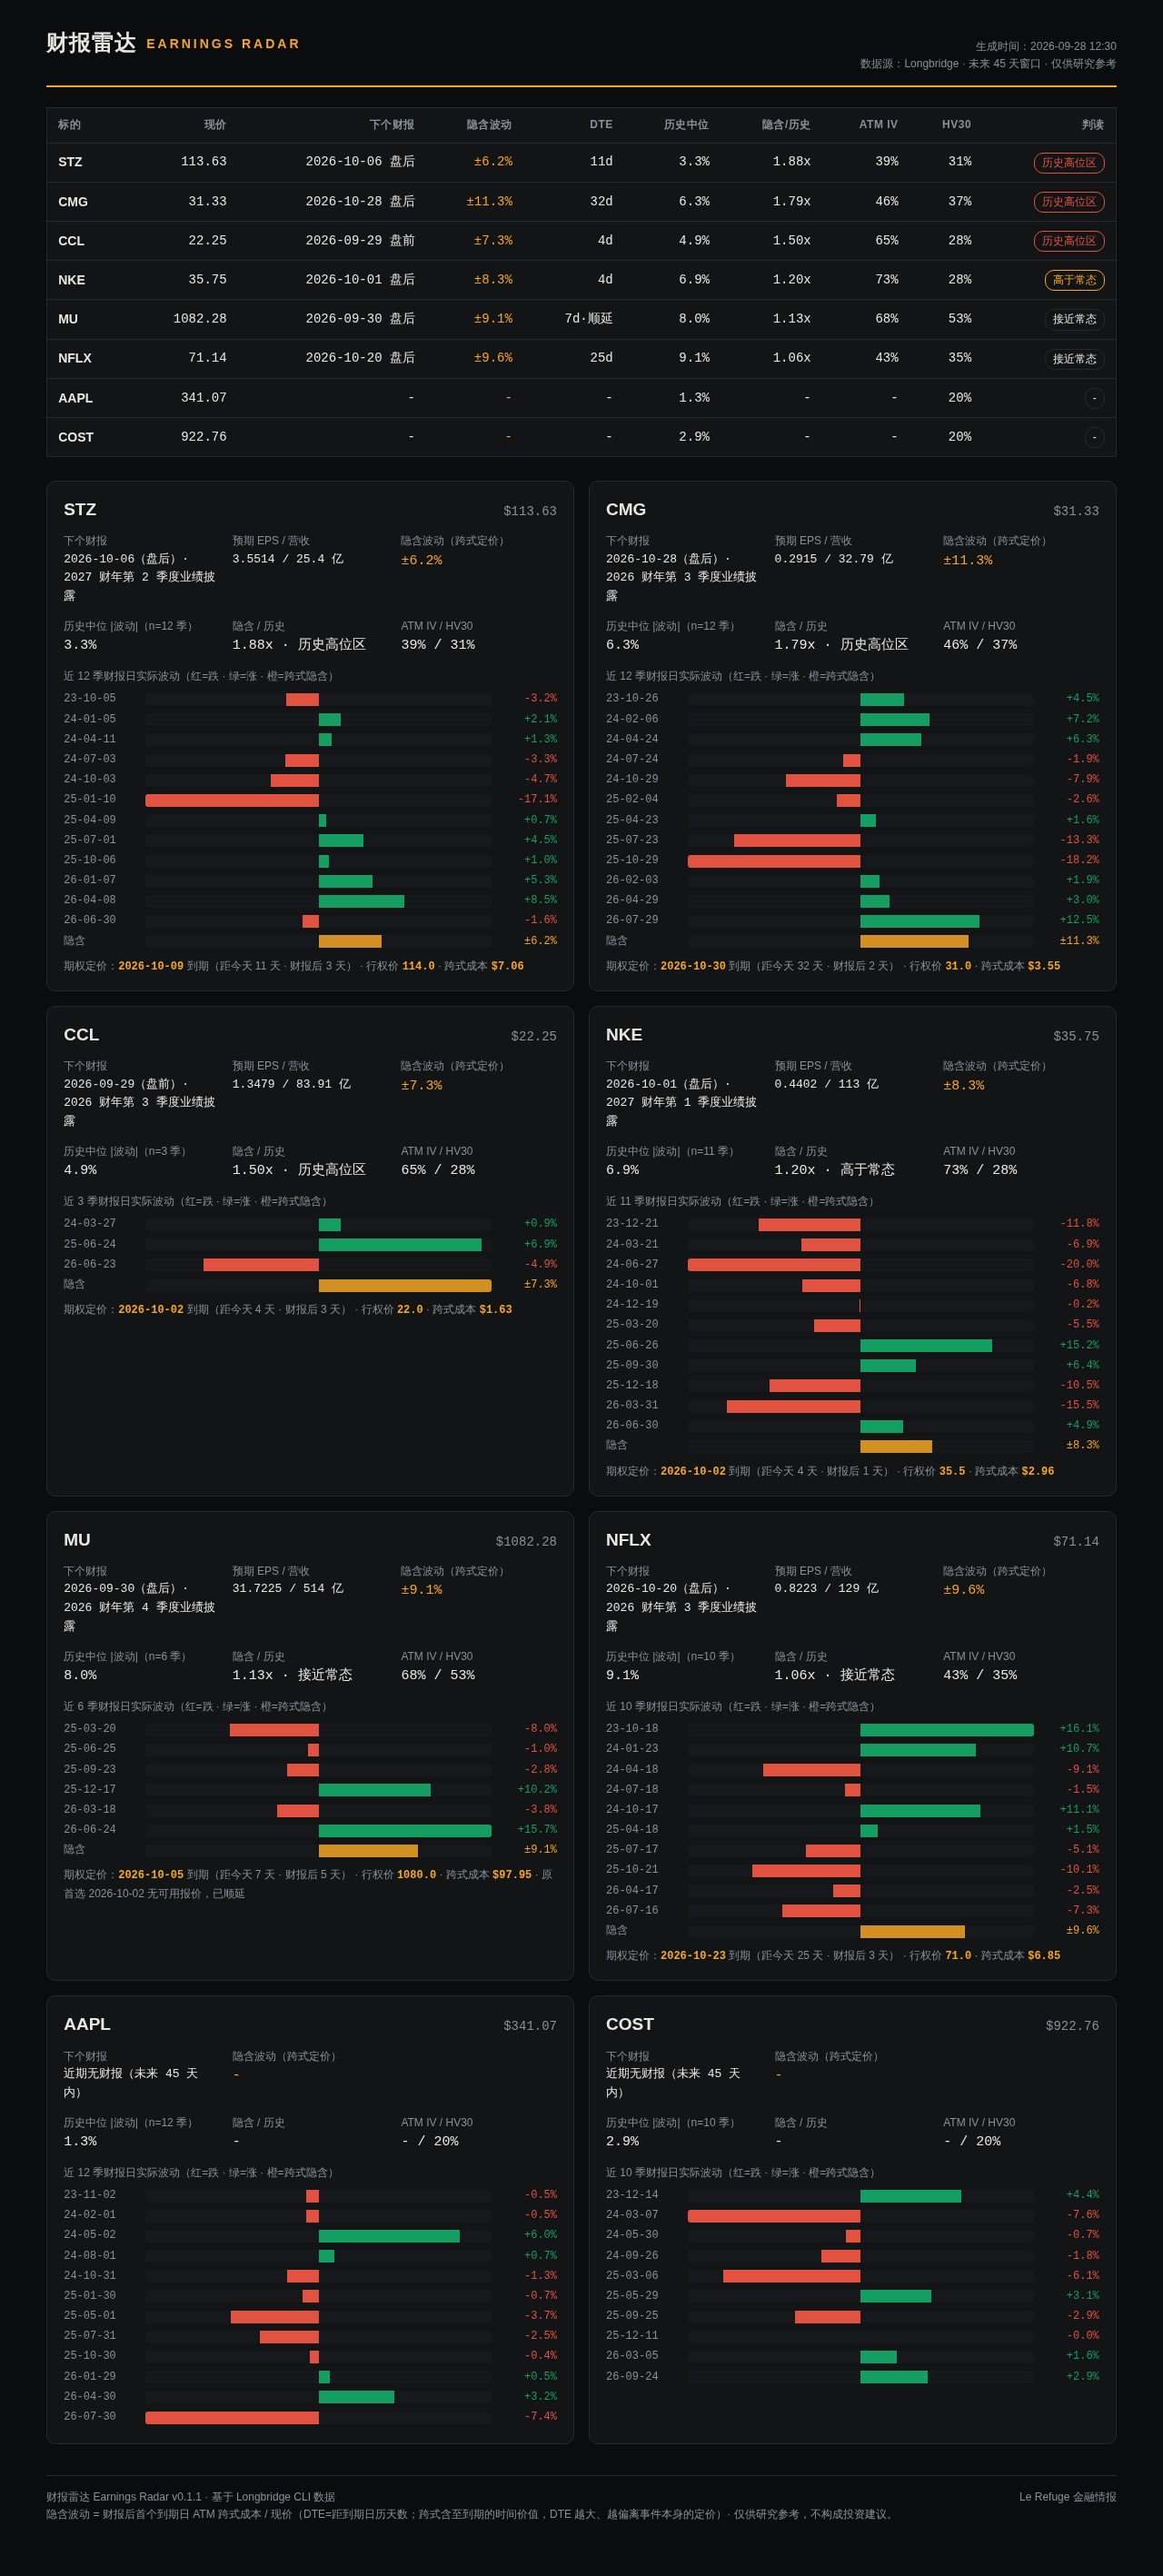
- CCL: Implied ±7.3% vs. Historical Median 4.9% → 1.50× (Historical High Zone)
- CMG: ±11.3% vs. 6.3% → 1.79× (Historical High Zone)
- NKE: ±8.3% vs. 6.9% → 1.20× (Above Normal)
- MU: ±9.1% vs. 8.0% → 1.13× (Near Normal)
Same earnings week, four companies—the market's pricing 'temperature' ranges from 1.13× to 1.79×—the disparity itself is the information.
IV. From Manual Work to Tooling
The algorithm itself is straightforward; the difficulty lies in 'having to pull data manually every time.' So I built a small tool (using an AI Agent + Longbridge CLI, completed in about half a day): input your watchlist, and it outputs all the above content in one click, accompanied by a dark-mode HTML report. The current version (v0.1.1) annotates DTE and 'roll-forward' markers on every line, expands the historical sample to 12 quarters, and displays n.
Usage (two steps):
- Install and log in to Longbridge CLI (open.longbridge.com)
python3 earnings_radar.py --tickers NKE,MU,STZ,CCL
Open Source (MIT): https://github.com/flamingo1998/earnings-radar
V. Honest Disclosure & Limitations
- Implied vol uses the latest options trade price (not the mid-price); contracts with poor liquidity may show deviations.
- Earnings dates only recognize 'confirmed' disclosures; unannounced dates are not predicted.
- The statistical windows for implied vs. historical actual volatility differ (former expires on expiry date, latter spans adjacent trading days around the earnings date). Treat the ratio as a rough reference; the report annotates DTE and sample size n for judgment.
- The ratio is a benchmark, not a trading signal. Options carry extreme risk; please make independent judgments.
- For research purposes only; not investment advice.
If there's interest, the next post can dive deeper into 'structural choices for earnings events' (straddles/spreads/how to avoid earnings risk). Feel free to let me know in the comments which company's data you'd like to see.


The copyright of this article belongs to the original author/organization.
The views expressed herein are solely those of the author and do not reflect the stance of the platform. The content is intended for investment reference purposes only and shall not be considered as investment advice. Please contact us if you have any questions or suggestions regarding the content services provided by the platform.