Im done with sharing CC highlights. Apologies to anyone if you couldn't handle it...trying to incorporate the sharing of highlights from big tech earnings because I don't think a lot of people bother to listen toconference calls.


Equity research
Equity researchSuggestions for you to follow
E
$Meta Platforms(META.US) Zuckerberg: "On instagram and Facebook, I'm very optimistic about our work to integrate large language models into our recommendation systems. LLMs add a first principles understanding of what the content is about and why it is compelling, as well as a deeper understanding of what people are interested in and what their goals are when they're using our apps."

E
Meta EPS miss is an overreaction.
"The second quarter 2026 general and administrative expenses include $2.40 billion of charges related to legal proceedings."Without this, they would've likely beat EPS.$Meta Platforms(META.US)E
$Meta Platforms(META.US)
Revenue: $60.8B vs $60.24B expected EPS: $6.18 vs $7.14 expected Full-year capex: $130B to $145B vs $125B to $145B previouslyE
SK Hynix $SK Hynix(SKHY.US) on HBM price negotiations for 2027:
"Discussion is underway for 2027 HBM supply volume and pricing with our key customers, which is progressing smoothly, supported by solid customer demand. But of course, we cannot disclose the contractual terms or pricing details for individual customers. With conventional DRAM prices rising sharply in recent months, such market environment may also have some influence on our HBM pricing discussions. Having said that, of course, HBM pricing is not determined solely by conventional DRAM prices."E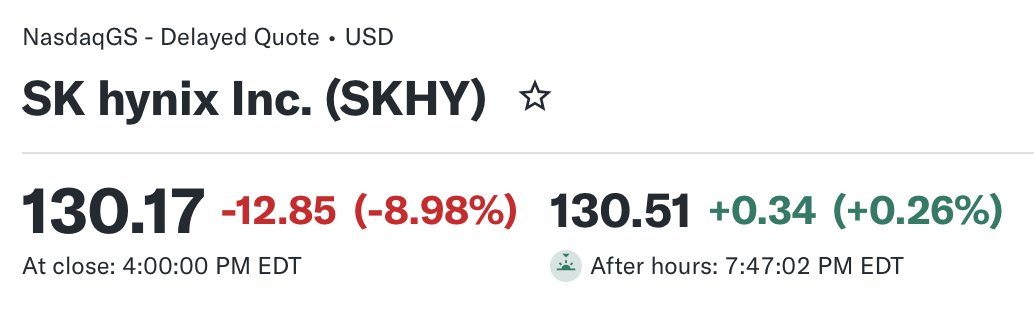
SK Hynix $SK Hynix(SKHY.US) has turned green, maybe Korea got saved?
E
BofA: Intel
Investment Rating & Price Objective> Rating & Price Objective: Maintain BUY with a Price Objective (PO) of $160.00 USD (against a stock price of $91.67 USD). > Valuation Basis: Based on 31x CY30E EPS power of $6+, discounted back two years to account for long-term server CPU and external foundry wafer/packaging opportunities. Server & Market Positioning> Supply-Driven Share: Server market share through 2026–2028 is viewed as a function of supply rather than design. Coral Rapids (slated for 18A-P in 2027) will further help close the performance gap against competitors. > ASP Strength: Q2 server Average Selling Price (ASP) jumped +48% YoY, driven by higher core-count Granite Rapids adoption. > Competitive Edge in AI: Intel argues that agentic AI workloads vary in requirements and may not always favor ARM or AMD. Intel’s NVLink design-in establishes a level playing field for system-level integration, while x86's security lead provides an advantage in enterprise AI. > PC TAM: The PC Total Addressable Market (TAM) is tracking for a 10–12% YoY decline in 2026, though Intel sees limited inventory risk due to clear sell-in vs. sell-through visibility. Intel Foundry Progress> Yields & Margins: Under CEO Lip-Bu Tan, 18A/4/3 nodes are showing upside on yield, cycle times, and unit costs. 18A yields are expected to approach industry standards by the end of 2026, with a path to operating margin (OpM) breakeven by 2027 (excluding external customers). > External Nodes (18A-P & 14A): 18A remains internal-only, while 18A-P targets external customers (risk production underway, 2027 volume committed). 14A High Volume Manufacturing (HVM) has been committed for 2028, featuring external customer engagements from the outset. > Long-Term Financial Goals: Long-term gross margin targets are set at mid-40%+ to 50%+. Multiple financial levers—including prepayments, non-core asset sales, and equity—are available to support rising capital expenditure intensity. Advanced Packaging (EMIB)> Backlog & Ramps: The EMIB-T (Through-Silicon Via variant) backlog is actively building for a 2027 ramp-begin and full 2028 ramp. > Revenue Potential: Each packaging engagement is projected to be worth multiple billions of dollars per year. > Capacity & Constraints: Assembly and packaging (A/P) capital intensity is lower than wafers (roughly 1 to 5), and Intel already has capacity to handle multiple engagements in 2027. Current supply constraints are centered on external substrates, which are being managed via supplier prepayments.$Intel(INTC.US)
E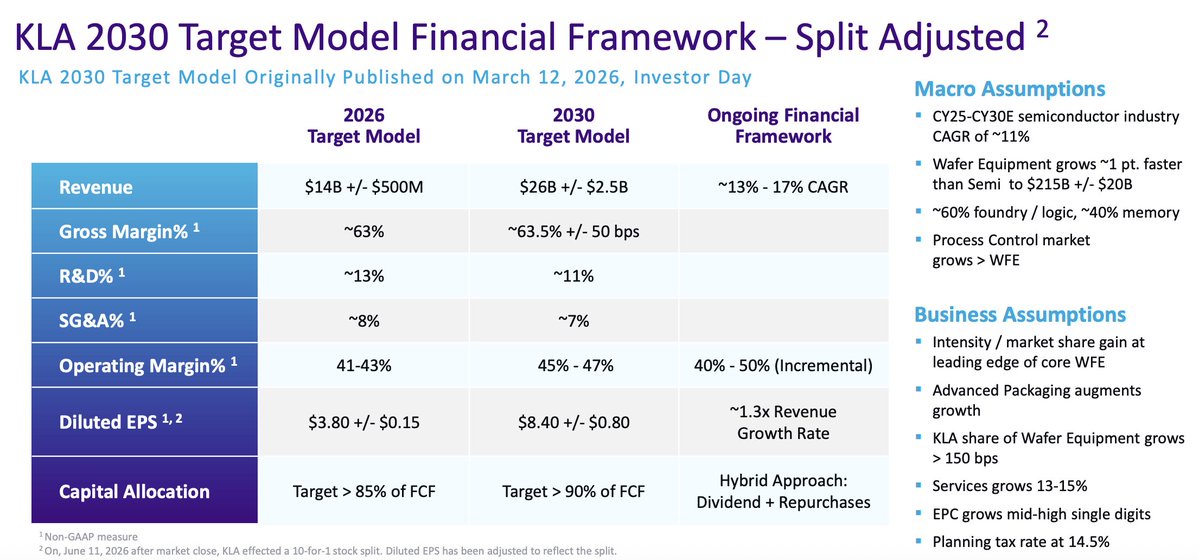
KLA with macro assumptions on the semiconductor industry:
> CY25-CY30E semiconductor industry CAGR of ~11% > Wafer Equipment grows ~1 pt. faster than Semi to $215B +/- $20B > ~60% foundry / logic, ~40% memory > Process Control market grows > WFE$KLA $Applied Materials(AMAT.US) $Lam Research(LRCX.US)
E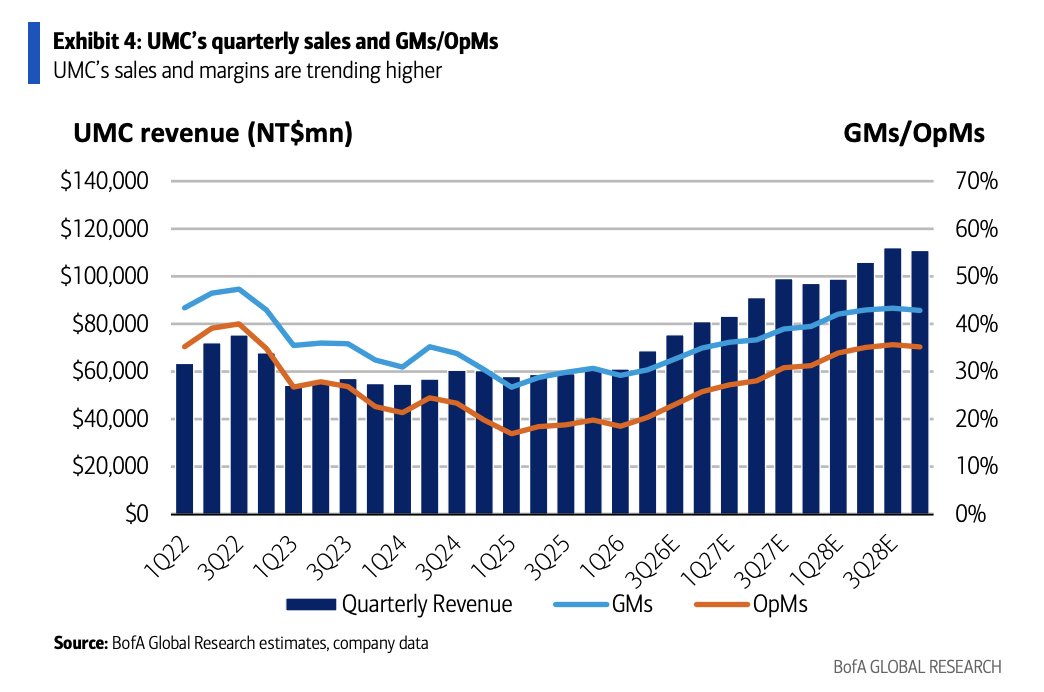
BofA: United Microelectronics
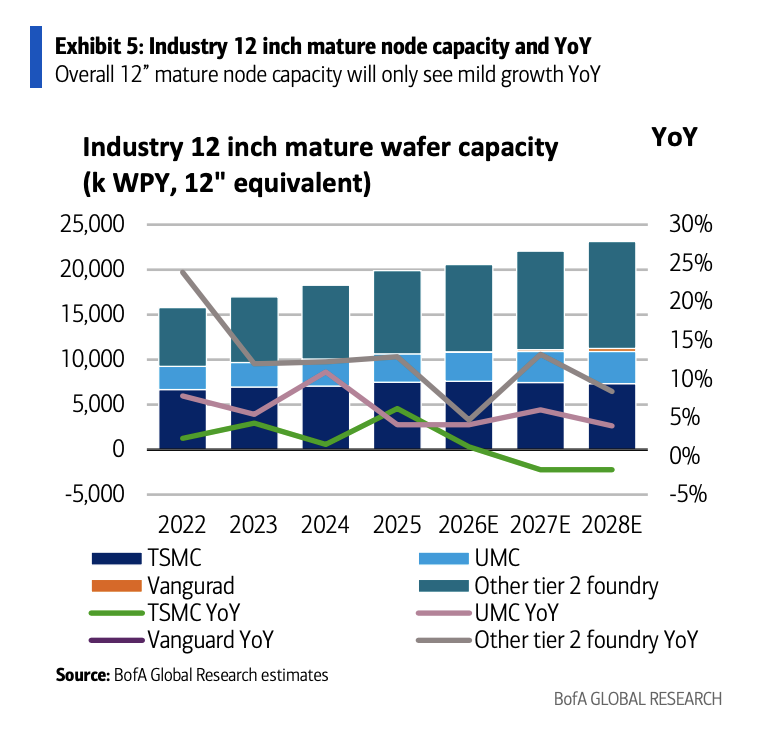
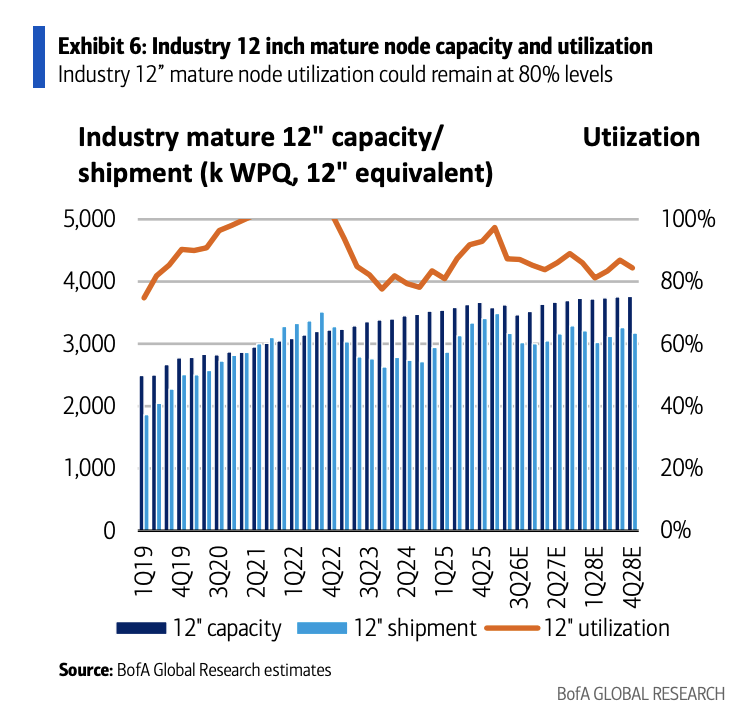
Rating & Price Objective Changes> Price Objective (PO): Raised from NT$63 to NT$120 (and ADR PO raised from US$9.96 to US$18.97), based on a 17x target 2027E P/E multiple (up from 15x, sitting in the upper half of its historical 2x–25x range). Earnings & Financial Forecasts> EPS Estimates: Adjusted to NT$5.11 for 2026E, NT$7.09 for 2027E, and NT$9.60 for 2028E, driven by improving capacity utilization and wafer pricing. > Revenue & Margins: Gross margins are projected to lift to 31.9% in 2026 and 36.9% in 2027 (based on 85% and 90% utilization rates, respectively), though analysts note these sit below overly aggressive market expectations of 40–45% GMs at full capacity. Core Investment Thesis & Skepticism> Overhyped Thematic Optimism: While UMC's foundational mature-node business is recovering, BofA believes market expectations are overly inflated regarding:1. Silicon Photonics: Projected to represent only a small fraction (3% in '27 and 6% in '28) of UMC's total sales. Specialty Memory Production: Viewed merely as a cyclical fab filler. 2. Intel Collaboration (12nm): Limited customer traction is anticipated. 3. Traditional Tech Exposure: Over 80% of UMC's sales remain tied to traditional tech products, presenting downside risks if inventory builds moderate and customer pushback on pricing intensifies. Industry & Mature Node Fundamentals> Supply & Demand Dynamics: Mature 12-inch industry utilization (ex-China) is projected to improve from the low-80% range in 2026 to 85–90% in 2027. 8-inch node fundamentals look even more encouraging, moving from high-80% utilization in 2026 to 90–95% in 2027. > Capacity Adjustments: Capacity output is influenced by decoupling trends, TSMC retiring older 6", 8", and mature 12" equipment (-130k WPM through 2025–2027), and Samsung cutting back 8" and selective mature 12" operations. Recent Performance & Near-Term Outlook> 2Q26 Tracking Stronger: Sales grew 13% QoQ, aligning with resilient consumer demand reported by major fabless players. > Caution Ahead: While 3Q26 could see resilient early builds (+10%) as customers try to get ahead of cost hikes, analysts advise caution regarding year-end inventory adjustments and pricing pushback.$United Microelectronics(UMC.US)E
Amazing commentary from Celestica $Celestica(CLS.US):
"Driven by very strong customer demand, and supported by new program wins, we expect revenue growth in 2027 to accelerate beyond the 65% growth rate we are anticipating in 2026." Bonkers! Will listen to the conference call and give more info but amazing growth numbers.E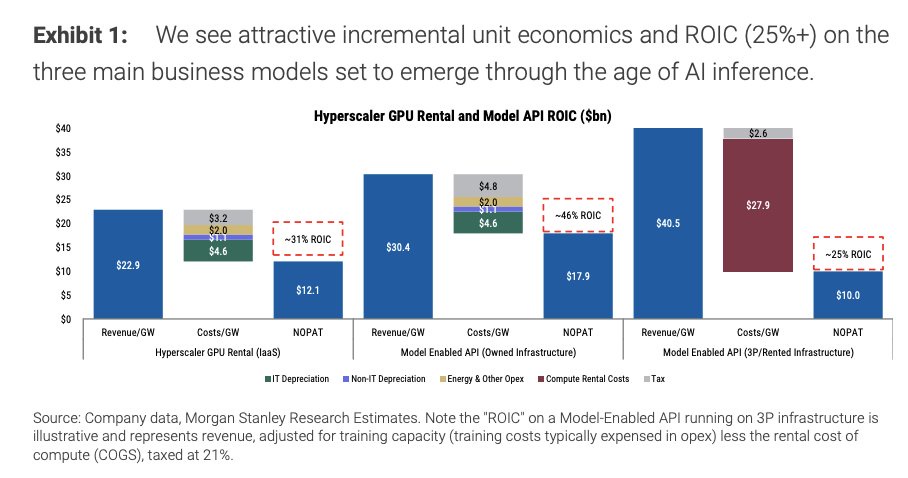
 +1
+1
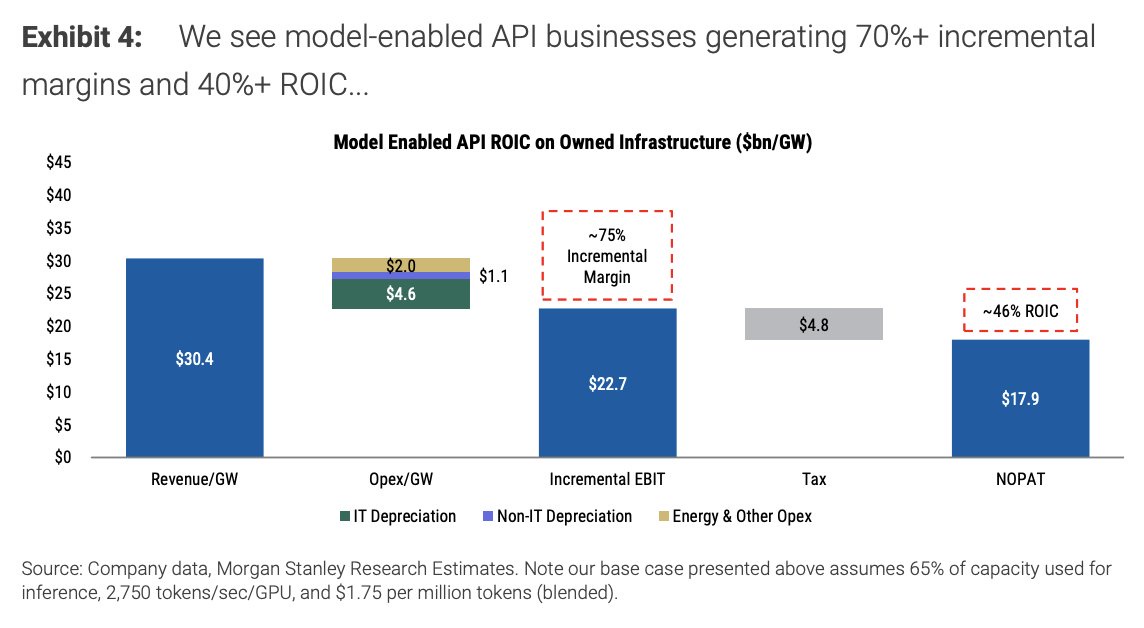
Morgan Stanley: The Paths to 25-50% GenAI ROIC
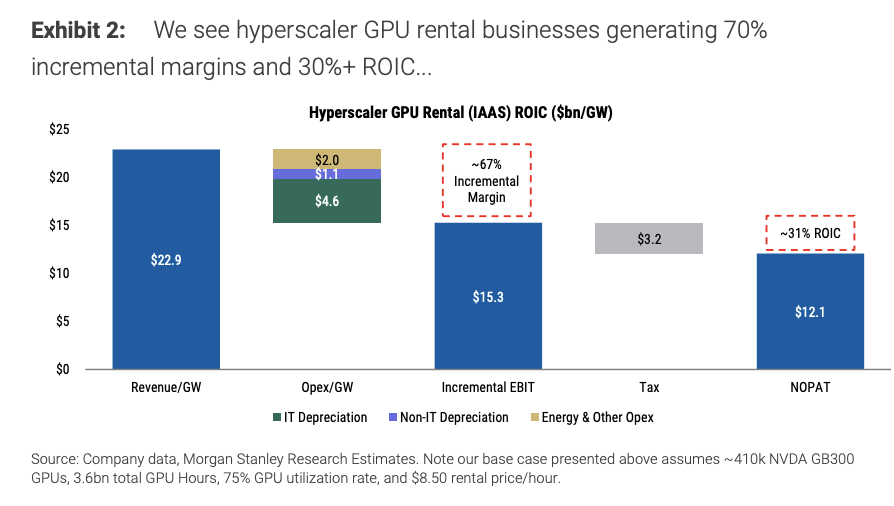
GenAI ROIC Frameworks & Unit EconomicsDespite surging AI capital expenditures and model training spend, Morgan Stanley is bullish on long-term ROIC, introducing three bottom-up frameworks that point to attractive 25% to 50% ROIC: > Hyperscaler GPU Rental (IaaS): Estimated to generate ~60–70% incremental EBIT margins and 30%+ ROIC. The base-case analysis assumes deployment on NVIDIA GB300 chips with a 75% utilization rate and a rental price of $8.50/hour. > Model-Enabled API (Owned Infrastructure): Estimated to deliver ~70%+ incremental EBIT margins and 40%+ ROIC. Key success drivers include token pricing, token throughput (tokens/second/GPU), and managing the trade-off of dedicating compute capacity toward training versus revenue-generating inference. > Model-Enabled API (Third-Party Infrastructure):Estimated to yield ~30% incremental EBIT margins and ~25% ROIC, accounting for the "middle-man margin" paid for renting third-party compute capacity.Key Structural Trends in GenAI Adoption> Cost Efficiency vs. Revenue Growth: Morgan Stanley’s global AI stock mapping indicates that roughly 80% of near-term AI benefits stem from cost efficiency rather than immediate top-line revenue growth. AI Adopter EBIT margins expanded significantly, doubling the pace of the broader MSCI World index.> Diverging Earnings Revisions: Since late 2023, forward earnings expectations for global companies successfully adopting AI ("AI Adopters") have outpaced disrupted counterparts by roughly 2x, as concrete productivity gains and margin expansions materialize on balance sheets.> The "Enabler" Divergence: In contrast to general corporate adopters, AI Enablers (such as infrastructure providers and data center chip makers) see a heavy tilt toward revenue growth, with roughly 71% deriving major benefits from top-line expansion driven by high-demand hardware and cloud compute sales.$NVIDIA(NVDA.US) $AMD(AMD.US) $Alphabet(GOOGL.US) $Broadcom(AVGO.US) $Amazon(AMZN.US) $Meta Platforms(META.US) $Microsoft(MSFT.US)+1
E
Speedrun | Upcoming Events This Week - [July 27 - July 31, 2026]
Stay informed on events/news for the coming week.Market Overview & Sentiment> AI Trade Correction: High-beta AI names have faced a sell-off since early June, and the Philadelphia Semiconductor Index has experienced downward pressure. > Seasonal Headwinds: Moving into August, historical data from BofA notes that the August–to–October period tends to be the S&P 500's worst 3-month stretch (averaging -0.02%), making this week's earnings and economic data critical for the market's near-term direction. Geopolitics (Iran Conflict Update)> De-escalation: The U.S. temporarily halted planned escalations against Iran due to concerns over depleting the Pentagon's Middle East stockpile of Patriot interceptors and air defense munitions. > Ceasefire Stance: Iran responded by stating it will halt its attacks for as long as the U.S. does. > Political Pressure: With the midterm elections only two months away, the administration faces high incentives to secure a lasting deal to prevent prolonged energy market volatility. Earnings Calendar Highlights> Heavyweight Releases: This is the most important earnings week of the quarter, featuring reports from major hyperscalers, Apple, Amazon, Microsoft, and Meta, alongside bellwethers like Mastercard, Visa, Coca-Cola, UPS, Qualcomm, and Arm. > Hyperscaler CapEx Focus: Following Google's recent quarter—which featured a beat on earnings but triggered its first quarter of negative Free Cash Flow (FCF) due to surging CapEx—investors will be closely watching whether competitors follow suit in aggressive AI spending. > Apple & Pricing Power: Apple reports following recent consumer device price hikes driven by higher memory costs; markets will look for signs of potential demand destruction. Economic Calendar Highlights> Fed Interest Rate Decision (Wednesday): The Federal Reserve is widely expected to hold interest rates steady at 3.75%. Attention will center on the post-decision press conference regarding inflation trends and policy outlook. > GDP & Inflation (Thursday):Core PCE: The MoM change is anticipated at 0.1% (down from 0.3% last month). GDP Growth Rate (Advanced): Estimated to come in at 2.3%, slightly ticking up from the previous 2.1%.Link in replies 👇E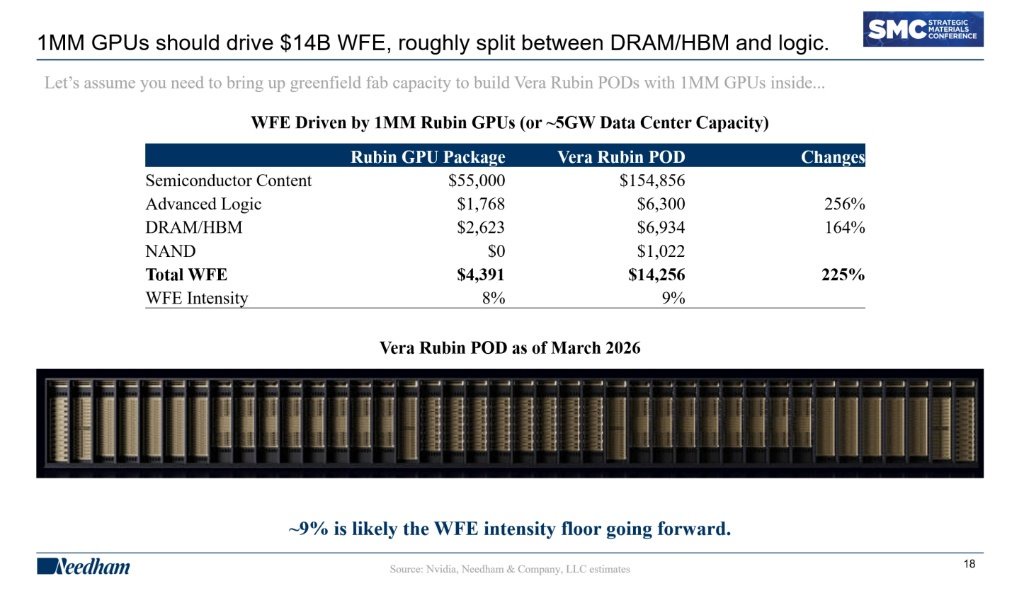
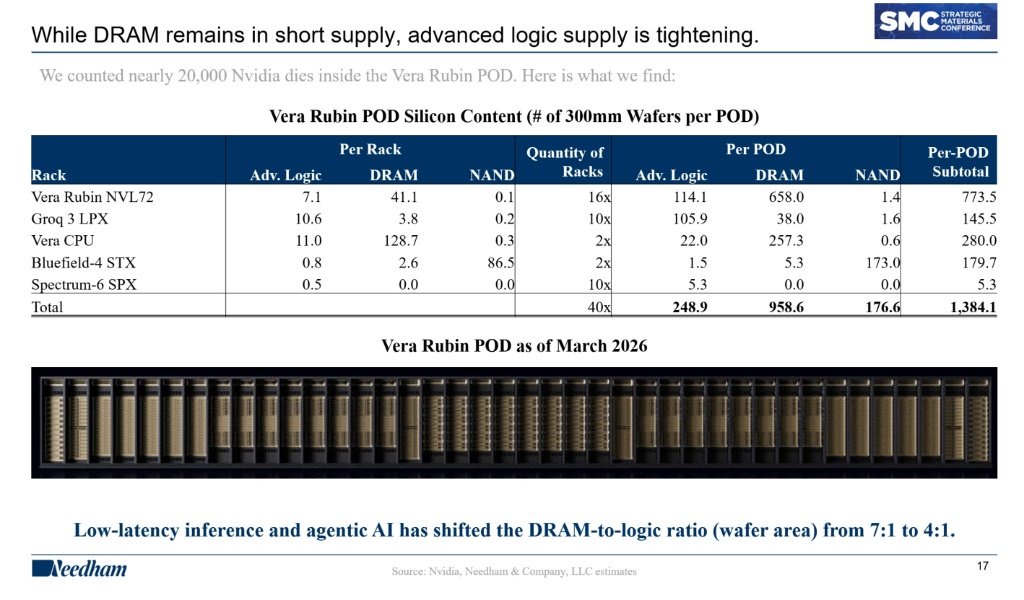
Needham: WFE & Memory
WFE Requirements for Vera Rubin PODs> 1 Million GPUs Impact: Building out greenfield fab capacity to support 1 million Rubin GPUs (roughly 5 GW of data center capacity) drives $14 billion in WFE, split roughly evenly between DRAM/HBM and logic.> WFE Intensity Floor: The total WFE intensity for a Vera Rubin POD sits around 9%, which is expected to act as the intensity floor moving forward.> Growth in Spend: Compared to an individual Rubin GPU package, a full Vera Rubin POD sees a 225% total WFE increase, driven heavily by surges in advanced logic (up 256%) and DRAM/HBM (up 164%).Silicon Content & Ratio Shifts> Total Die Count: Nearly 20,000 Nvidia dies are packed into a single Vera Rubin POD.> Wafer Area Shift: The rise of low-latency inference and agentic AI has shifted the DRAM-to-logic ratio (wafer area) from 7:1 down to 4:1.> Supply Dynamics: While traditional DRAM remains in short supply, the market is seeing advanced logic supply tighten correspondingly.> POD Subtotals: Across its 40 total racks (spanning NVL72, Groq 3 LPX, Vera CPU, Bluefield-4 STX, and Spectrum-6 SPX), a single Rubin POD requires roughly 1,384 total 300mm wafers, dominated heavily by DRAM (958.6 wafers) and advanced logic (248.9 wafers).$NVIDIA(NVDA.US) $Micron Tech(MU.US) $DRAM $EWYE
BOCOM International: Zhongji Innolight
AI Infrastructure & Market Forecasts> Role of Communication Networks: Zhongji Innolight is positioned to benefit as a leading global manufacturer of optical modules due to the rising importance of communication networks in AI infrastructure.> Chip Market Forecast: The global AI communication network chip market size is forecasted at USD 107.5bn (2026E) and USD 154.9bn (2027E), driven by upstream giants NVIDIA and Broadcom.Optical Modules in AI Data Centers> GPU-to-Transceiver Ratio: Based on NVIDIA Blackwell Ultra NVL72 systems, 1 GPU corresponds to ~6.1 transceiver modules.> Shipment Estimates: High-bandwidth (>=400G) optical module shipments in data centers are expected to reach 81.1m units (2026E) and 146.7m units (2027E).1.6T Optical Modules: Expected to reach 28.4m units (2026E) and 76.3m units (2027E), serving as the primary driver for Zhongji Innolight's earnings growth.Technology Position & Market Share> Technology Timeline: CPO may scale up in 2H27 or later, while NPO could begin volume ramp in 2026 as the primary interface technology form.> Global Ranking: According to Frost & Sullivan, Zhongji Innolight's data communication optical module market share was 23.1% in 2025, ranking first globally.$Applied Optoelectronics(AAOI.US) $NVIDIA(NVDA.US) $Broadcom(AVGO.US) $Marvell Tech(MRVL.US)E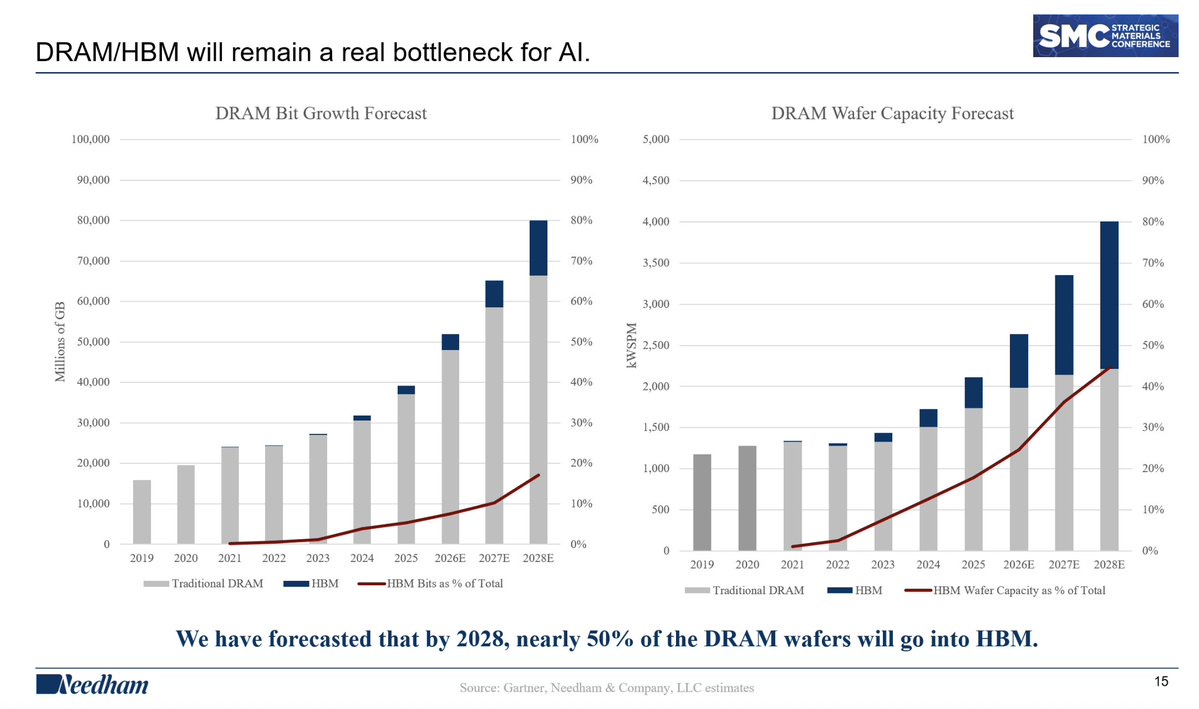
Needham: "DRAM/HBM will remain a real bottleneck for AI."
> DRAM/HBM Bottleneck: DRAM and High Bandwidth Memory (HBM) are projected to remain significant bottlenecks for AI hardware scaling.> Rapid Bit Growth: Total DRAM bit growth (millions of GB) is expected to expand dramatically through 2028, driven heavily by increasing HBM adoption.> Surging HBM Share: HBM bits as a percentage of total DRAM are forecasted to grow steeply, scaling past 15% by 2028.> Wafer Capacity Shift: DRAM wafer capacity dedicated to HBM (measured in kWSPM) is projected to accelerate sharply, with expectations that nearly 50% of total DRAM wafers will go into HBM by 2028.$Micron Tech(MU.US) $DRAM $EWY
E
UBS: Open-Source Models Momentum
AI Demand & Enterprise Adoption> Broadening Demand: AI demand remains exceptionally strong and is expanding rather than slowing down, despite heightened scrutiny around return on investment (ROI). > Transition to Production: Enterprises are shifting from early testing and proof-of-concepts into full production and large-scale deployment. > Incremental Categories of Spend: Companies like Perplexity, AlphaSense, ElevenLabs, Sierra, and Cursor reported exponential growth (e.g., Perplexity experiencing a 3x increase in ARR year-to-date) driven by new, non-cannibalistic categories of AI spending such as voice, digital coworkers, agents, and coding. Pricing Shifts & Cost Optimization> Consumption-Based Pricing: Vendors like Microsoft (with Copilot) are transitioning certain clients from traditional seat-based licensing to consumption-based pricing. > Focus on Token Costs: This shift has intensified enterprise focus on maximizing ROI per token, making model-harness optimization, smart routing, and workload-specific model selection crucial components. > Reallocation, Not Reduction: Demand is not shrinking; rather, it is being strategically reallocated toward the most cost-effective models and workloads. Open-Source Momentum & Implications for NVIDIA > Closing Performance Gap: Open-source models have significantly narrowed the performance gap against frontier solutions over the past year. > Explosive Token Utilization: Open-source adoption has surged from sub-1% last year to 1% at the start of 2026, multiplied several times over by mid-2026, and is projected to potentially represent the majority of tokens used over time. > Favorable for NVIDIA: This trend is viewed as highly positive for NVIDIA due to its software leadership (such as the Nemotron family) and the fact that most open-source models are trained and fine-tuned on NVIDIA hardware, resulting in superior inference performance. > Expanded Infrastructure Demand: While open-source adoption pressures frontier-only economics, it ultimately expands total inference demand by turning lower-cost models into viable solutions for a broader range of mature workflows. Fast-Inference Infrastructure> Optimal Use Cases: Cerebras (CBRS) enterprise customer feedback indicates that wafer-scale engine (WSE) technology is ideally suited for latency-sensitive search and one-shot retrieval workloads. > Long-Running Workloads: Long-running agentic workflows continue to prioritize model quality, tooling, and orchestration over raw inference speed. > Market Share: NVIDIA's view that fast inference accounts for roughly 10-20% of the overall inference market remains intact, though use cases are expected to expand as token costs decline and architectural advancements (like disaggregated solutions and stacked-memory SRAM architectures) improve. $NVIDIA(NVDA.US) $Cerebras(CBRS.US)E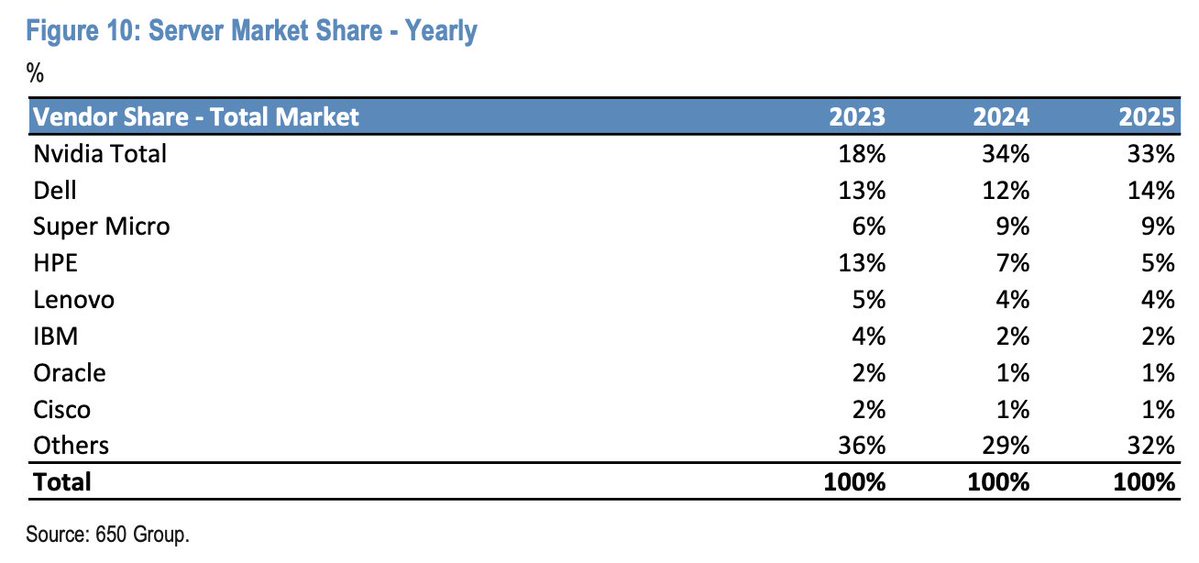
J.P. Morgan: AI Server Market
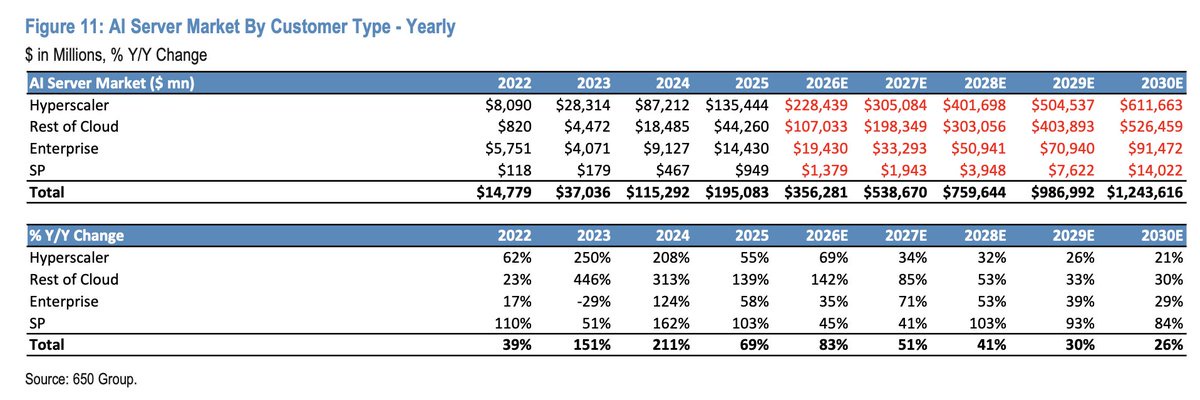
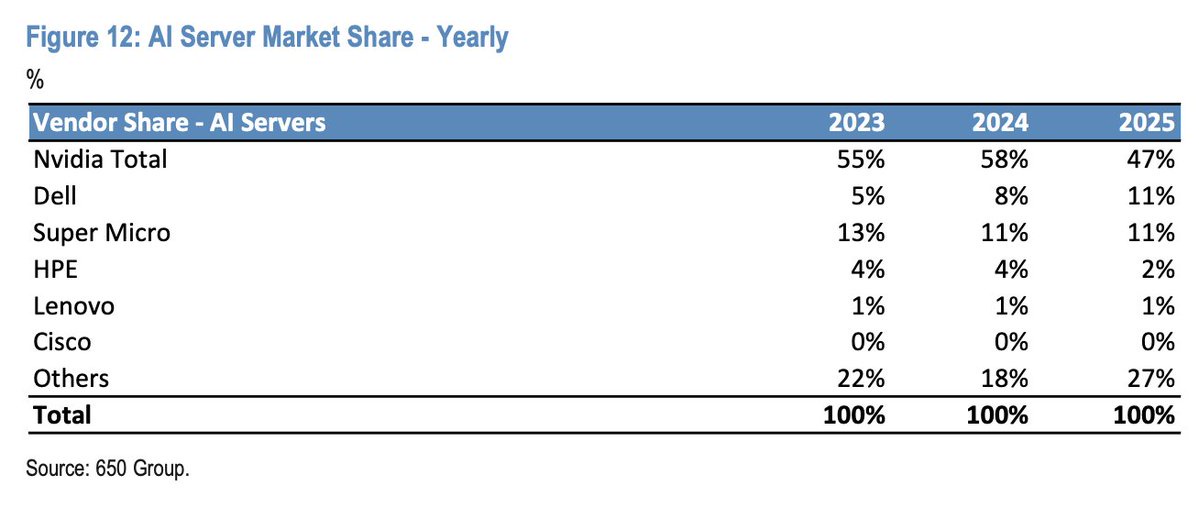
"The AI Server market is estimated to expand to $356bn in 2026 from $195 bn in 2025, implying +83% y/y growth, while the long-term CAGR from 2026 through 2030 is expected to track at +37%. With respect to customer types, Hyperscalers are expected to track to a CAGR of +28% from 2026 through 2030, while Enterprise and Rest of Cloud are expected to drive faster growth at +47% and +49% CAGRs, respectively, over the same period."AI Server Market Growth> Rapid Expansion: The total AI server market is projected to skyrocket from $14.7 billion in 2022 to $1.24 trillion by 2030.> Hyperscale Dominance: Hyperscalers are driving the vast majority of the demand, growing from $8.09 billion in 2022 to an estimated $611.6 billion in 2030.> Massive Peak Growth: The market saw its highest year-over-year percentage growth in 2024 at 211%, with steady, strong growth projected through the rest of the decade.Total Server Market Share > Nvidia's Surge: Nvidia's total market share expanded significantly from 18% in 2023 to 33% in 2025.> Competitor Stability: Major hardware vendors like Dell and Super Micro maintained or moderately increased their standing, with Dell holding 14% and Super Micro at 9% by 2025.AI Server Market Share by Vendor> Nvidia Leadership: Nvidia maintains dominance in dedicated AI servers, commanding 47% of the market in 2025 (down slightly from a peak of 58% in 2024 due to rising competition).> Gaining Competitors: Dell and Super Micro are prominent players in the AI server space, each holding an 11% market share as of 2025.E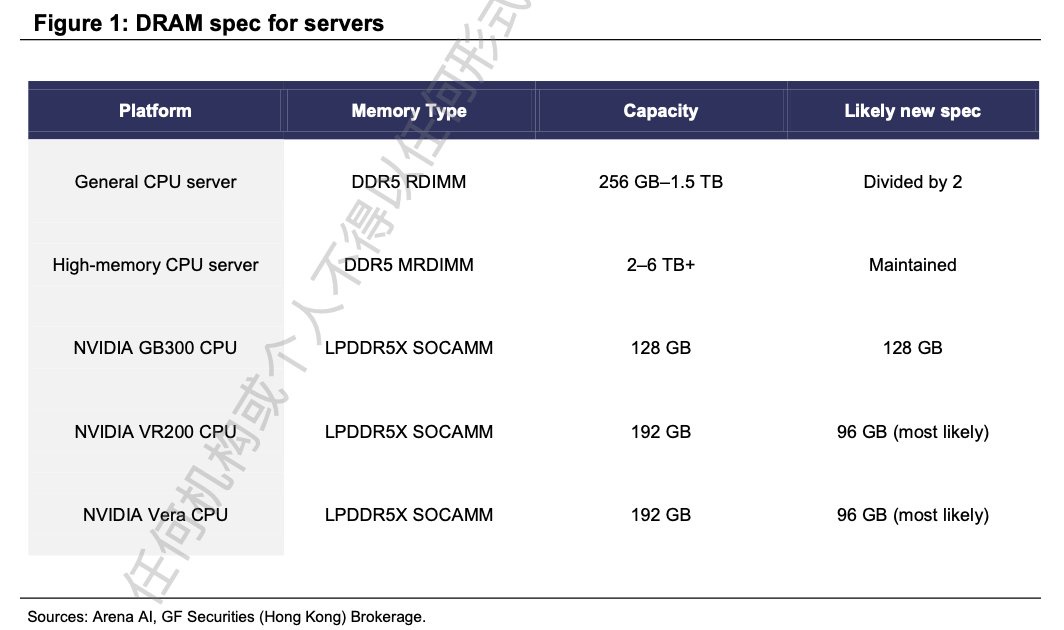
GF Securities: Taking Actions to Manage Memory Cost
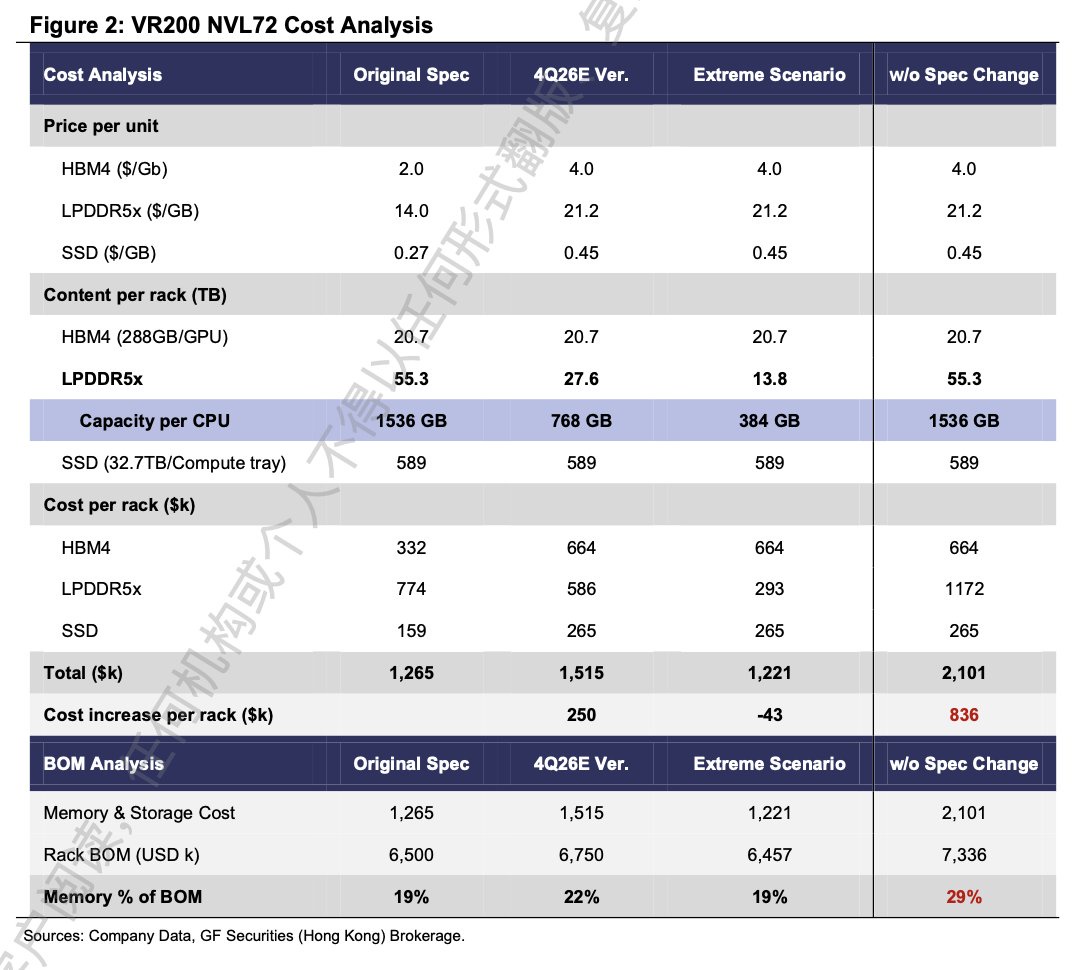
Management of AI Memory Costs & Spec Cuts> Nvidia VR200 NVL72 Adjustments: Nvidia is cutting the default SOCAMM configuration in VR200 NVL72 racks by half (shipping 96GB SOCAMM modules instead of 192GB) to address LPDDR5X supply constraints and cost optimization. > Impact on Memory Volume: CPU-side LPDDR5X memory per rack drops from ~54–55TB down to ~28TB, while GPU-side HBM4 capacity remains unchanged at ~20.7TB per rack. > Vera CPU Rack Outlook: Nvidia's Vera CPU racks are also expected to adopt 96GB SOCAMM per CPU (768GB total per CPU instead of the 1.5TB spec sheet), though deliveries may be delayed due to stacking and density changes with Samsung as the sole supplier. > General Servers Lowering Specs: General server DDR5 specs are expected to be reduced by roughly 50% per CPU, with 96GB/64GB becoming the new mainstream via new RDIMM and/or MRDIMM. Financial & BOM Impact> VR200 Cost Reduction: Reducing LPDDR5X capacity effectively lowers LPDDR5X costs to $293k (under an extreme scenario down to one-fourth capacity) or $586k (4Q26E version), preventing costs from escalating to $1.2m. > Controlling Total BOM: Without capacity adjustments, memory and storage costs would spike to $2.1m (29% of the total BOM); cutting capacity successfully manages memory costs back down to the ~20% level. Market Shipments & Outlook> Deployment Priority: The specification cuts allow Nvidia to prioritize faster system deployment and higher rack availability rather than delaying deliveries. > General Server Recovery: General server shipments are projected to rise mildly QoQ in 2Q–3Q26, followed by a strong pick-up of 20% to 30% QoQ in 4Q26. $NVIDIA(NVDA.US) $Micron Tech(MU.US) $DRAM $EWYE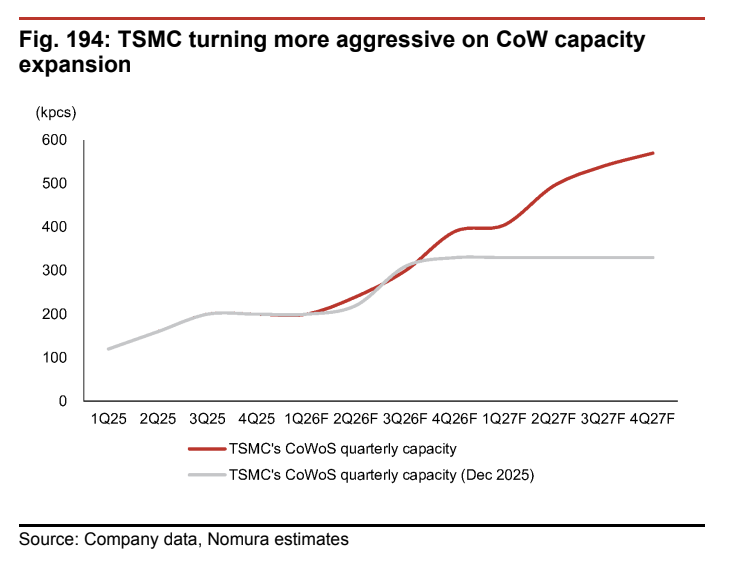
Nomura Research: TSMC CoWoS
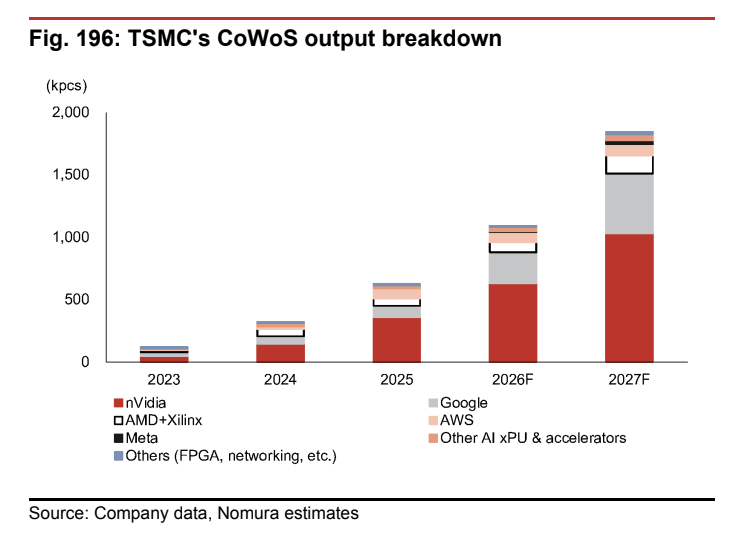
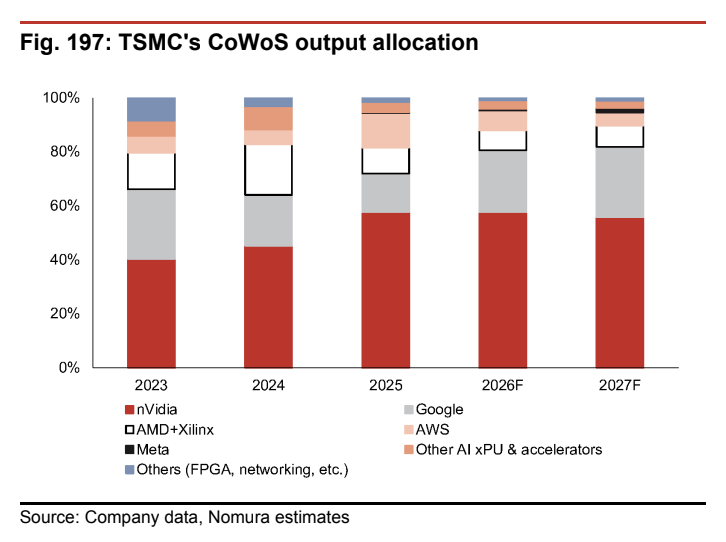
TSMC CoWoS Capacity Expansion Trend> Aggressive Upward Revision: According to Nomura estimates, TSMC has turned significantly more aggressive on its CoWoS capacity expansion compared to previous targets (Dec 2025 baseline).> Growth Trajectory: Quarterly capacity is projected to scale up dramatically from around 200 thousand pieces (kpcs) in late 2025/early 2026 to near 600 kpcs per quarter by late 2027.> Divergence from Older Projections: While previous estimates flattened out near 330 kpcs per quarter through 2026 and 2027, current forecasts show continuous sequential expansion starting from mid-2026 onwards.CoWoS Output Breakdown (Volume Growth)> Total Volume Surge: Total output volume is scaling multifold, expanding rapidly from 2023 levels to an estimated peak approaching 2,000 kpcs annually by 2027F.> NVIDIA Dominance in Volume: NVIDIA remains the single largest consumer of TSMC's CoWoS capacity by a wide margin, scaling from a minority share in 2023 to over 1,000 kpcs by 2027F.> Diversification of Hyperscalers: Volume is increasingly supporting customized accelerators and ASICs from major cloud service providers, notably Google and AWS, alongside AMD+Xilinx and Meta.CoWoS Output Allocation Share (%)> NVIDIA Share Stabilization: NVIDIA’s relative share of total CoWoS allocation stabilizes in the 55% to 58% range from 2025F to 2027F, after peaking earlier relative to its initial 2023 baseline.> Google's Expanding Footprint: Google captures the second-largest share of allocation, maintaining a steady slice around 24% to 26% of total capacity through the forecast window.> Other Players: AMD+Xilinx, AWS, Meta, and other networking/FPGA applications split the remaining allocation, with hyperscaler custom silicon taking up a stable overall proportion of advanced packaging lines.$Taiwan Semiconductor(TSM.US) $Alphabet(GOOGL.US) $AMD(AMD.US) $NVIDIA(NVDA.US) $Meta Platforms(META.US) $Amazon(AMZN.US)
E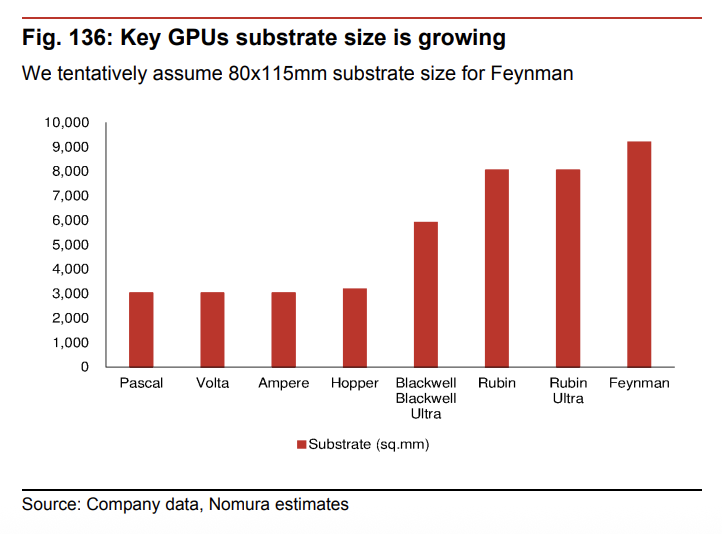
Nomura Securities: GPU Substrate
Substrate Size Trends for Key GPUs> Overall Trend: The substrate size for key GPUs is growing over successive generations.> Early Generations (Pascal, Volta, Ampere, Hopper): Maintained relatively stable substrate sizes, ranging from approximately 3,000 to just over 3,000 sq. mm.> Blackwell / Blackwell Ultra: Shows a significant increase, rising to approximately 6,000 sq. mm.> Rubin & Rubin Ultra: Jump further to approximately 8,000 sq. mm.> Feynman: Reaches the highest projected size on the chart, with a tentative assumption of an 80x115 mm substrate size, translating to roughly 9,200 sq. mm.E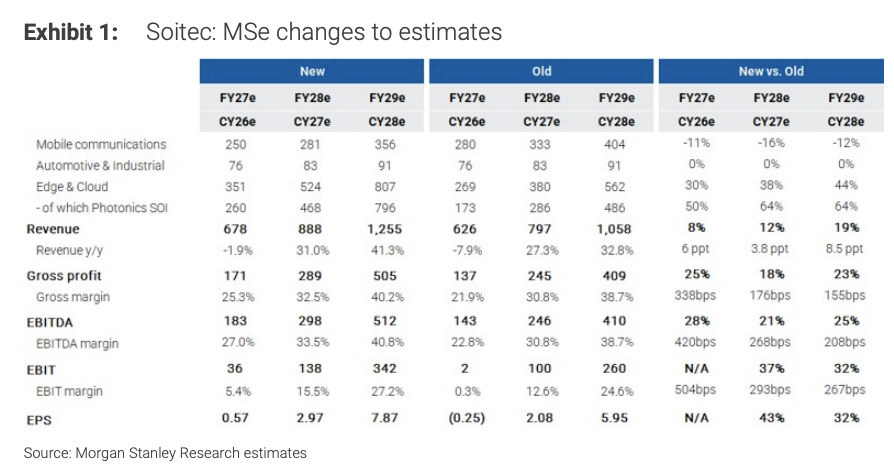
Morgan Stanley: Soitec
Financial Performance & Estimates> F1Q27 Beat: Revenue came in at €113 million, beating street estimates by 6% and marking a 23% year-over-year growth ( outpacing the company's 15% guide). > Strong Guidance: F2Q27 revenue growth is guided at more than 30% year-over-year, blowing past the 4% consensus expectations. > Significant Earnings Upgrades: Morgan Stanley raised its revenue estimates for FY27–FY29 by 8–19% and upgraded EPS for FY28 and FY29 by 43% and 32% respectively, projecting almost €8 of EPS by FY29. 💡 Core Investment Drivers (Photonics-SOI)> The Growth Engine: The stellar performance and guidance are heavily driven by Photonics-SOI demand for high-speed optical interconnects in AI data centers. > Doubling Revenue: Management explicitly noted that Photonics-SOI FY27 revenue is expected to more than double, acting as the catalyst the market had been anticipating. > Secular Alignment: Soitec’s stellar outlook mirrors broader industry tailwinds from major players scaling up silicon photonics (SiPho) capacity—such as Tower Semiconductor, STMicroelectronics, and TSMC. Photonics is expected to scale from roughly 8% of Soitec's revenue in FY25 to about one-third in the current fiscal year. Scenario Analysis (Price Target Cases)> Bull Case (€300.00): Assumes a stronger recovery in RF-SOI alongside more aggressive, accelerated growth in Photonics-SOI, paving the way for €10 in earnings power.> Base Case (€200.00): Assumes multi-year growth in Photonics-SOI and normalization in RF-SOI, applying a 25x multiple to CY28 (FY29) EPS.> Bear Case (€80.00): Assumes a slower RF-SOI recovery and weaker Photonics growth, applying a 20x multiple to discounted bear-case earnings.E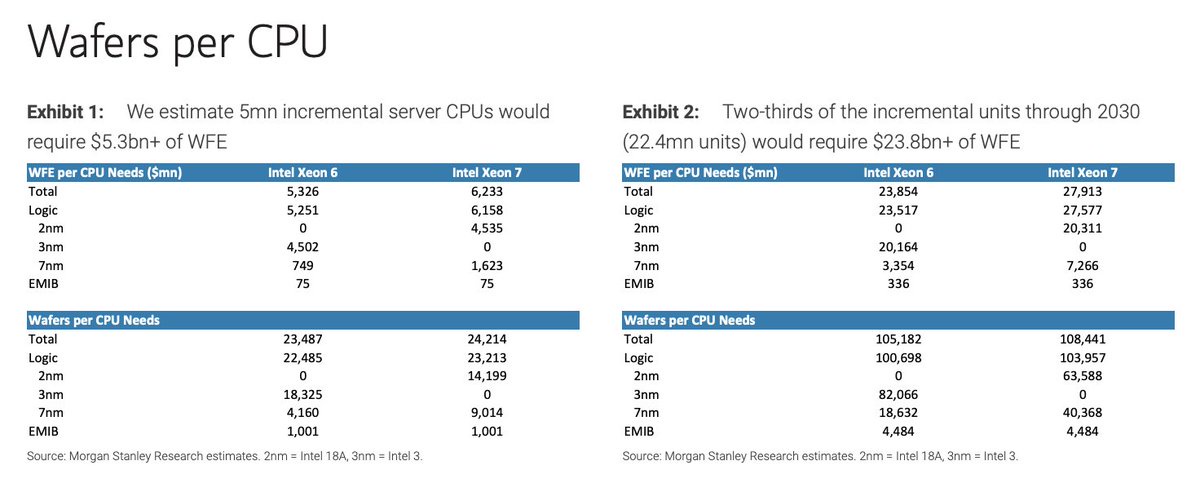
Morgan Stanley: Intel CapEx Spend
Core Forecasts and Capex Revisions> WFE and Capex Projections: The 2027 WFE forecast is set at $202 billion (a 31% year-over-year increase), which incorporates a $25 billion capex assumption specifically for Intel, though analysts see potential for further upside. > Upward Revisions: Intel previously revised its 2026 capex outlook to over $20 billion and signaled that 2027 capex will be "significantly above 2026 levels". > CPU Demand Drivers: Producing 5 million incremental Xeon 6 units requires an estimated $5.3 billion+ in WFE. Expanding logic wafer capacity to capture two-thirds of incremental CPU units (22.4 million units through 2030) demands a minimum of $23.8 billion for Xeon 6 and $27.9 billion for Xeon 7. Key Equipment Beneficiaries> Outside the US:Tokyo Electron (TEL): Historically counts Intel as a major customer (ranging from over 10% up to 20.4% in F3/20). Lasertec: Has seen Intel represent 10% or more of its customer base historically, peaking at 31.6% in F6/22. > Within the US:KLA Corp (KLAC): Highlighted as an outsized US beneficiary. Although Intel has not been a 10% customer since F6/15, Intel is heavily leaning on KLA to improve manufacturing yields and margins to succeed as a viable foundry, positioning KLA for potential massive revenue growth from Intel between 2025 and 2027. $KLA $Intel(INTC.US)E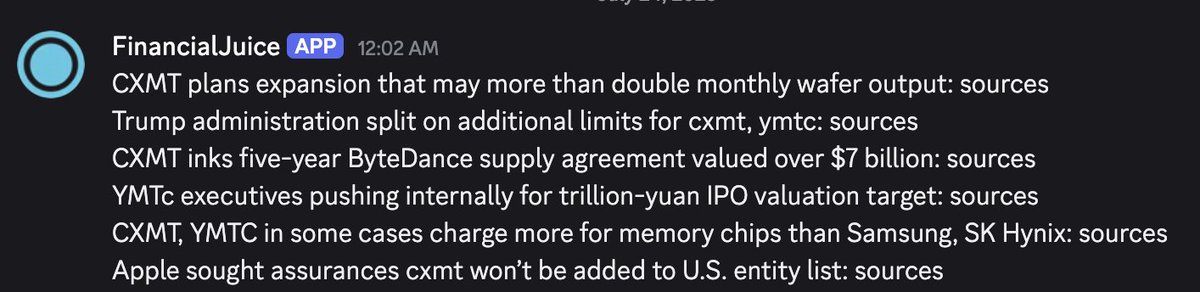
Major news on CXMT & YMTC all at once.
1. CXMT plans expansion that may more than double monthly wafer output2. CXMT inks five-year ByteDance supply agreement valued over $7 billion. 3. Trump administration split on additional limits for CXMT, YMTC4. YMTC executives pushing internally for trillion-yuan IPO valuation target5. CXMT, YMTC in some cases charge more for memory chips than Samsung, SK Hynix6. Apple sought assurances CCXMT won't be added to U.S. entity list.E
A Senior Executive at Supply Chain Logistics Company on fiber cable:
"We're seeing a huge restriction in fiber cable availability, which that's a very critical part of the network and builds just cannot happen if that fiber is not available. That's for sure creating some concern out there."Market Demand and Supply Overview> Seasonal Demand: Demand for fiber buildouts is strong, following the typical seasonal peak that runs from late March/April through the end of the summer. > The Primary Bottleneck: Bulk fiber cable is severely restricted due to high demand from the data center and hyperscale environment (such as Amazon, Google, and Meta), leaving less capacity for traditional telecom builds. > Other Components: Aside from fiber cable, other products and miscellaneous items (such as conduit and hand tools) are experiencing no supply or lead time issues.Impact Across Telecom Tiers> Tier 1 Providers Protected: Major service providers like AT&T, Verizon, Brightspeed, and Lumen are largely insulated from shortages because they have direct contractual allocation programs with major manufacturers. > Tier 2 & Tier 3 Providers Impacted: Smaller regional providers (such as Cincinnati Bell or Consolidated Communications) are facing significant challenges, with an estimated 25% of their builds currently impacted or pushed out due to a lack of available fiber. Manufacturing Shifts (Corning and CommScope)> Corning's Hyperscaler Focus: Corning has locked up mega-deals with hyperscalers like Amazon Web Services, Google, and Meta, turning its focus toward data center customers. > CommScope Supply Disruption: Corning cut off its long-standing partnership of supplying raw glass to its competitor CommScope to satisfy its own customer demands, heavily disrupting CommScope and causing lead times to stretch out by months. > Capacity Timeline: Industry participants are advised that it will take 1.5 to 2 years for new U.S. manufacturing capacity to come online to meet the surge in demand.Active Electronics Bottlenecks> Secondary Concern: Active network equipment requiring memory chips—sourced from vendors like Adtran, Nokia, and Calix (including ONTs, OLTs, CPE, and servers)—represents a growing but secondary bottleneck. > Cost and Lead Times: These active components are facing double-digit cost increases and doubled lead times, though they are not currently causing widespread project cancellations.$Corning(GLW.US)E
Former Strategic Sales & Business Development Manager at Intel:
"Google TPUs are trying to beat that performance per token with 30-40% less power requirement compared to Nvidia, so that's the main point... the performance per token will increase probably by 40x to 50x in two years."> Packaging Bottlenecks & Reticle Size Limits: TSMC's Chip-on-Wafer-on-Substrate (CoWoS) holds proven yields but is structurally capped at 6.5x to 7.5x reticle sizes. This creates a bottleneck as AI accelerators demand larger dies, more computing cores, and expanded high-bandwidth memory (HBM) stacking.> Intel's EMIB-T vs. TSMC: Intel's EMIB-T (Embedded Multi-die Interconnect Bridge with Through-Silicon Via) offers projected yields above 90% and is estimated to be roughly 30% lower in cost compared to CoWoS. However, it remains commercially unproven against the 95% threshold required by major customers like Google. Furthermore, Intel faces packaging capacity constraints compared to TSMC's massive expansion. > Cost Breakdown: Advanced packaging costs typically run under $5,000 to $7,000, representing a fraction of a total system-on-chip (SoC) cost that can reach around $60,000 for advanced 3.5D setups. > Google's TPU Roadmap: Google is pursuing an aggressive trajectory targeting 30% to 40% lower power than Nvidia alongside a 40x to 50x increase in performance-per-token within two years. This push is driving faster dual-track adoption of 3.5D packaging solutions using small outline integrated circuits and Intel's EMIB-T. > Glass Substrates Timeline: Meaningful mass production of glass core substrates for high-volume AI accelerators is realistically expected to land around 2029. Consequently, near-term EMIB-T adoption relies on conventional organic substrates. > Foundry Preferences (14A vs. 18A): If Intel's packaging solutions successfully mature, large hyperscalers are more likely to lean toward Intel's 14A node rather than 18A. This preference is driven by 14A's power and area metrics being comparable to TSMC's N2P process, coupled with potential cost savings and relief from TSMC's allocation bottlenecks.$Alphabet(GOOGL.US) $Taiwan Semiconductor(TSM.US) $Intel(INTC.US)