

NewUser_tXvx48

NewUser_tXvx48

5Following0Followers105Likes & Bookmarks
N
NewUser_tXvx48

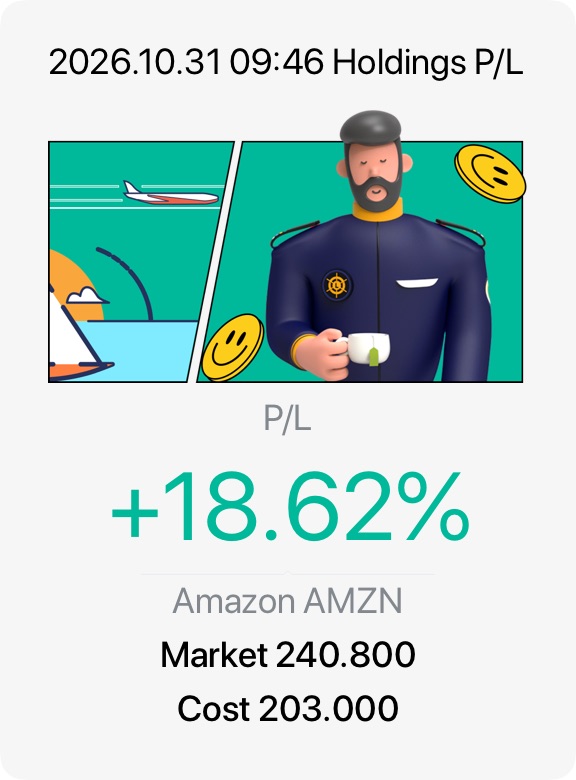
Amazon ($Amazon(AMZN.US)) is currently trading near $240.80 following a ~7% post-earnings decline triggered by its Q3 2026 financial report. While operations remain resilient, intensive capital expenditures into artificial intelligence infrastructure have introduced near-term cash flow volatility, testing investor sentiment.

Core Drivers & Financial Health

• AWS Acceleration: Amazon Web Services (AWS) grew revenue 39.3% year-over-year to $46 billion. Management expects >40% growth in 2027 and 2028, targeting a $1 trillion cloud revenue run rate within 5–10 years.

• Profitability Milestones: Total revenue rose 12% to $201.94 billion. The company achieved its highest-ever group operating margin at 13.9%, yielding an operating income of $28.1 billion.

The Core Risk: Capex & Cash Flow Outflows

• AI Capex Pressures: Amazon held its massive 2026 capital expenditure target at $220 billion to fund data centers and custom Trainium/Graviton chips.

• Negative Free Cash Flow: This aggressive infrastructure build-out resulted in a trailing 12-month free cash flow outflow of $42.4 billion, a stark shift from the positive $14.8 billion cash generation seen in prior periods.

Valuation & Outlook

• Historical Multiples: Despite a small Q3 earnings miss ($1.89 EPS vs. $1.96 consensus), the stock pullback pushes its valuation to 24x forward earnings—an 80% discount to its 5-year historical median.

• Wall Street Stance: Consensual brokerage sentiment remains a Strong Buy with an average price target near $330, implying over 35% upside potential from current depressed levels.
图片 1,共 1 张
Trade Showcase: Trade, Show & Earn Rewards!
N
NewUser_tXvx48

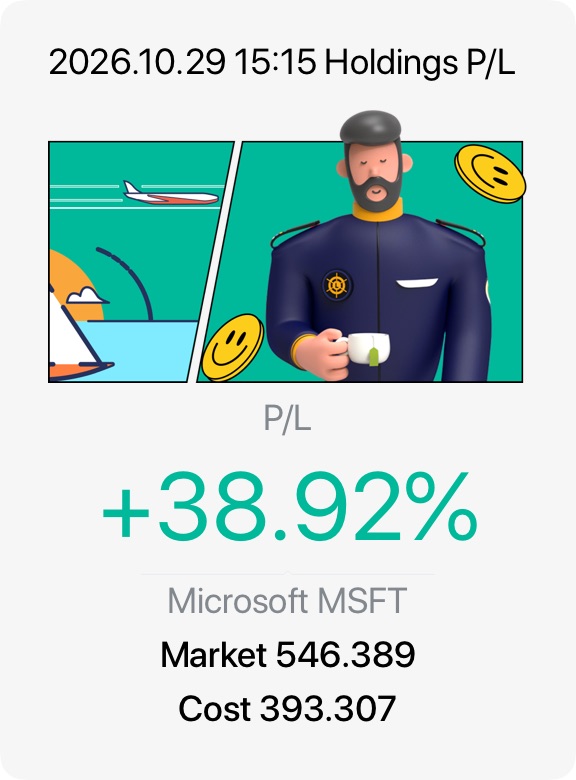
Microsoft $Microsoft(MSFT.US) remains a premier secular growth engine, trading at $531.01 with a $3.94 trillion market cap. Its Q1 FY2027 earnings report highlights absolute dominance in enterprise software and infrastructure.

Financial Health & Hyper-Growth

• Earnings Beat: Revenue surged 19% to $92.28 billion; EPS hit $4.89, crushing consensus.

• Azure Surge: Azure revenue grew 48%, fueled by massive enterprise AI adoption.

• Cash Machine: Generated $18.6 billion in free cash flow with a stellar 49.8% operating margin.

Strategic Catalysts & Risks

• AI Monetization: Recorded $10 billion in quarterly revenue from OpenAI arrangements.

• Efficiency Gains: Copilot users rose 50% YoY, optimizing GPU token returns.

• Capex Headwinds: Capital expenditures hit $45.2 billion and will surpass $50 billion next quarter, limiting intermediate FCF expansion.

Valuation & Outlook

Trading at 29.5x trailing earnings, MSFT is highly attractive for its compounding power. Wall Street maintains a strong “Buy” consensus with an average price target near $596 ($580–$600 post-earnings upgrades). Microsoft is a definitive Top Pick Core Long, offering the safest profile and highest visibility of monetization in the AI value chain.

图片 1,共 1 张
Trade Showcase: Trade, Show & Earn Rewards!
N
NewUser_tXvx48

With Q3 2026 earnings dropping tomorrow (Oct 29), Wall Street is hyper-focused on Big Tech’s crown jewel. The stock has been trading sideways lately, up ~10% this year, but the underlying engines are roaring. Here is your quick, no-nonsense breakdown.

📈 The Bull Case: Hyper-Growth Cloud & AI

• AWS Reacceleration: Cloud growth surged to an explosive 37% YoY in Q2. Analysts think it could touch 40%+ this quarter driven by aggressive generative AI enterprise adoption.

• Sold Out Through 2027: CEO Andy Jassy revealed that most of AWS’s cloud computing capacity is already booked out through 2027. The demand is real.

• High-Margin Ads: Amazon’s advertising business continues to grow at a mid-20% clip, cushioned further by lucrative Prime Video live sports.

• Wall Street Backing: Institutional analysts are overwhelmingly bullish, carrying a consensus target near ~$325 (representing a ~23% upside from current levels).

📉 The Bear Case: The $220 Billion Capex Burden

• Cash Flow Squeeze: Amazon is spending a jaw-dropping ~$220B in capital expenditures this year to construct AI data centers. This aggressive infrastructure spend has pushed trailing free cash flow into negative territory.

• Margin Headwinds: Massive spending means rising depreciation costs will weigh down reported operating margins over the next few quarters, even if the top-line grows.

• Valuation: Trading at a forward multiple around 24x, it carries a premium valuation that leaves little room for a Q3 earnings miss.

💡 The Verdict

Amazon isn’t just buying growth; its $496B backlog proves customers are waiting in line. If AWS hits the high-30s or low-40s tomorrow, the stock could easily break out toward $300+. But if capex Guidance spikes higher without matching near-term revenue, expect a short-term pullback.

图片 1,共 1 张
Trade Showcase: Trade, Show & Earn Rewards!
N
NewUser_tXvx48

Microsoft Corp (MSFT) is trading at $532.60, rebounding sharply from mid-year pullbacks and approaching its 52-week high of $553.72. The tech giant enters its fiscal Q1 2027 earnings report on October 28 with immense fundamental momentum.

Bull Case & Catalyst Growth

• Cloud Dominance: Azure cloud revenue remains the primary growth engine, expanding by 41% year-over-year in fiscal 2026 and crossing the $100 billion milestone for the first time.

• Enterprise AI Commercialization: Microsoft 365 Copilot has surpassed 30 million paid seats, demonstrating that customer demand continues to outpace available infrastructure capacity.

Bear Case & Strategic Risks

• CapEx Intensity: Projected capital expenditures of $175 billion for calendar 2026 are putting intense pressure on near-term free cash flow conversion.

• Consumer Stagnation: Deeper hardware declines persist, with third-quarter global PC shipments tumbling 20.1% year-over-year.

My Trade Strategy

Given the high options implied volatility ahead of the October 28 earnings announcement, my trade is to avoid buying the stock at these peak levels and instead deploy a Bull Put Spread. Specifically, selling the $500 put and buying the $480 put expiring in November allows me to capture high premium while utilizing the strong horizontal support floor at $500. This strategy generates attractive yield if MSFT consolidates or moves higher, while defining risk in case massive AI capital expenses trigger a temporary earnings pullback.

图片 1,共 1 张
Trade Showcase: Trade, Show & Earn Rewards!
N
NewUser_tXvx48

Context

Amazon.com Inc (AMZN) is currently trading at $248.00, sitting roughly 9% below its all-time high of $287.20 achieved in August 2026. The broader market narrative is heavily focused on the tension between massive AI infrastructure spending and top-line cloud growth. In its most recent Q2 earnings report, Amazon posted stellar numbers: net sales jumped 20% to $200.6 billion, and AWS growth accelerated to 37% year-over-year ($42.2 billion), fueled by surging generative AI workloads.

However, this massive growth comes with a steep price tag. Amazon raised its full-year 2026 capital expenditures target to a staggering $220 billion due to skyrocketing infrastructure and memory costs. This aggressive spending caused trailing 12-month free cash flow to turn negative at -$7.6 billion, presenting a clear near-term headwind.

My trade

• Primary Execution Strategy: Buy half of the intended position size at the current price of $248.00 to secure exposure.

• Contingency Execution Strategy: Reserve the remaining 50% of the capital to deploy immediately post-earnings on October 29. If the stock dips due to high CapEx numbers, I will buy the pullback; if it breaks out on strong backlog conversion, I will buy the momentum.

• Alternative Derivatives Structure: For options traders, an attractive alternative is a Bull Call Spread (buying a slightly out-of-the-money call and selling a higher strike call). This limits premium exposure and mitigates the inevitable post-earnings implied volatility (IV) crush.

Takeaway

Amazon remains a top-tier secular growth compounder, but investors must tolerate near-term free cash flow volatility as the company builds out its AI dominance. While the $220 billion infrastructure bill is heavy, it acts as a massive competitive moat that secures Amazon’s role as a primary infrastructure winner in the agentic AI era.

图片 1,共 1 张
Trade Showcase: Trade, Show & Earn Rewards!
N
NewUser_tXvx48

Context

Palantir has officially transitioned from a speculative “story stock” into a highly profitable enterprise software powerhouse. In its most recent Q2 results, revenue exploded 93% year-over-year to $1.94 billion, crushing conservative forecasts. This breakneck acceleration is primarily fueled by explosive growth in its US Commercial sector (+149% YoY), proving that its Artificial Intelligence Platform (AIP) has achieved profound product-market fit. Financially, the operational model is remarkably robust: it generates a 62% adjusted operating margin, boasts $9.2 billion in cash with zero debt, and maintains a phenomenal Rule of 40 score of 155%. Consequently, top-tier institutions have aggressively turned bullish, with Goldman Sachs upgrading the stock to “Buy” and Barclays initiating an “Overweight” rating with a street-high target of $265.

My trade

• The Tactical Strategy: Rather than chasing shares at the peak of the 52-week range ($212.94), a smarter trade is to capture volatility or wait for a pullback.

• Actionable Plan: Selling out-of-the-money cash-secured puts targeting the $170–$175 support zone allows you to either pocket a rich premium driven by implied volatility or accumulate shares at a more justifiable discount if the market reacts harshly to forward guidance. Alternatively, long-term investors should hold off on adding capital until Q3 numbers clarify if sequential momentum can match the current expectations.

Takeaway

Palantir represents a premier operational thesis paired with a severely stretched valuation. The company’s massive $472.80 billion market cap is entirely dependent on its ability to sustain near-triple-digit growth scales. While its fundamental strength, balance sheet, and institutional backlog make it an exceptional secular AI holding, risk mitigation must take precedence. Buy the underlying enterprise strength, but only execute on structural price dips.

图片 1,共 1 张
Trade Showcase: Trade, Show & Earn Rewards!
N
NewUser_tXvx48

Context

Uber Technologies Inc. $Uber Tech(UBER.US) is trading at $66.70, presenting a fascinating disconnect between its highly profitable core business and Wall Street’s anxiety over the future of autonomous vehicles (AVs). While the stock has pulled back roughly 28% from its highs and underperformed the broader market this year, its underlying financials are stronger than ever.

• The Financial Engine: Trailing 12-month free cash flow has crossed a milestone $10 billion. Gross bookings have maintained consistent 20%+ year-over-year growth.

• The Valuation Reset: Thanks to the recent stock drop, Uber’s forward P/E multiple compressed significantly to around 15.9x, making it surprisingly affordable for a tech giant growing operating income at over 30%.

My trade

• Action: Buy UBER equity at or below current levels ($66.50–$68.00).

• Position Sizing: Core growth holding (3% of a diversified portfolio).

• Risk Management: If options volatility spikes further leading up to Nov 4th, selling out-of-the-money puts (e.g., $60 strike) to collect premium and potentially acquire more shares at an even steeper discount is a highly attractive secondary play.

Takeaway

Wall Street is mispricing the autonomous threat. Building a fleet of robotaxis is an expensive, localized hardware challenge; aggregating demand, managing routing, and maintaining customer loyalty via a cross-selling super-app (like Uber One) is a network effect challenge.

Uber already owns the global consumer relationship. Even if autonomous fleets scale rapidly, AV operators will still need to plug into Uber’s marketplace to achieve profitable vehicle utilization rates. At under 16x forward earnings, you are essentially buying a highly profitable tech monopoly at a discount, getting its massive autonomous optionality entirely for free.

图片 1,共 1 张
Trade Showcase: Trade, Show & Earn Rewards!
N
NewUser_tXvx48

Context

Broadcom Inc. (AVGO) has experienced a significant correction, trading at $323.24. This is roughly 35% down from its all-time high of $495. The broader semiconductor sector has entered a gruesome corrective phase due to rising anxieties over AI financing, infrastructure bottlenecks (such as land and power shortages), and the durability of massive tech capex.

My trade

Given the stock is trading deep within a firm institutional support zone between $320 and $330, my trade strategy shifts to accumulating long equity exposure at an aggressive discount.

• The Setup: Sell out-of-the-money cash-secured put options or purchase direct equity blocks at current levels ($323–$325).

• The Math: Wall Street maintains a strong consensus with an average 12-month target of $527.20. Morningstar models its fair value at $650 based on a conservative 23x multiple on its projected 2028 EPS of $30+. Trading at roughly 17.5x trailing cash flows, the current entry provides a 25%+ margin of safety relative to its intrinsic value.

Risk Management: Position sizes will be capped at 4% of the total portfolio to account for high customer concentration among Tier-1 hyperscalers (Google, Meta, Anthropic) and capital constraints on data center rollouts.

Takeaway

Broadcom is the premier AI infrastructure buy hiding in plain sight. While the market is treating AVGO like a high-risk cyclical chip asset, it is actually a highly diversified cash engine anchored by high-margin, recurring software revenues via VMware and an unbeatable, multi-generational custom silicon roadmap. The recent 35% haircut is a symptom of macro market exhaustion, not operational failure. For patient investors, this mismatch between short-term sentiment and guaranteed multi-year AI order books offers a textbook entry point.

图片 1,共 1 张
Trade Showcase: Trade, Show & Earn Rewards!
N
NewUser_tXvx48

Context

Micron Technology (MU) is riding an unprecedented AI-driven memory supercycle. The company recently reported blowout fiscal full-year 2026 results, with revenue surging 256% year-over-year to $133.19 billion and net income skyrocketing 895% to $84.97 billion. This structural boom is driven by tight industry supply and high-volume demand for High-Bandwidth Memory (HBM3e/HBM4) paired with next-generation AI GPUs like Nvidia’s Vera Rubin.

Despite these record-breaking fundamentals and strong fiscal Q1 2027 revenue guidance of $61.5 billion, the stock has experienced heavy volatility. After peaking at an all-time high of $1,255 in June 2026, MU has pulled back roughly 30% to around $878–$906. This correction is fueled by macro headwinds (sticky inflation data) and competitive anxiety following reports that Chinese rival CXMT is making rapid progress on a denser DRAM design. However, this panic ignores Micron’s massive cyclical buffer: over 75% of Micron’s fiscal 2027 capacity is already locked up in volume-secured contracts with predefined pricing floors. Because of the massive earnings growth, the valuation has compressed significantly, leaving Micron trading at an incredibly cheap forward P/E of just ~5.3x.

My trade

• Strategy: Scaling into long equity positions using a multi-tranche approach to exploit the near-term technical oversold territory.

• Tranche 1 (Immediate Entry): Buy 50% allocation at $890, near current structural support.

• Tranche 2 (Limit Order): Buy remaining 50% allocation if the price tests the key technical overlap zone between $775 and $800.

Takeaway

Fear Over Fundamentals: The market is prematurely pricing in a structural structural downturn from Chinese competition that won’t realistically threaten server-level qualified allocations until at least 2028 or 2029.

图片 1,共 1 张
Trade Showcase: Trade, Show & Earn Rewards!
N
NewUser_tXvx48

Context

Meta has reached the AI frontier with the launch of its highly anticipated Muse Wonder and Muse Wonder Full LLM models, directly challenging OpenAI’s ChatGPT and Anthropic’s Claude. Crucially, the company introduced paid subscription tiers ($20 and $100 per month), creating a highly sought-after standalone AI revenue stream outside of traditional advertising. Early retention data shows Muse retaining 73% of new users the day after installation, triggering a fresh wave of Wall Street upgrades—including a street-high target of $1,000 from Truist and Wells Fargo.

My trade

• Core Drivers: Meta’s core advertising architecture continues to print cash, optimized heavily by its Advantage+ AI solutions (now at a $75 billion annual revenue run rate). In Q2, ad revenues jumped 27% year-over-year.

• The Valuation Disconnect: At ~$762, META trades at a trailing P/E ratio of 26.4x. This multiple is remarkably cheap given its dominant 3.6 billion daily active users (DAU) and its return on invested capital (ROIC) hovering at 34%.

I am adding more meta at its current state.

Takeaway

Meta is transforming from a pure-play social media advertising business into the ambient infrastructure layer for agentic AI and consumer smart hardware.

• For Short-Term Traders: Exercise near-term caution. The options market is pricing in volatility ahead of the October 21 earnings report. Look for range-bound swing opportunities between the $651 support and $782 resistance levels.

图片 1,共 1 张
Trade Showcase: Trade, Show & Earn Rewards!
N
NewUser_tXvx48

Context

Microsoft Corporation (MSFT) is experiencing a fundamental narrative shift driven by the changing economics of artificial intelligence. The stock went through a notable period of capital expenditure (CapEx) fatigue earlier this year, dipping to around $372 in June as investors worried about massive AI infrastructure costs.

However, Microsoft’s latest fiscal Q4 earnings completely changed the narrative. The company posted a blowout quarter with $90.01 billion in revenue (up 18% YoY) and an adjusted EPS of $4.74, easily beating consensus estimates. The star of the show was the Intelligent Cloud segment, where Azure crossed $100 billion in annual revenue and maintained an impressive 43% growth rate.

My trade

My primary strategy is to Accumulate Shares via the Dip-Buying Method, targeting entries between $500 and $525 during minor pullbacks. The reasoning behind this allocation stems directly from the company’s clear line of sight on AI monetization:

• Valuation Disconnect: Buying at a forward P/E of ~26x for a business growing both revenue and net income near 20% provides a strong margin of safety.

• Backlog & Enterprise Moat: Microsoft’s commercial remaining performance obligation (RPO) skyrocketed to $678 billion. This indicates immense, multi-year enterprise demand that will sustain revenue long after the initial AI hype settles.

Takeaway

The easy money from the initial post-earnings bounce has been made, but Microsoft remains the safest and most operational play in the global AI transition. While CapEx will remain elevated as Microsoft builds out infrastructure, its model-agnostic software architecture allows it to easily swap underlying compute resources while efficiently capturing corporate workflows. As long as Azure demand continues to outstrip capacity and enterprise backlogs continue to expand, any near-term valuation discount relative to historical averages represents a high-probability buying opportunity.

图片 1,共 1 张
Trade Showcase: Trade, Show & Earn Rewards!
N
NewUser_tXvx48

Context

Uber Technologies Inc. (UBER) is currently trading at $71.51 per share, operating at a highly compressed valuation compared to its recent historical peaks. Despite solid top-line performance with revenue growing 16.7% and trailing free cash flow reaching a massive $10.12 billion, macro anxieties have heavily weighed on the stock. UBER has dropped roughly 28% over the past year, driven primarily by market fears over autonomous vehicle (AV) disintermediation and mixed near-term earnings guidance.

Wall Street treats the imminent arrival of robotaxis as an existential threat to Uber’s business model. However, the operational reality tells a completely different story. Uber is aggressively positioning itself as the indispensable matchmaker of the AV era. Instead of building capital-intensive fleets, management is executing a highly efficient asset-light strategy, securing strategic partnerships with NVIDIA, Waymo, Pony.ai, and WeRide. At a trailing P/E ratio of just 15.7x, the market is pricing Uber as a legacy rideshare company facing structural decline, entirely ignoring its expanding operating margins (12.13%) and dominance in consumer demand distribution.

My trade

• Action: Buy shares of UBER at the current market level of $71.51.

• Target Price: $100.00, representing an approximate 40% upside as valuation multiples re-rate toward historical norms and consensus analyst targets.

• Stop Loss: $64.00, placed just below the established 52-week low of $65.41 to protect against severe macro downturns or sudden adverse shifts in labor regulations.

Takeaway

The key takeaway for Uber is that network effects and demand aggregation win the technological transition. Developing an autonomous vehicle is only half the battle; commercializing it requires a marketplace overflowing with active riders and integrated logistics.

图片 1,共 1 张
Trade Showcase: Trade, Show & Earn Rewards!
N
NewUser_tXvx48

Context

Palantir has officially transitioned from a sluggish, black-box defense contractor into the dominant orchestration layer for enterprise AI. Its recent Q2 2026 earnings report was a historical milestone, showcasing a blistering 93% year-over-year revenue growth ($1.94 billion) and an exceptional 47% operating margin—surpassing even legacy SaaS titans like Microsoft.

• U.S. Commercial Explosion: Driven by its Artificial Intelligence Platform (AIP), U.S. commercial revenue surged 149% year-over-year.

• Sovereign AI Infrastructure: Palantir is securing its future pipeline via massive new global infrastructure alliances with partners like Nebius and Nvidia.

• The Valuation Catch: Wall Street has flipped ultra-bullish, with Goldman Sachs upgrading PLTR to a Buy with a $230 target and Barclays establishing a $265 target. However, executing at this level comes with a heavy tax: the stock trades at an incredibly steep trailing P/E ratio of roughly 169x and a forward sales multiple exceeding 62x.

My trade

Given the extreme bullish momentum backed by historic fundamental acceleration, executing a straight long equity position at all-time highs risks stepping right into a local top. Instead, a long-term growth framework utilizing a blended approach mitigates downside risk while maintaining upside exposure.

• Primary Action: Core position scaling via a dollar-cost averaging (DCA) approach over the next two quarters rather than a lump-sum entry.

• Tactical Option Play: For active traders, selling out-of-the-money cash-secured puts (targeting the $175–$180 support range) allows you to collect high options premiums driven by PLTR’s volatility or acquire shares at a 15% discount if a macro pullback occurs.

Takeaway

If cash flows compound at 30–40% annually over the next 5 years, the business will rapidly grow into its market valuation, making any near-term pullbacks prime buying opportunities.

图片 1,共 1 张
Trade Showcase: Trade, Show & Earn Rewards!
N
NewUser_tXvx48

Context

• The Valuation Disconnect: AWS is experiencing explosive growth, accelerating to 37% YoY growth in the most recent quarter to reach a $169 billion annual revenue run rate. Yet, Amazon’s overall market capitalization has failed to keep pace with this earnings expansion, compressing its trailing P/E ratio to an attractive 20.4x.

• The Capex vs. Cash Flow Dilemma: To sustain its artificial intelligence and cloud dominance, Amazon aggressively raised its 2026 capital expenditure outlook to a massive $220 billion. While operating cash flow remains robust, this aggressive data center expansion has temporarily dragged trailing twelve-month free cash flow to -$7.6 billion.

My Trade

• The Strategy: I am taking an Overweight / Long Position at the current price level of $256.64 to capitalize on institutional accumulation before the late October earnings call.

• Entry Point: Accumulating shares in the $254 – $257 range, using the recent weekly defensive consolidation as a base.

Takeaway

• Look Past the Capex Scare: The market is overly penalized by the negative free cash flow metrics caused by front-loaded AI infrastructure investments. History shows that Amazon consistently builds high-return moats when it spends aggressively early in tech cycles.

• High-Margin Revenue Diversification: Beyond AWS, Amazon’s ultra-high-margin Advertising segment (now tracking at a $72 billion annual run rate) provides a massive profitability cushion that retail-facing competitors cannot match.

• Asymmetrical Risk/Reward: With a depressed 20x P/E multiple and a strong structural layer of institutional backing—such as the National Pension Service recently increasing its stake—the downside is structurally limited compared to the massive upside potential if AWS margins continue to widen past 39%.

图片 1,共 1 张
Trade Showcase: Trade, Show & Earn Rewards!
N
NewUser_tXvx48

🌐 Context

• The Numbers: Microsoft (MSFT) trades around $530.50. It is holding an impressive $3.93T market capitalization with a P/E ratio sitting at 29.5x.

• The Drivers: In its last major earnings report, Azure annual revenue crossed $100 billion for the first time, surging 43% year-over-year. Simultaneously, Microsoft 365 Copilot scaled past 30 million paid seats.

• The Catalysts: Microsoft just scheduled its Fiscal Q1 2027 earnings release for October 28, 2026. Tech sentiment is high following a wave of hardware events announcing on-device AI laptops powered by Nvidia and integrations featuring OpenAI’s GPT-6 Astra.

📊 My Trade

• Action: Holding current long positions / Accumulating on macro dips.

• Entry / Support Zone: Establishing or adding to exposure if the stock tests major structural support between $492 and $510.

• Target Horizon: $575–$610 leading into 2027.

💡 Takeaway

AI is no longer just a narrative for Microsoft; it is a full-fledged enterprise operating system. While the market occasionally panics over how much cash MSFT burns building data centers, its unmatched distribution network (30M+ Copilot seats) gives it an ironclad path to enterprise monetization. Expect a volatile October, but use pullbacks to buy a premium compounding machine.

图片 1,共 1 张
Trade Showcase: Trade, Show & Earn Rewards!
N
NewUser_tXvx48

Context

Micron just closed a historic fiscal year 2026, completely rewriting its narrative from a cyclical memory player into a secular AI infrastructure powerhouse. The financials from its recent Q4 report are staggering:

• Exponential Top-Line Growth: Full-year revenue reached $133.19 billion, up 256.3% year-over-year. Q4 revenue alone hit $54.23 billion.

• Explosive Profitability: Full-year net income jumped nearly 900% to $84.97 billion ($74.33 EPS).

• Peak Pricing Power: Driven by data center demands for High-Bandwidth Memory (HBM) and premium DRAM, Q4 gross margins reached an unprecedented 87%.

My Trade

• The Setup: Despite “crushing” earnings and projecting an even stronger fiscal Q1 2027 ($61.5B revenue midpoint), the stock experienced a mild short-term pullback to $1,045.56 due to minor Wall Street anxieties surrounding long-term capital expenditure rises and peak gross margin metrics. Technical indicators reveal that an inverse head-and-shoulders breakout past $1,041 remains valid.

• Action Plan: Buy the Dip. I am accumulating a long position at the current support zone between $1,000 and $1,050.

• Execution Structure:

• Entry Triggers: Build a 70% core position at current prices ($1,045), and save 30% for emergency add-ons if it sweeps liquidity down to the psychological $1,000 floor.

Takeaway

The key takeaway is that the market is still mispricing the length and structural shift of this memory cycle. Traditional memory cycles bust when supply floods the market, but structural physical layout complexities for HBM4/HBM4E mean that newly constructed wafer fabs won’t bring massive supply online until late 2027 or 2028.

Trading at just 14x trailing earnings and a microscopic 6x forward P/E, the denominator (profits) easily supports the high share price. Micron isn’t just a trade; it’s a structural long-term hold for the duration of the physical AI infrastructure buildout.

图片 1,共 1 张
Trade Showcase: Trade, Show & Earn Rewards!
N
NewUser_tXvx48

Context

Broadcom Inc. (AVGO) has firmly established itself as an indispensable powerhouse in the artificial intelligence infrastructure boom. In its latest fiscal third-quarter results for 2026, the company reported explosive 86% year-over-year revenue growth to $29.6 billion, fueled by a 221% surge in AI semiconductor revenue which brought in $16.7 billion. CEO Hock Tan has outlined aggressive long-term projections, targeting $115 billion in AI-related revenue for fiscal 2027 and $230 billion by fiscal 2028.

However, despite these staggering fundamentals, AVGO stock is currently trading around $362.51—nearly 27% below its June 2026 record high of $495. The broader market has heavily penalized Broadcom due to a combination of macro tech sector consolidation, gross margin compression from lower-margin custom hardware mixes, and growing concern over customer concentration. Broadcom relies on just six core hyperscaler custom silicon (XPU) customers—most notably Google and Meta—alongside a complex, headline-making $42 billion custom-chip financing and leasing deal with Anthropic.

My trade

• The Play: Long Equity Accumulation / Bull Put Spreads

• Execution Strategy: Buy AVGO equity shares outright at the current level of $362.51, which places the stock at a highly attractive 19x forward price-to-earnings (P/E) multiple—a steep discount relative to peer giants like NVIDIA (25x) and Marvell (62x).

Takeaway

Broadcom is essentially a “tollbooth” on the global deployment of custom AI accelerators and next-generation networking switches. While critics point to the risks of circular customer financing and high concentration, Broadcom’s asset-light business model allows it to generate exceptionally lucrative free cash flow ($13.66 billion in a single quarter alone). Wall Street’s current average 12-month price target hovers around $424 to $533.

图片 1,共 1 张
Trade Showcase: Trade, Show & Earn Rewards!
N
NewUser_tXvx48

Context

NVIDIA Corporation (NVDA) continues to showcase robust fundamentals, fueled by aggressive corporate actions and an unrelenting surge in global AI computing demand.

• The Numbers: The stock is trading near $229–$234, showing explosive multi-year growth but maintaining a surprisingly normalized P/E ratio around 26x to 29x due to its skyrocketing earnings profile.

• The Catalyst: NVDA recently authorized a massive $150 billion share buyback program. This is the largest repurchase authorization in corporate history, establishing an exceptionally strong valuation floor for the asset.

My trade

The Setup: Looking at the short-to-medium-term technical structure, NVDA has been consolidating inside a structural rectangle formation with a hard floor at $213 to $217 and resistance building near $235.

Action Plan:

- Accumulation Zone: Accumulating shared exposure between $220 and $225 on minor macro pullbacks, aligning perfectly with structural support.

- The Target: Holding a dynamic price target toward $260 for a short-term swing, while keeping a core runner position for the eventual path toward Wall Street’s $300+ targets before the end of the market cycle.

Takeaway

Do not time the top on an unmatched ecosystem.

While the retail market hyper-focuses on the high hardware price tags, they overlook Nvidia’s primary moat: the CUDA software ecosystem and strategic acquisitions like Hugging Face. Investors are not just buying semiconductors; they are buying the global operating system for artificial intelligence. When a company prints over $21 billion in free cash flow in a single quarter and immediately uses it to swallow its own float, betting against the trend is a losing strategy. Treat any macro-driven dip as a prime buying opportunity.

图片 1,共 1 张
Trade Showcase: Trade, Show & Earn Rewards!
N
NewUser_tXvx48

Micron Technology $Micron Tech(MU.US) is experiencing one of the most explosive multi-quarter growth trajectories in semiconductor history, driven by structural shortages in artificial intelligence memory infrastructure.

Context

• Macro Environment: Micron is currently trading at $1,071.41, representing an approximate 240% climb year-to-date from its opening $315 level in January. The broader market is bracing for the company’s crucial Q4 fiscal 2026 earnings release, scheduled to drop after the closing bell today.

• Financial Explosion: Driven by high-bandwidth memory (HBM3e) and surging data center SSD demands, Wall Street consensus targets Q4 revenue at an all-time record $50.75 billion, which is an astronomical leap from just $11.31 billion a year ago. Gross margins are guided at a near-monopolistic 86%.

My trade

• The Setup: Historically, buying the absolute top of a structural memory cycle before capacity expands is highly dangerous. However, shorting outright is suicidal when JP Morgan indicates a massive, multi-billion dollar share buyback program could be announced during today’s call.

• The Strategy: I am executing an Options Long Straddle strategy expiring in two weeks, capturing the implied 6.5% standard deviation move priced by market makers.

Takeaway

• Valuation vs. Momentum: Micron is an incredible operational business trading at a historically tight Forward P/E of ~7.3x. Yet, it remains explicitly anchored to the brutal reality of the global commoditized silicon cycle.

• Risk Management: Never mistake a cyclical peak for a permanent linear runway. Treat Micron as a high-conviction momentum trade, but dynamic hedging (using protective put structures like Burry’s) is mandatory to survive the inevitable capacity cliff once supply catches up to AI demand in 2027.

图片 1,共 1 张
Trade Showcase: Trade, Show & Earn Rewards!
N
NewUser_tXvx48

Context

Apple Inc. (AAPL) has emerged as the top-performing “Magnificent Seven” stock of, driven by an accelerating hardware upgrade cycle and highly resilient services expansion. Following the launch of the iPhone 18 series, early market checks from major firms like Morgan Stanley and J.P. Morgan point to steady consumer demand internationally, with lead times stretching out 3 to 4 weeks for premium Pro models. Financially, the company remains an absolute powerhouse, delivering an EPS of $2.02 on $109.42 billion in revenue during its most recent fiscal quarter, comfortably beating Wall Street consensus projections.

However, this massive multi-month run has pushed Apple’s market capitalization up to $5.0 trillion. This has created a valuation premium, with the stock trading at a trailing price-to-earnings (P/E) multiple of 38.8x. Several fundamental analysts note that the stock screens as modestly overvalued relative to its intrinsic discounted cash flow (DCF) model, which suggests that immediate near-term upside may require exceptionally strong sales momentum to stay justified.

My trade

Buy Zone: $315.00 – $325.00. Accumulate on minor technical pullbacks toward the 50-day moving average or psychological support boundaries.

Price Targets: $362.00 (Short-Term / 6-Month Target) | $395.00 – $400.00 (Long-Term / 12-Month Target.

Stop Loss: $298.00. A decisive daily close below this dynamic horizontal baseline invalidates the recent structural breakout trend.

Takeaway

Apple presents a classic blue-chip dilemma: immaculate execution and robust institutional support clashing directly against a highly extended valuation premium. While momentum-driven traders may encounter minor near-term consolidation around its current record highs, the underlying business remains heavily protected by its vast installed device ecosystem, high-margin recurring subscription revenue, and an aggressive multi-billion-dollar share buyback framework.

图片 1,共 1 张
Trade Showcase: Trade, Show & Earn Rewards!
N
NewUser_tXvx48

Context

SanDisk Corporation (SNDK) has undergone a massive structural shift since completing its official separation from Western Digital. Now trading as an independent pure-play AI memory and high-performance NAND storage provider, the stock experienced a meteoritic +1,600% run over the past year before enduring a severe 35% drawdown from its summer high of $2,354.39.

Despite the technical cooling off, SanDisk’s underlying business metrics are powerhouse level: the company reported fiscal Q4 revenue of $8.97 billion (a 372% year-over-year surge), an industry-leading non-GAAP gross margin of 84.6%, and secured an astronomical $93.9 billion backlog via multi-year contracts with 8 core hyperscalers (including Meta). Essentially, memory is shedding its historical “cyclical commodity” discount and re-rating as critical AI enterprise infrastructure.

My trade

Given the massive gap between the company’s stellar fundamentals and the recent technically-driven chart drawdown, I executed a Buy the Dip strategy:

Entry Point: Will load on more shares heavily as the stock bottom out near the $1,500 – $1,550 support band, capitalizing on the panic sell-off triggered by temporary sector-wide macro rotations.

Takeaway

SanDisk is no longer a legacy flash drive producer; it is now fully entrenched as a structural AI infrastructure engine. The massive multi-year contracts provide predictable revenue visibility that is practically unheard of in traditional cyclical semiconductor history. With management holding a robust, debt-free balance sheet and ample runway for extensive share buybacks, the fundamental bull case remains incredibly strong.

Traders should ignore the short-term noise and use steep drawdowns to accumulate exposure, keeping a close eye on whether upcoming guidance can continuously sustain these historic 80%+ gross margins.

图片 1,共 1 张
Trade Showcase: Trade, Show & Earn Rewards!
N
NewUser_tXvx48

Uber Technologies Inc. $Uber Tech(UBER.US) is currently trading at $69.42, floating near its 52-week low of $65.41 and roughly 30% below its all-time high of $100.10. The market is in an intense debate regarding Uber’s long-term viability as an autonomous vehicle (AV) ride marketplace. Fears that vertically integrated robotaxi networks (like Alphabet’s Waymo or Tesla’s upcoming network) will bypass Uber entirely have heavily weighed on the stock.

However, the underlying financial fundamentals tell a completely different story. Wall Street analysts remain highly bullish, with firms like Evercore ISI predicting the stock could double based on the following catalyst framework:

The Aggregator Flywheel: Uber continues to act as the primary demand and orchestration layer. Management is leveraging this scale through major enterprise wins, such as the national expansion of Costco delivery on Uber Eats.

High-Margin Ecosystem: The Uber One loyalty framework has achieved over 50 million members, capturing half of all gross bookings.

My trade

Hypothesis: The market has irrationally priced in a premature “AV death sentence” for Uber. In reality, AV hardware developers will still require Uber’s immense 200M+ global user network to maximize capacity utilization. The stock is coiled for a sharp valuation rerating as imminent share buybacks resume and technical support holds.

Strategy: Scale into a Core Long Position utilizing structural support levels. I will accumulate shares between $66.00 – $69.50 (buying near the structural 52-week support baseline).

Takeaway

The central takeaway is that network density and consumer demand aggregation trump proprietary hardware in platform economics.While the market obsesses over who owns the robotaxi technology, Uber owns the customer relationship. Autonomous fleets will need a marketplace to source rides, and building a global demand pool from scratch is an extraordinarily capital-intensive endeavor.

图片 1,共 1 张
Trade Showcase: Trade, Show & Earn Rewards!
N
NewUser_tXvx48

Amazon’s stock remains a Strong Buy consensus choice on Wall Street, currently trading around $253.56 to $258.45 following its recent all-time high of $287.20 hit in August 2026. Driven by an annualized revenue run rate surpassing $775 billion and record operating profit margins reaching 12.68%, the company has successfully reversed declining worker productivity through robust AI implementations. Despite massive projected 2026 capital expenditures of $220 billion, institutional options flow signals a healthy, calculated optimism for the company’s near-term trajectory.

Context

Financial Performance & Valuation: Amazon’s core segments (AWS, e-commerce, and high-margin advertising) are firing on all cylinders. Wall Street analysts maintain an average 12-month target price of $328.22 to $333.89, indicating an estimated 31% upside. Morningstar pegs its fair value at $260, rendering current trading levels moderately undervalued.

The AWS & AI Growth Engine: AWS continues to dictate Amazon’s valuation premium. Cloud segment revenue has accelerated past 20% YoY growth ($33B+ per quarter) with operating margins scaling between 35% and 37%. Demand for proprietary Frontier AI models and cloud computing capacity vastly outstrips current supply.

My trade

Strategy: Bull Call

Execution:Buy $320 Call Options (320C) Sell $370 Call Options (370C)

Expiration Horizon: August 2026

Rationale: Rather than betting on an aggressive, volatile breakout, this defined-risk vertical spread leverages institutional “smart money” positioning. It capitalizes on a steady, moderate upside toward the $328+ analyst price targets while mitigating the premium decay risks associated with massive capital expenditures ($220B) entering the back half of the year.

Takeaway

Amazon has evolved from an e-commerce giant into an efficient infrastructure and AI powerhouse. While retail handles the consumer volume, AWS and automated AI workflows provide the true profitability engine.

图片 1,共 1 张
Trade Showcase: Trade, Show & Earn Rewards!
N
NewUser_tXvx48

Context

Meta Platforms Inc. (META) recently experienced intense volatility. After tumbling to near its 52-week low ($529) following a Q2 earnings miss caused by massive AI capital expenditures and legal charges, the stock experienced an aggressive institutional breakout.The primary catalyst for this shift was the successful launch of its consumer AI agent, Muse. Muse quickly reached the top spot on the Apple App Store, accumulating millions of downloads and positioning Meta as a frontrunner in agentic e-commerce. However, during the recent Meta Connect 2026 keynote on September 23–24, the stock stalled sharply at the $750 resistance level. Despite the rollout of new $1,299 VR glasses and an expanded smart-wearable lineup, investors are taking profits, wary of Meta’s heavy 2026 CapEx budget of $130B to $145B.

My trade

The Execution: Instead of chasing the stock at the $740–$750 peak, I am utilizing a buy-the-dip strategy. I have placed limit orders to accumulate shares if the price pulls back to retest the psychological $700 support floor.

Risk Mitigation: Meta’s heavy infrastructure spending has temporarily crushed its short-term free cash flow margins. To protect capital from high-beta volatility, a stop-loss is set firmly at $665, just below the structural breakout line. If the stock breaks upward past $750 instead, I will wait for a sustained weekly close above resistance before adding exposure.

Takeaway

Product cycles create excellent entry points for patient value-growth investors. While the street remains heavily divided over Meta’s “spending problem” and near-term margin compression, the underlying fundamentals are healthy. Trading at a reasonable forward P/E of roughly 27x relative to its peer group, Meta is successfully converting abstract AI spending into concrete consumer utilities like Muse. Expect short-term chop over the next few weeks, but use macro pullbacks to build a structural position before the Q3 earnings cycle in late October.

图片 1,共 1 张
Trade Showcase: Trade, Show & Earn Rewards!
N
NewUser_tXvx48

Broadcom Inc. $Broadcom(AVGO.US) is currently trading at $364.54, establishing a $1.74 trillion market cap and pricing the tech heavyweight at a trailing P/E ratio of 46.54. Despite staggering structural growth within its Artificial Intelligence segments, the stock has spent much of 2026 consolidating in a sideways trading pattern.

Context

Broadcom’s core financial numbers for the third quarter of fiscal year 2026 were fundamentally remarkable. Consolidated revenue skyrocketed 86% year-over-year to $29.6 billion, aggressively fueled by a 221% explosion in AI semiconductor revenue, which clocked in at $16.7 billion. CEO Hock Tan confidently raised the full-year 2026 AI revenue target to $58 billion and provided massive multi-year visibility, forecasting that AI sales will double to $115 billion in 2027 and double again to $230 billion by 2028.

However, the broader market’s muted reaction highlights a steep disconnect between forward execution and investor expectations:

The “Beat and Realign” Trap: Earlier in June 2026, a slight contraction in traditional infrastructure software margins and conservative guidance triggered a massive 15% single-day selloff. Investors have set an exceptionally high bar for AI infrastructure plays.

My trade

Given that AVGO’s long-term AI structural moat remains entirely intact while short-term supply chain constraints have trapped the stock in a defined sideways trading range (firm support near $357 and persistent resistance near $426), a high-conviction Bull Put Credit Spread minimizes absolute capital risk while capitalizing on elevated implied volatility premium.

Takeaway

Broadcom is uniquely positioned as a fundamental Toll Collector of the custom AI silicon era. Unlike competitors exposed purely to frontier large language model training cycles, Broadcom’s customized XPU/TPU architectures and high-end Tomahawk networking switches capitalize on aggregate token consumption and inference scaling.

图片 1,共 1 张
Trade Showcase: Trade, Show & Earn Rewards!