📢 𝐉𝐔𝐒𝐓 𝐈𝐍: $Qualcomm(QCOM.US) Qualcomm Unveils Snapdragon Reality Elite Platform for XR Devices
👉 𝐊𝐞𝐲 𝐇𝐢𝐠𝐡𝐥𝐢𝐠𝐡𝐭𝐬:➤ Qualcomm introduced the 𝐒𝐧𝐚𝐩𝐝𝐫𝐚𝐠𝐨𝐧 𝐑𝐞𝐚𝐥𝐢𝐭𝐲 𝐄𝐥𝐢𝐭𝐞 Platform for XR headsets and glasses.➤ Platform supports both 𝐯𝐢𝐝𝐞𝐨 𝐬𝐞𝐞-𝐭𝐡𝐫𝐨𝐮𝐠𝐡 and 𝐨𝐩𝐭𝐢𝐜𝐚𝐥 𝐬𝐞𝐞-𝐭𝐡𝐫𝐨𝐮𝐠𝐡 devices.➤ Chip delivers up to 𝟒𝟖 𝐓𝐎𝐏𝐒 of on-device AI performance.➤ Qualcomm claims up to 𝟔𝟎% higher GPU and 𝟑𝟎% higher CPU performance.➤ NPU performance improves by up to 𝟏𝟔𝟎% versus the prior generation.➤ Platform supports visuals up to 𝟒.𝟒𝐊 𝐩𝐞𝐫 𝐞𝐲𝐞 at 𝟗𝟎𝐅𝐏𝐒.➤ Delivers up to 𝟐𝟎% longer battery life and runs 𝟏𝟐°C cooler.➤ Qualcomm says more than 𝟔𝟎 𝐦𝐢𝐥𝐥𝐢𝐨𝐧 XR devices are already in market.➤ 𝐗𝐑𝐄𝐀𝐋 and 𝐏𝐥𝐚𝐲 𝐟𝐨𝐫 𝐃𝐫𝐞𝐚𝐦 are among first adopters.➤ Platform supports 𝐀𝐧𝐝𝐫𝐨𝐢𝐝 𝐗𝐑 and future multi-vendor XR products.Dave & Buster ENT
PLAY----
Share your thoughts
Write something you'd like to share with our community...
- F
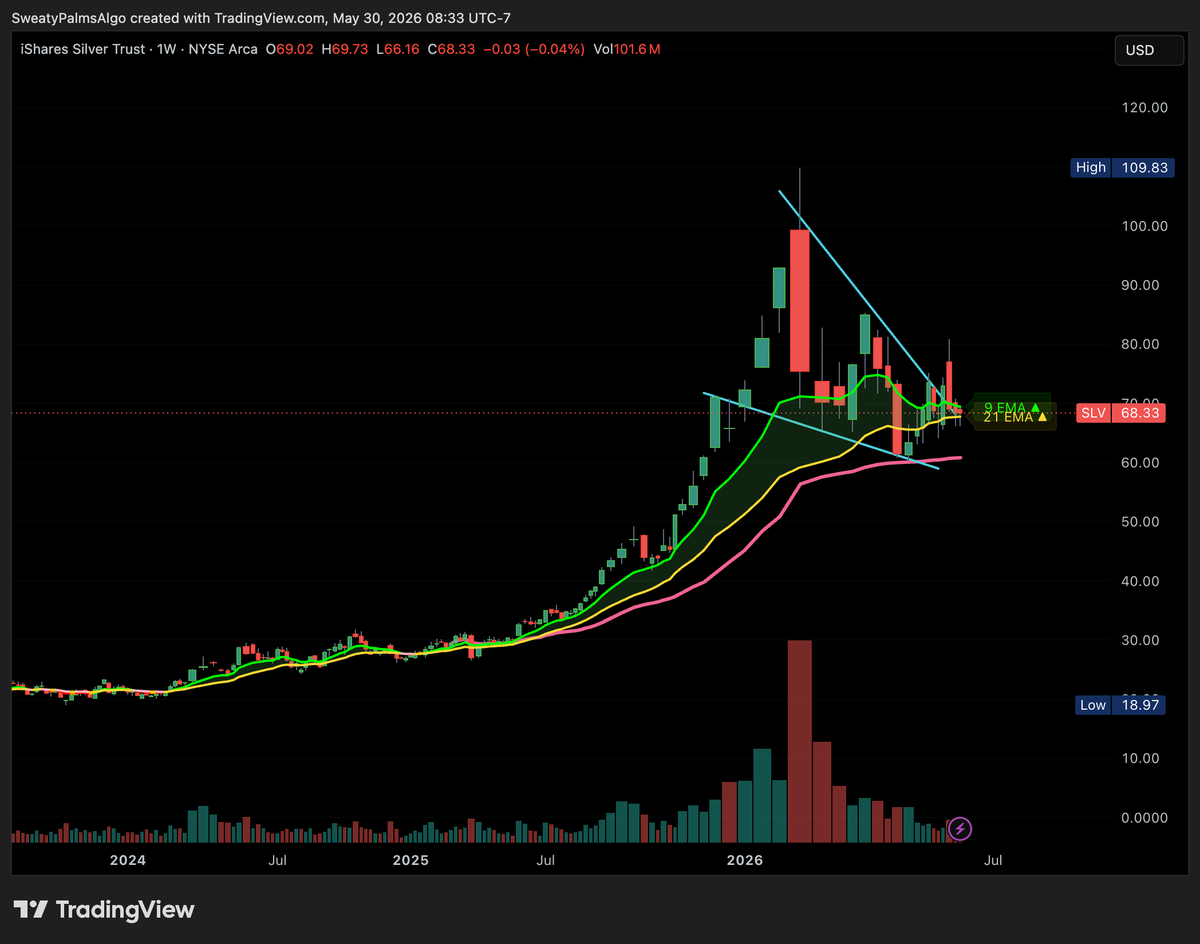
Last couple of weeks I am asked multiple times on my thesis on $GLD & $SLV So here are my thoughts..
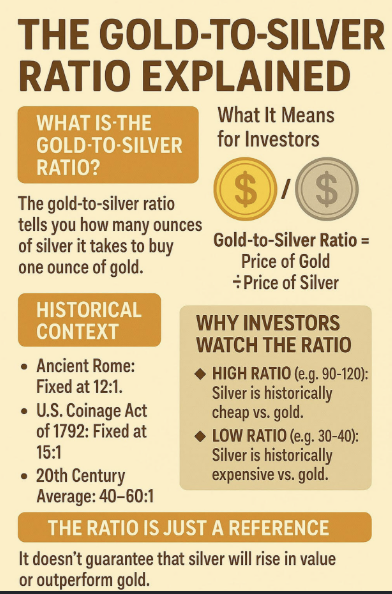
Both charts took a heavy hit after their recent peaks. The technical structure still tells me this is a healthy consolidation phase where the price is building a base and digesting those previous vertical moves.I spoke about this before. Central banks are accumulating physical gold at record levels. That kind of institutional buying creates a massive floor under the price which is what we see on the technicals as well.Silver has an entirely separate and more aggressive catalyst. We are seeing a multi year supply deficit driven by industrial demand from solar, EVs, and data centers(AI play). The gold to silver ratio recently compressed to the 55 level. This confirms silver is being bid as a hard industrial asset.The fundamentals and the technicals are perfectly aligned for a continuation higher IMHO. The current price action is just a base building phase before the next leg up.I will not be surprised if $GLD & $LSV go back above ATH's. It's a matter of when, not IF.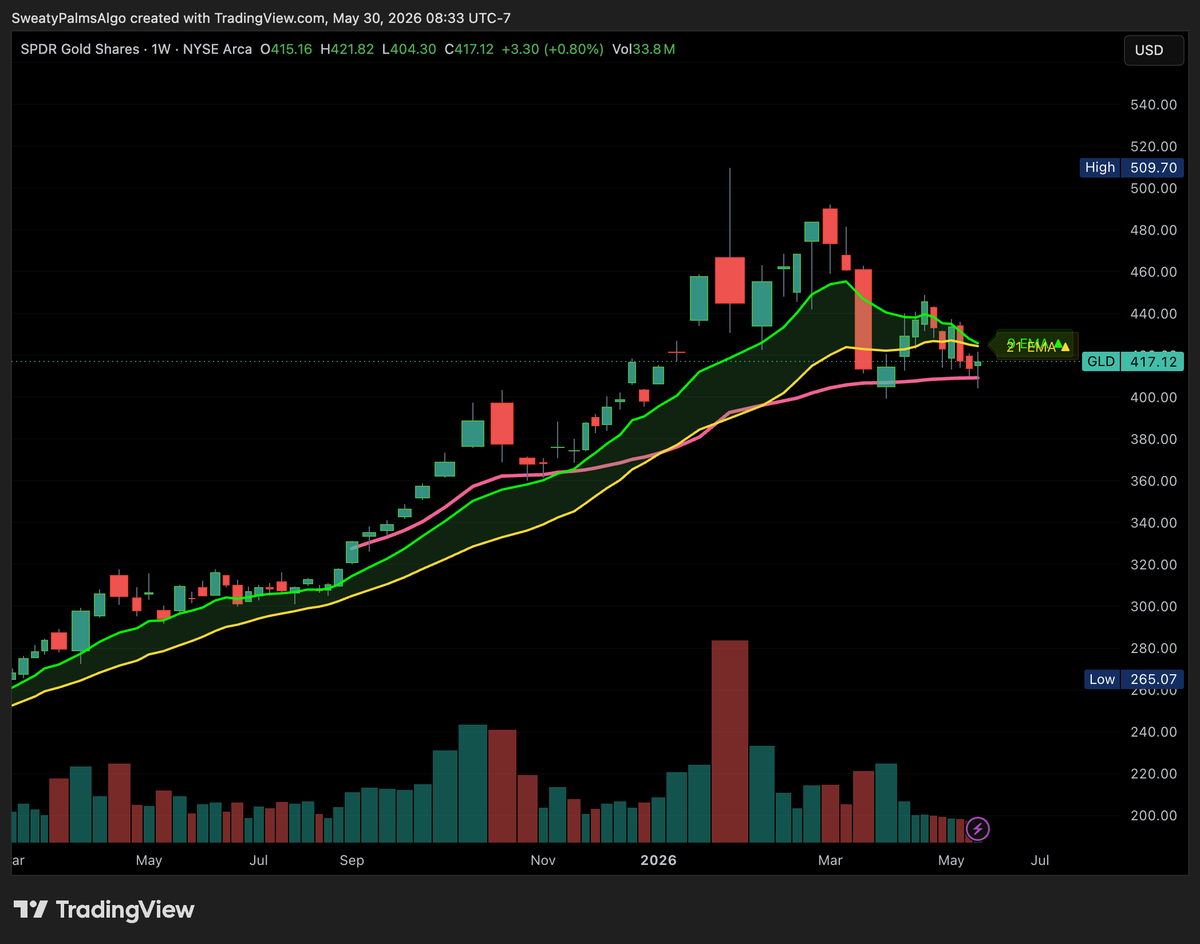
- D

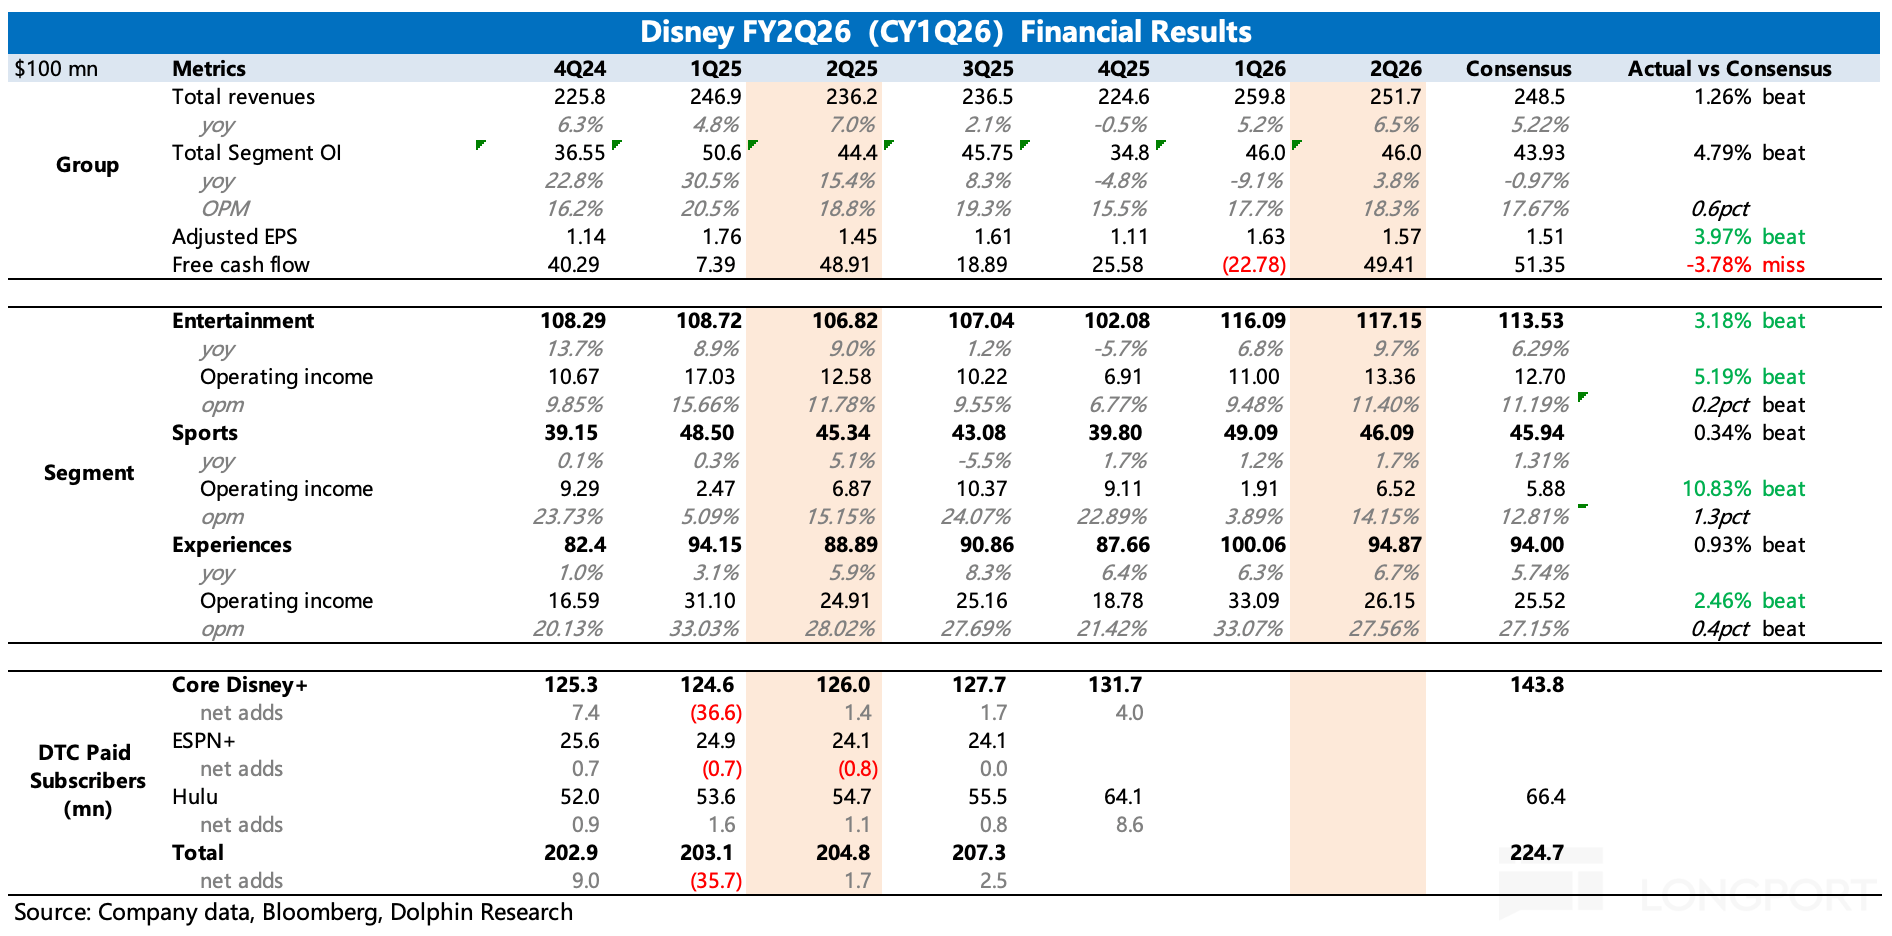
DIS (Trans): 'One Disney' strategy — invest and streamline in tandem
Below is Dolphin Research's Trans of $Disney(DIS.US) FY26Q2 earnings call. For our earnings analysis, see 'Disney: A solid debut by the new chief, resilience from a century-old brand'.
I. Core takeaways. 1) Shareholder returns and EPS guide: the company maintains FY26 Adj. EPS growth of 12% and expects double-digit Adj. EPS growth in FY27, both ex-53rd week. 2) Overall results: Q2 revenue grew 7% YoY, and total segment OP rose 4% YoY, both ahead of prior guidance... DisneyConference Minutes
 - D

Watching out for silver
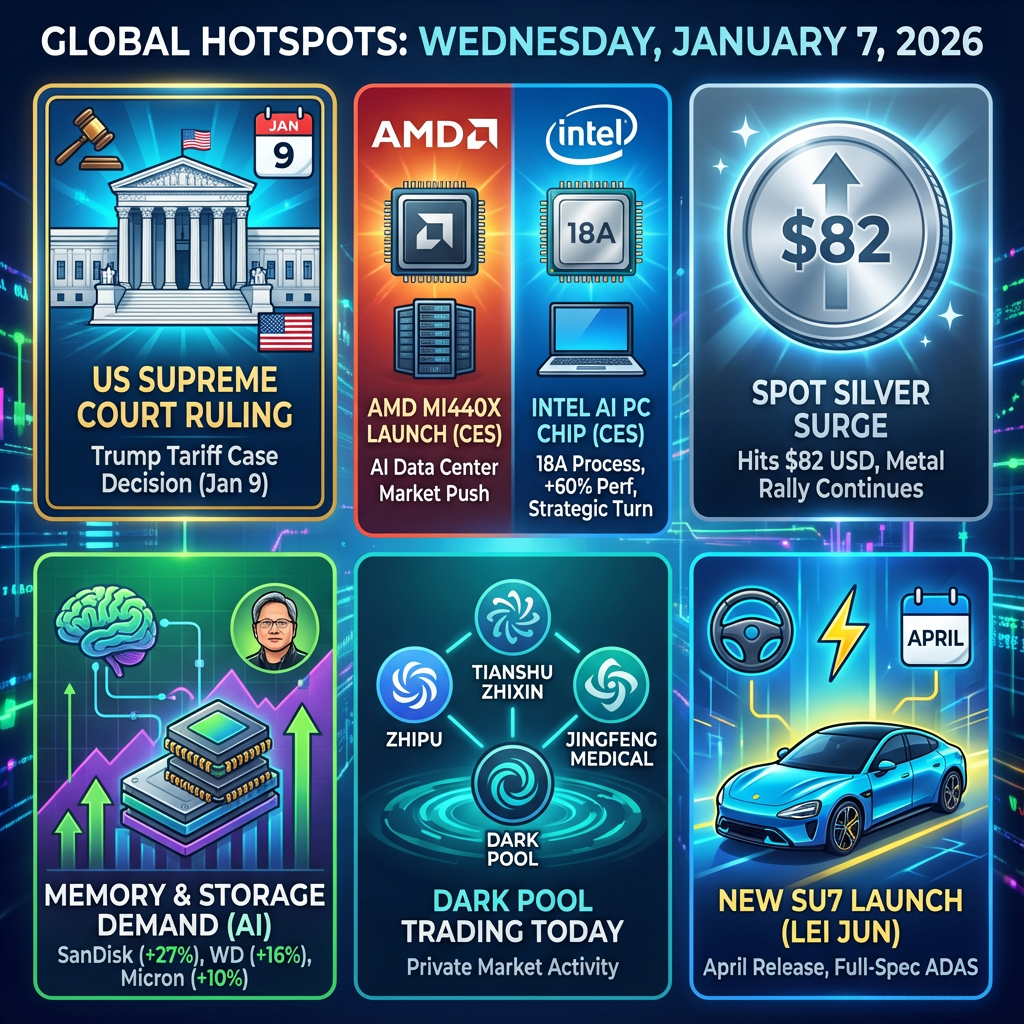
Featured☕ Your Wednesday US Market “Kopi Talk”: Chips, Metals & Court Dates
Another Wednesday, another set of movers and shakers across the pond. Here’s what’s heating up in U.S. equities and global markets today — perfect for your watchlist and our community’s next debate 👇
- B
Bought SanDisk calls last week. Best decision ever!
Featured☕ Your Wednesday US Market “Kopi Talk”: Chips, Metals & Court Dates
Another Wednesday, another set of movers and shakers across the pond. Here’s what’s heating up in U.S. equities and global markets today — perfect for your watchlist and our community’s next debate 👇
- K
The broader market is rallying everywhere, but this cryptocurrency play is just not cutting it!$BitMine Immersion Tech(BMNR.US)
- D
XPeng wins Guangzhou L3 road test permit; BABA's Tongyi Wanxiang 2.6 adds role-play capability | Daily News Recap
1216 | Dolphin Research Focus: 🐬 Macros/Industry. The U.S. Bureau of Labor Statistics will release on Tue a closely watched 'combined' Oct–Nov nonfarm payrolls report. Street expects -10k in Oct and +50k to +130k in Nov, with the unemployment rate rising to 4.4%–4.5%, while Gov. payrolls will be weighed by deferred exits under delayed separation plans across Oct–Nov.
🐬 Single stocks. 1) $Alibaba(BABA.US) rolled out the Wanxiang 2.6 model suite... Today’s Key News Recap
 - D
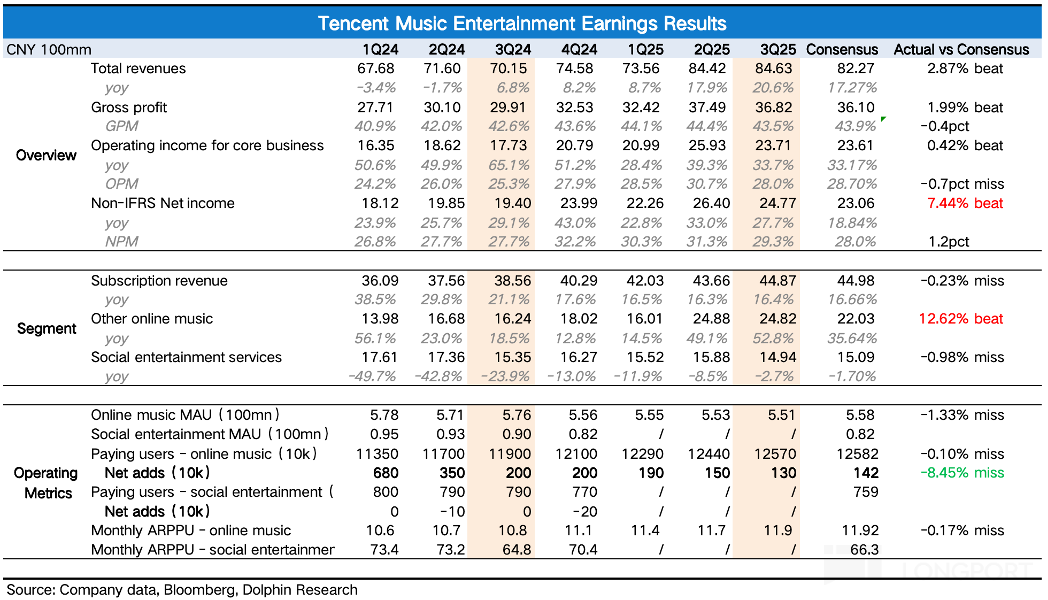
Tencent Music (Minutes): Subscription growth slightly slowed, short-term investments impact profitability
The following are the minutes of Tencent Music's 3Q25 earnings conference call organized by Dolphin Research. For financial report interpretation, please refer to "With ByteDance's Efforts, Can Tencent Music Still Be 'Small and Beautiful'?" 1. Review of Core Financial Information: 1. Tencent Music Entertainment Group (TME) reported a 21% year-on-year increase in total revenue for the third quarter of 2025, reaching RMB 8.5 billion, marking the highest growth rate since the first quarter of 2021. This was driven by the continued growth of the music subscription business, strong performance in offline concerts, advertising services, and sales of artist-related merchandise. 2. Online music revenue increased by 27% year-on-year to RMB 7 billion...
 TMEConference Minutes
 - D
Tencent Music 3Q25 Quick Interpretation: The third-quarter report overall exceeded expectations, especially with the partial realization of the second growth curve story. However, the flaw is that the market's concerns about intensified competition before the earnings report have not been disproven.
It is recommended to pay attention to the management's discussion on ByteDance's recent actions and the company's countermeasures during the conference call.
Specifically:
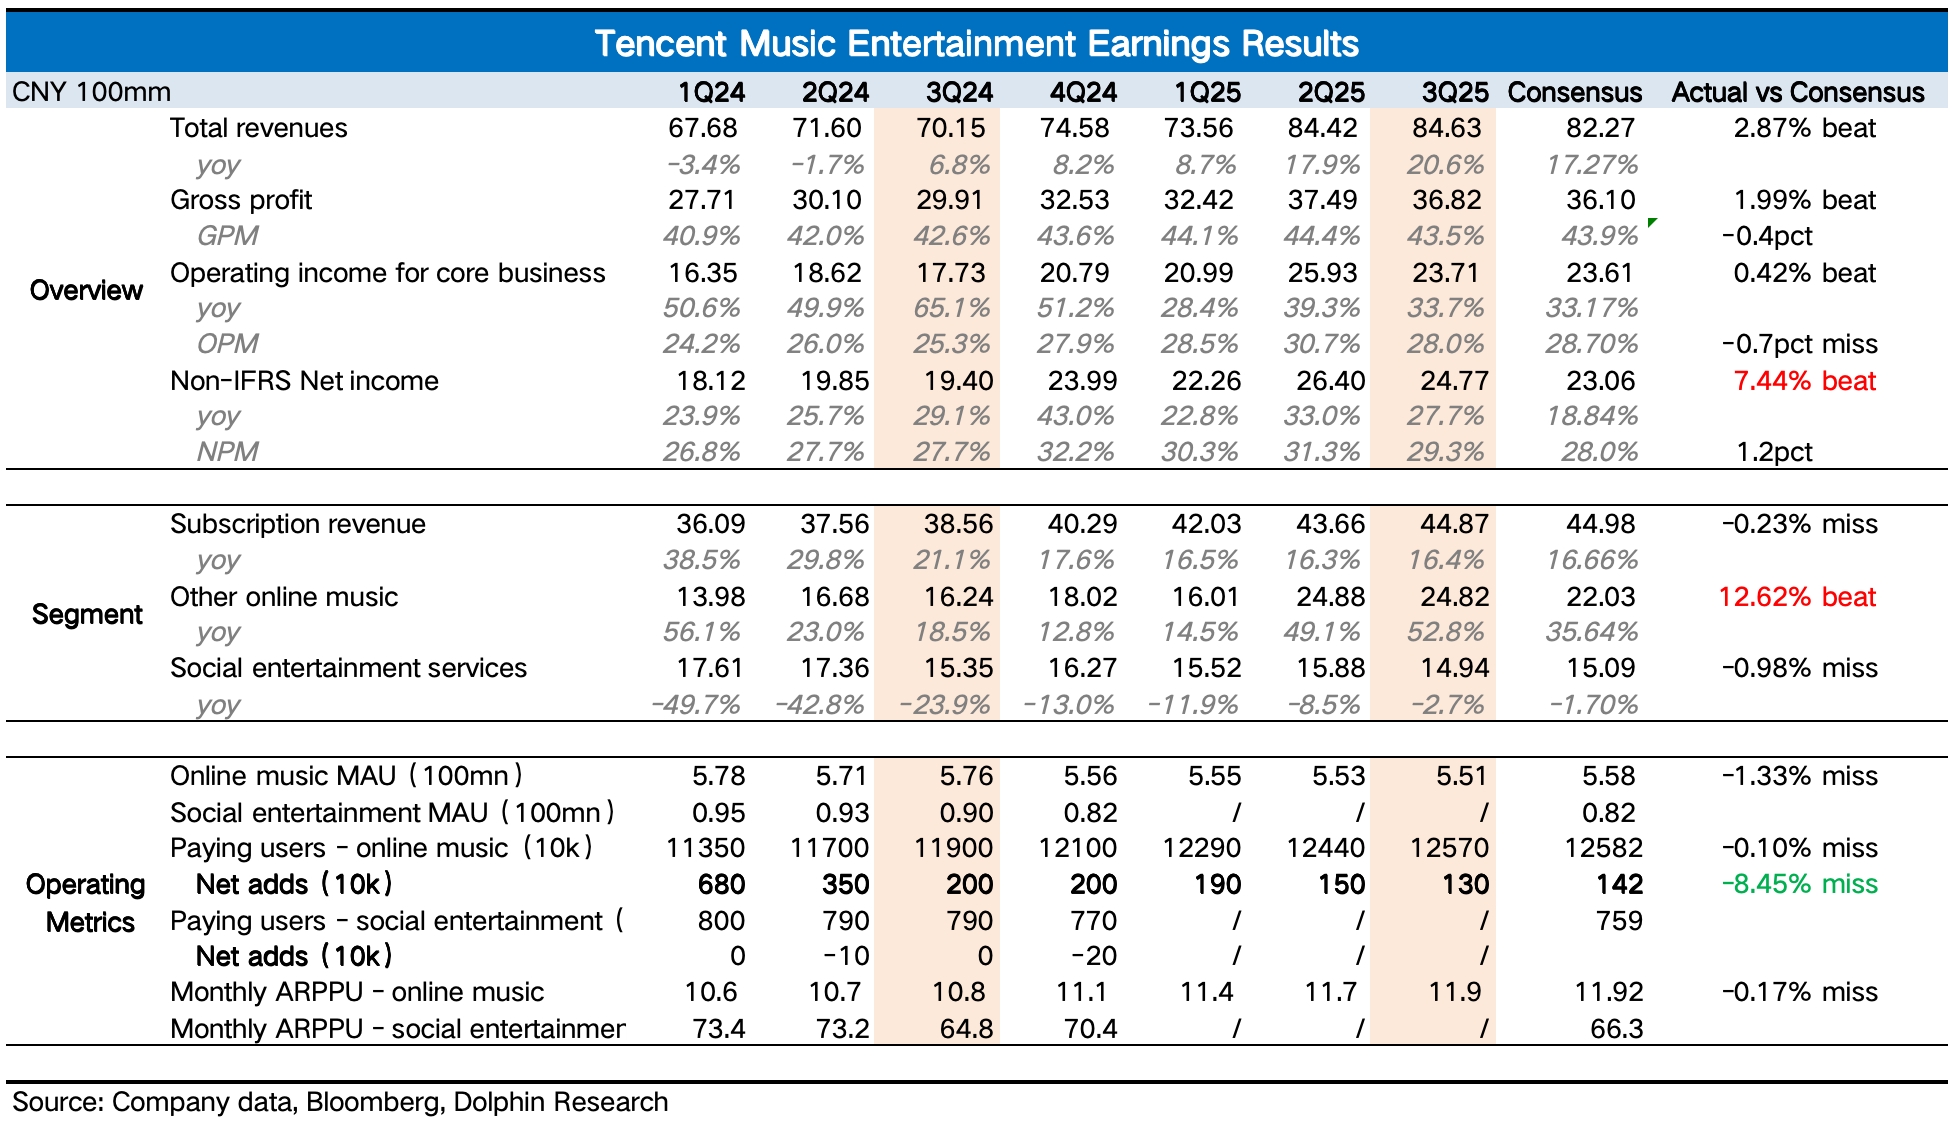
1. Overall: Both revenue and profit beat expectations, primarily driven by the accelerated growth of other music revenue.
2. Core Subscription: Revenue grew by 16%, which, although in line with expectations, shows a trend shift from user growth to ARPPU (Average Revenue Per Paying User) growth (increased penetration of SVIP). The net increase in subscriptions was 1.3 million, continuing to decline quarter-on-quarter. This growth logic works in a stable competitive environment, but if competition intensifies, the ARPPU growth may struggle to sustain.
3. Other Music Services: This segment includes advertising, digital album sales, copyright sublicensing, and value-added services. It saw an unexpected acceleration in growth by 53% in the third quarter, reaching 2.5 billion, thanks to the resumption of offline concerts. Fan economy is one of Tencent Music's three major future growth points (the other two being SVIP and long-form audio). Specific products and services include concert tickets and merchandise, physical albums, and artist-fan interactions (rewards, Bubble, etc.).
4. Social Entertainment: Continues to recover. Third-quarter revenue declined by 3%, with a continued slowdown quarter-on-quarter, and is expected to gradually return to positive growth. However, this business segment is subject to regulatory and industry downturn trends and is not a future focus. The main goal is to maintain stability, but overall gross margin can be improved by reducing revenue sharing.
5. Rising Expenses: After three years of restrained operating expenses, this quarter finally saw an increase. However, overall growth remains in the low range, with an 8% year-on-year increase. In absolute terms, the increase is mainly due to administrative expenses (including R&D).
Dolphin Research believes that the increase in expenses indicates Tencent's strong desire for the second growth curve, reflected in the spending on recruitment.
Although the operating profit of the core main business still saw a high year-on-year growth of 34%, the profit margin did not continue to improve but declined by 2 percentage points quarter-on-quarter. $Tencent Music(TME.US) $TME-SW(01698.HK)
- D
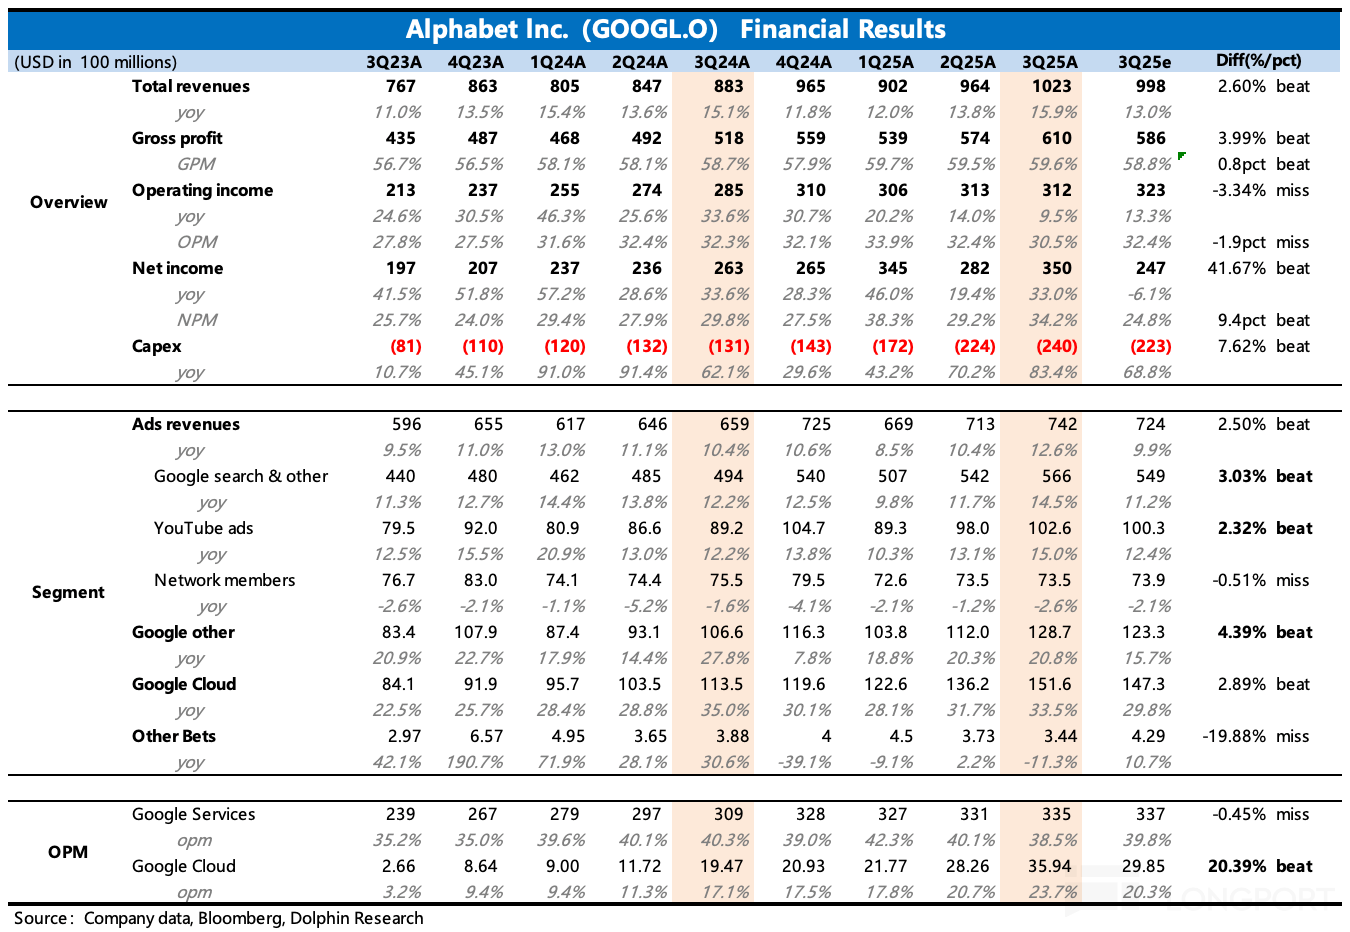
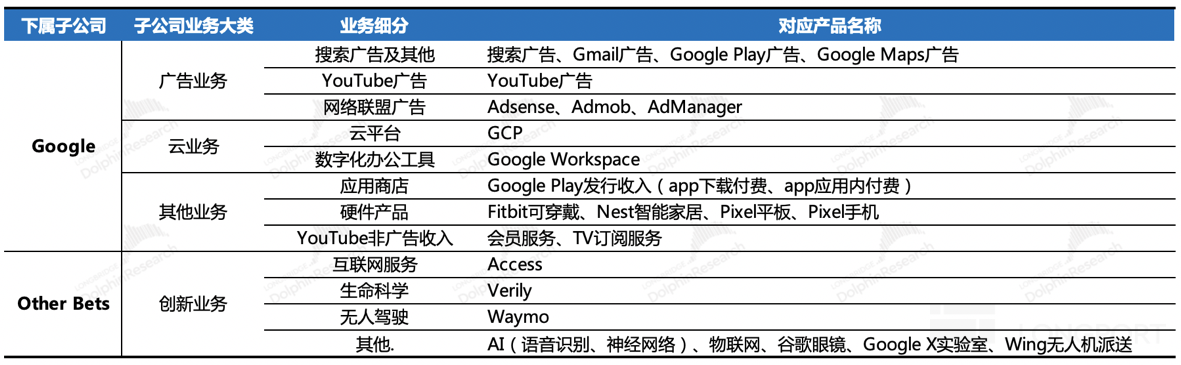
Google's Dramatic Turnaround: From AI 'Sacrifice' to AI 'Trendsetter'
After the market closed on October 29th, Eastern Time, $Alphabet(GOOGL.US) $Alphabet - C(GOOG.US) parent company Alphabet released its Q3 2025 financial report. After two months of revaluation under the logic of full-stack AI, with limited room for direct recovery and the market urgently needing further reasons to rise, Google delivered an impressive performance to continue its revaluation path. Specifically, the core information is as follows: 1. Explosive advertising performance: In the third quarter, YouTube and search ads both grew by 15%, exceeding market expectations...

 +20GoogleFinancial Analysis
 - D
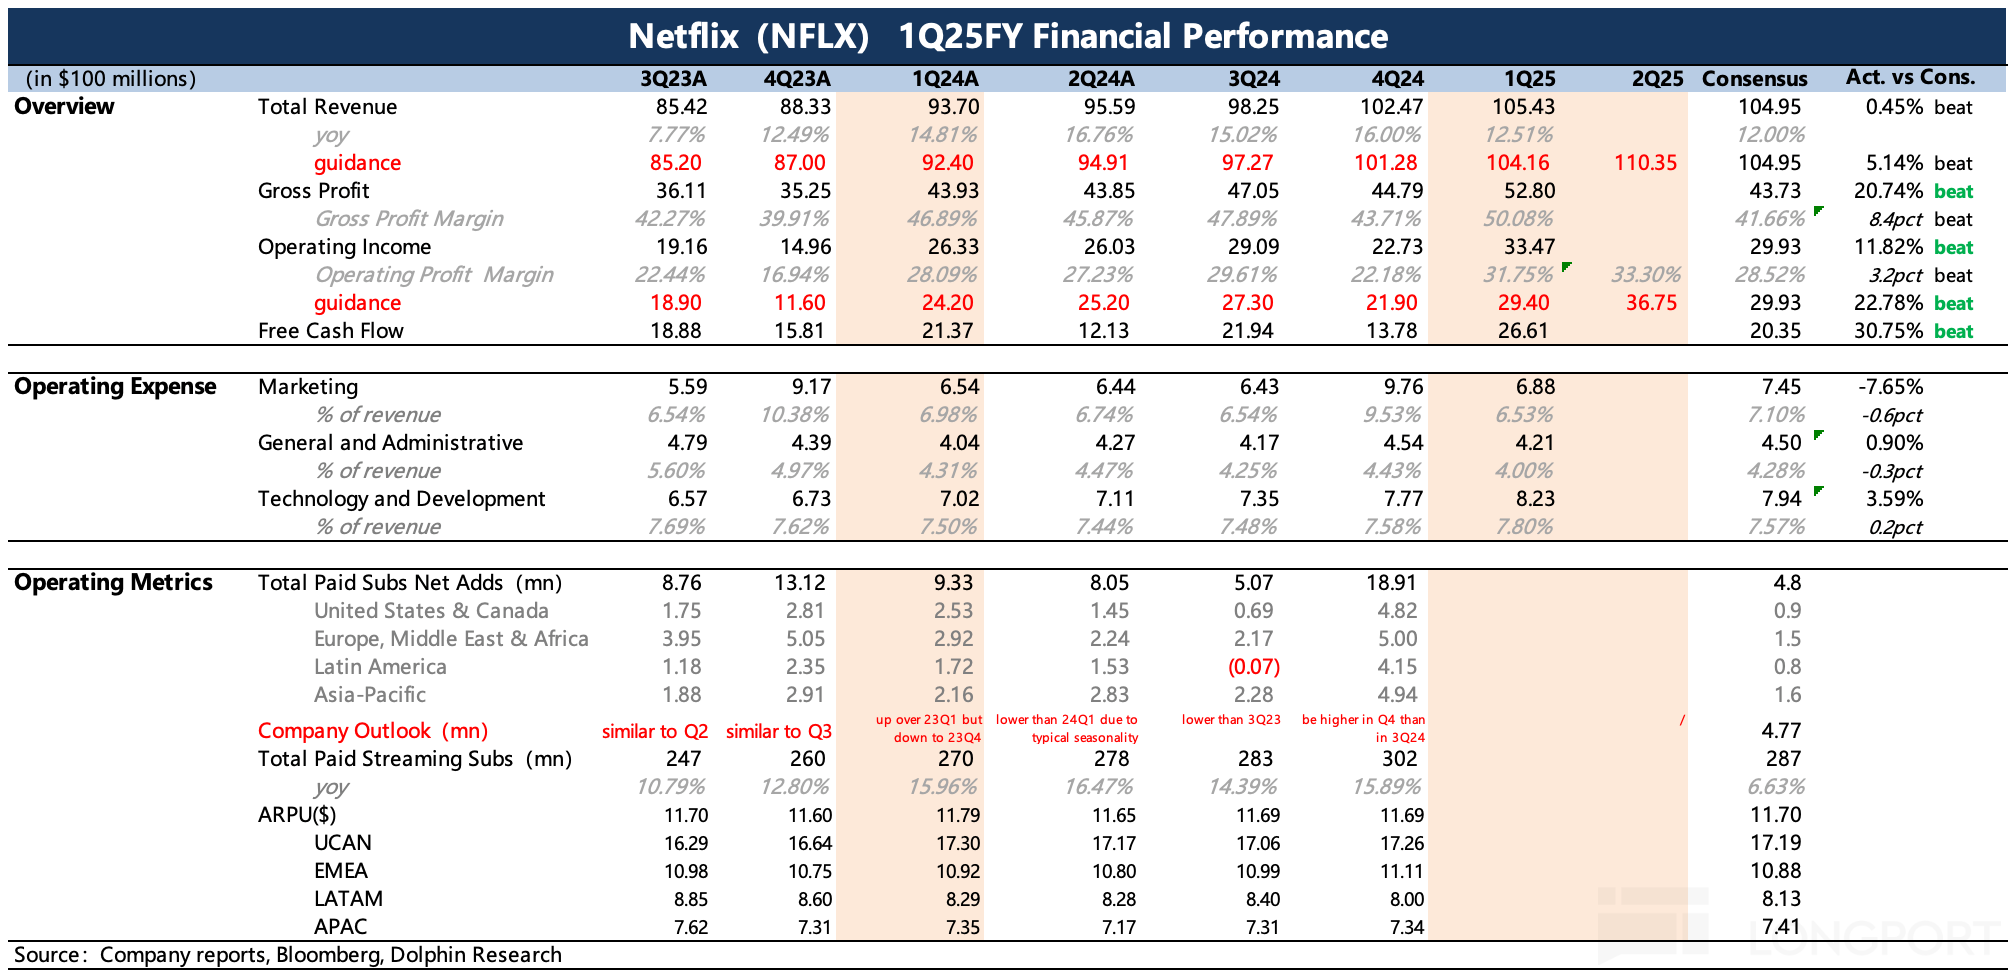
Netflix (Minutes): Entertainment content usually shows resilience during economic downturns.
Below is the earnings call $Netflix(NFLX.US) FY25 Q1 Minutes. For earnings interpretation, please refer to《Netflix: A "Golden Safe Haven" Amid Tariff Turbulence?》I. Review of Key Earnings Information1. Profits significantly exceeded expectationsThe main surprise was in gross margin. In addition to the continued popularity of hit shows, Dolphin Research believes it is related to price increases in multiple regions and the advancement of high-margin advertising. Management's guidance for Q2 profit margins is even higher, with operating margins rising to 33% (QoQ +1.5pct), but full-year operating margin guidance remains at 29% for now...
 NetflixFinancial Analysis