
Memory Rally: How Big Is the AI Storage Supercycle?

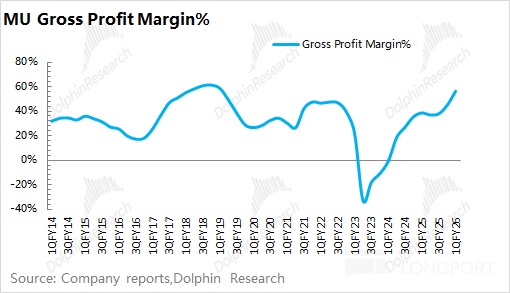
Driven by AI demand, the memory cycle that began with HBM has broadened into traditional storage, kicking off a full upcycle. Using MU as an example, sustained price hikes across memory products have lifted the company’s GPM to a cyclical high.MU guided next-quarter GPM to 66–68%, a record, implying this cycle is stronger than past upswings.
Price increases reflect supply-demand in the memory market. This round’s shortfall is primarily driven by AI server demand and related workloads.With the upcycle now consensus, Dolphin Research focuses on three questions:
1) What roles do the various storage tiers play in AI servers, and what bottlenecks are emerging in AI storage?2) How do the Big Three view HBM demand, and is there a supply-demand gap?
3) How will the AI surge spill over to legacy storage, and can supply keep pace?
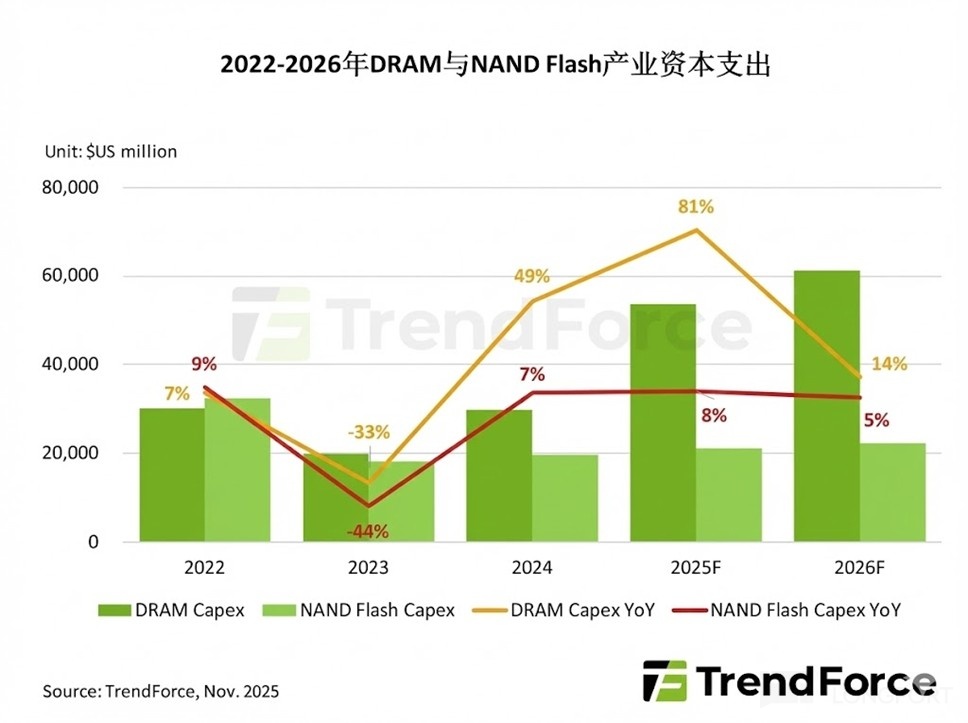
The AI wave is reshaping the industry, pulling HBM, DRAM, NAND and HDD into a broad-based upcycle.From a supply-demand lens: on the demand side, AI workloads are shifting from training to inference, creating differentiated needs for low latency, large capacity, and high bandwidth.On the supply side, capex has tilted to higher-value HBM/DRAM, causing structural tightness and pushing prices higher.
This piece first addresses questions 1 and 2. Dolphin Research will discuss impacts on legacy storage in the next article.
The core contradiction in AI data centers is the ‘memory wall’: compute scales far faster than data movement, leaving GPUs idle up to 99% of the time.In the near term, HBM moves to 16-Hi stacks (bandwidth to 16–32TB/s) while 3D-stacked SRAM reaches production (latency near 2ns), offering a complementary fix.In the mid-to-long term, compute-in-memory architectures will be needed to eliminate the data shuttling bottleneck.
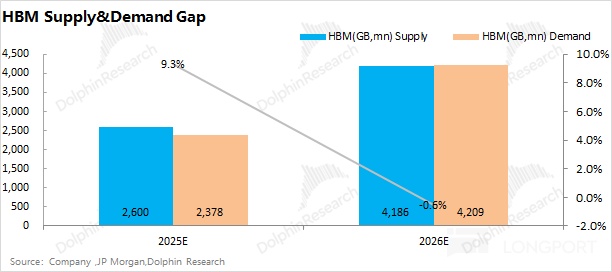
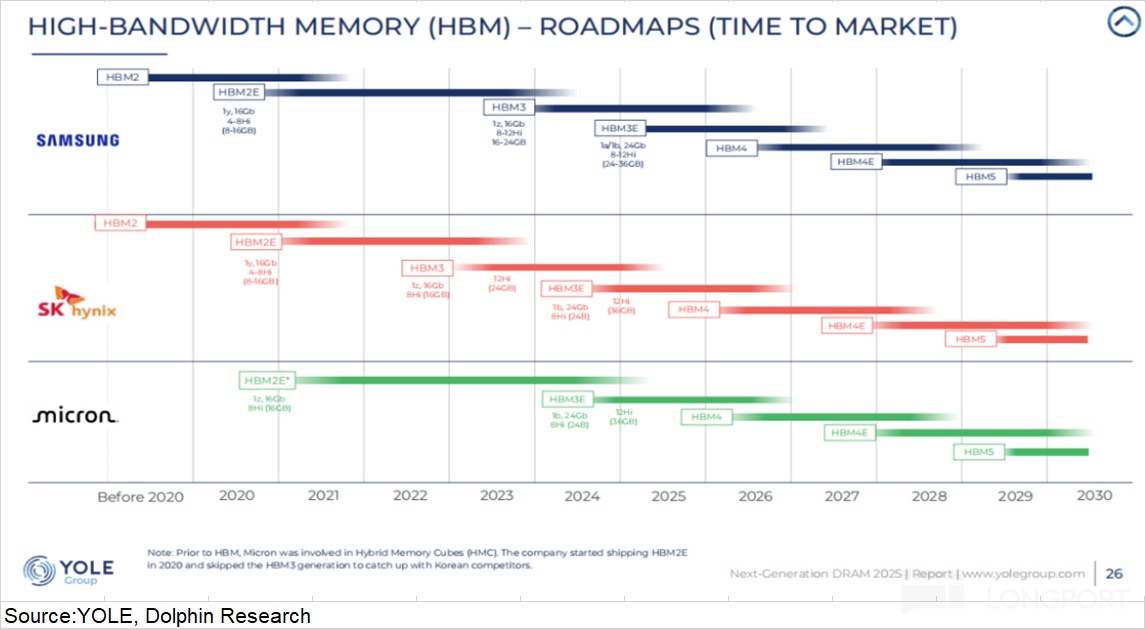
Given the strong AI storage spend, HBM remains the Big Three’s top focus, with HBM4 slated for volume in 2026. With Samsung, SK hynix, and MU prioritizing HBM capex, HBM supply could grow 60%+ in 2026.HBM demand, constrained by AI chip and CoWoS capacity, could reach ~4.2bn GB.The HBM market should remain in tight balance.
The sections below detail the roles across the storage hierarchy, the roadmap to break the ‘memory wall’, and a panoramic view of HBM supply-demand.A follow-up will cover legacy storage, clarifying how AI demand ignites a supercycle.
Below is Dolphin Research’s deep dive on the AI storage cycle and the HBM market.Details follow.
I. What storage supercycle is AI bringing?
1.1 The role of AI storage inside servers:
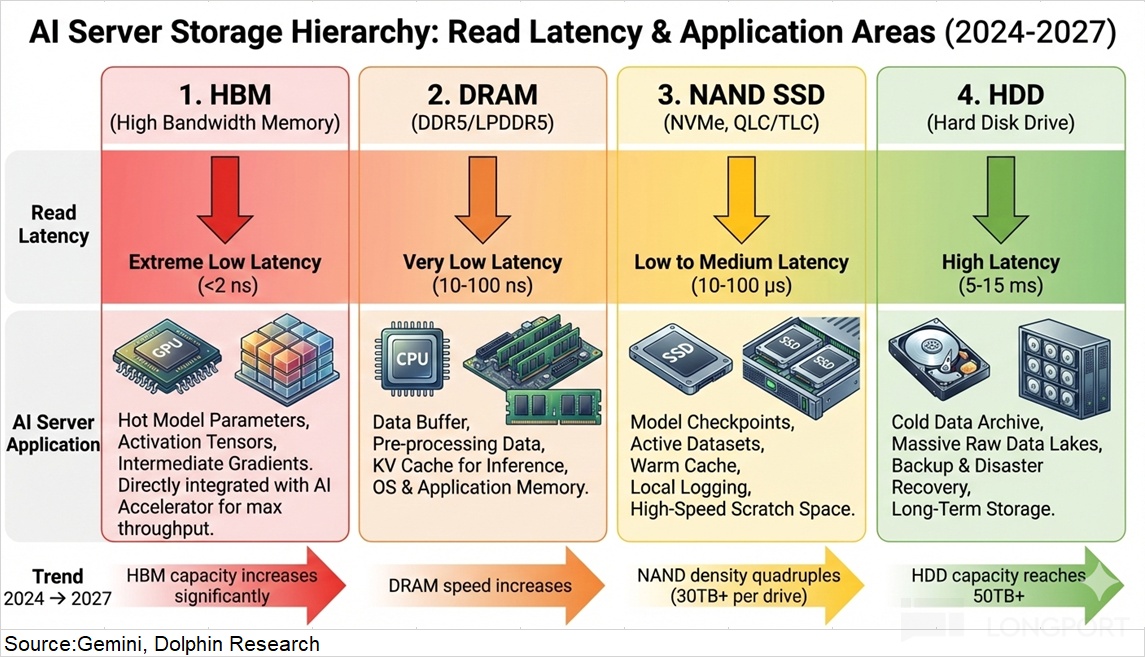
At the most fundamental level, storage has two dimensions: capacity (how much data can be held) and latency/bandwidth (how fast data can be written/read).Along these axes, the stack spans four broad categories: HBM, DRAM, NAND, and HDD.
HBM is a new, GPU-native demand, co-packaged via CoWoS alongside GPUs, offering ultra-low latency. DRAM (main memory) also provides low access latency and sits close to, but discrete from, CPUs/GPUs as ‘hot memory’; both fall under the broader DRAM family.HDD carries the highest latency but offers massive capacity for ‘cold’ data at low cost.
Within AI servers, each tier plays a distinct role:
a) HBM: 3D-stacked with the GPU die as dedicated high-bandwidth memory; it is fast, power-hungry, and expensive.HBM is the performance ceiling, defining per-GPU model size and response speed.
b) DRAM (DDR5): The data exchange hub shared by CPU/GPU and the bridge between HBM and NAND.Though slower than HBM, it offers far larger capacity. DDR5 is the memory foundation, with capacity determining concurrent tasks per server.
c) NAND (SSD): The hot data store and fast persistent layer that links DRAM and HDD.Acting as the performance-capacity balancer, SSDs are a rapid refuel station for training data and a quick-response core for inference.
d) HDD: The low-cost container for cold, infrequently accessed data.While lowest in bandwidth, HDDs offer massive capacity and set the data center’s capacity floor.
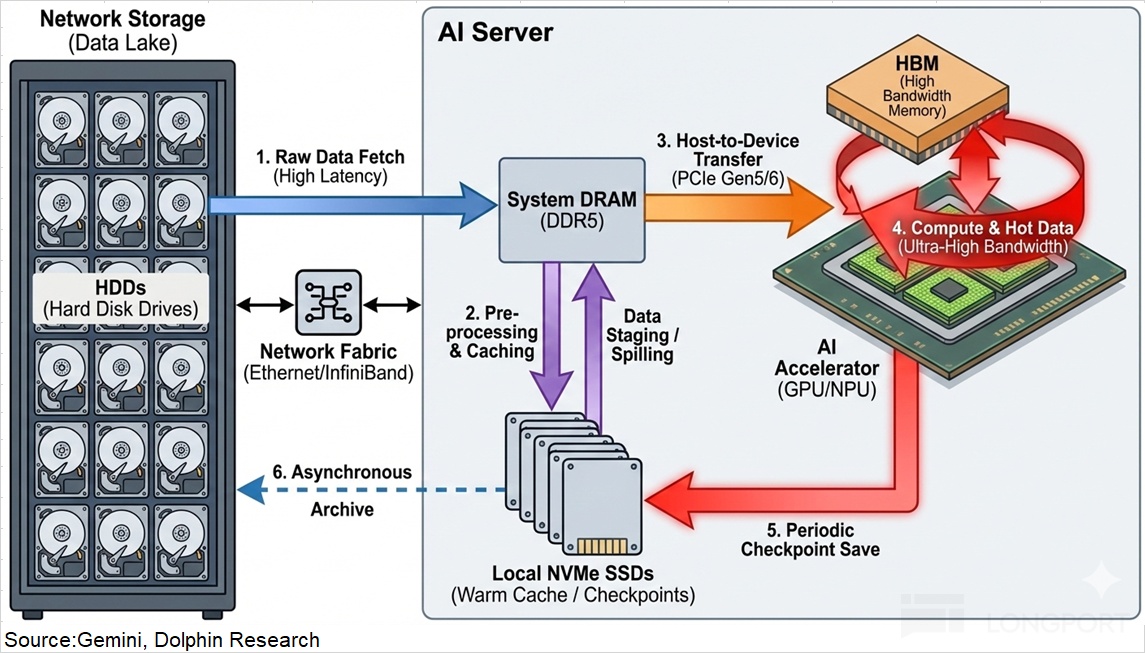
Data flows cleanly through this pipeline: cold data in HDD → warmed in SSD → staged in DRAM → fed to HBM for compute.Each tier is essential across both training and inference servers.
1.2 What characterizes AI storage today?
This cycle is entirely AI-led, so we assess AI storage through end-market server dynamics.Versus 1H, notable shifts have emerged in AI servers.
a) Shift from training to inference:i) Training is largely a one-off investment, whereas inference is a must-have for commercialization.
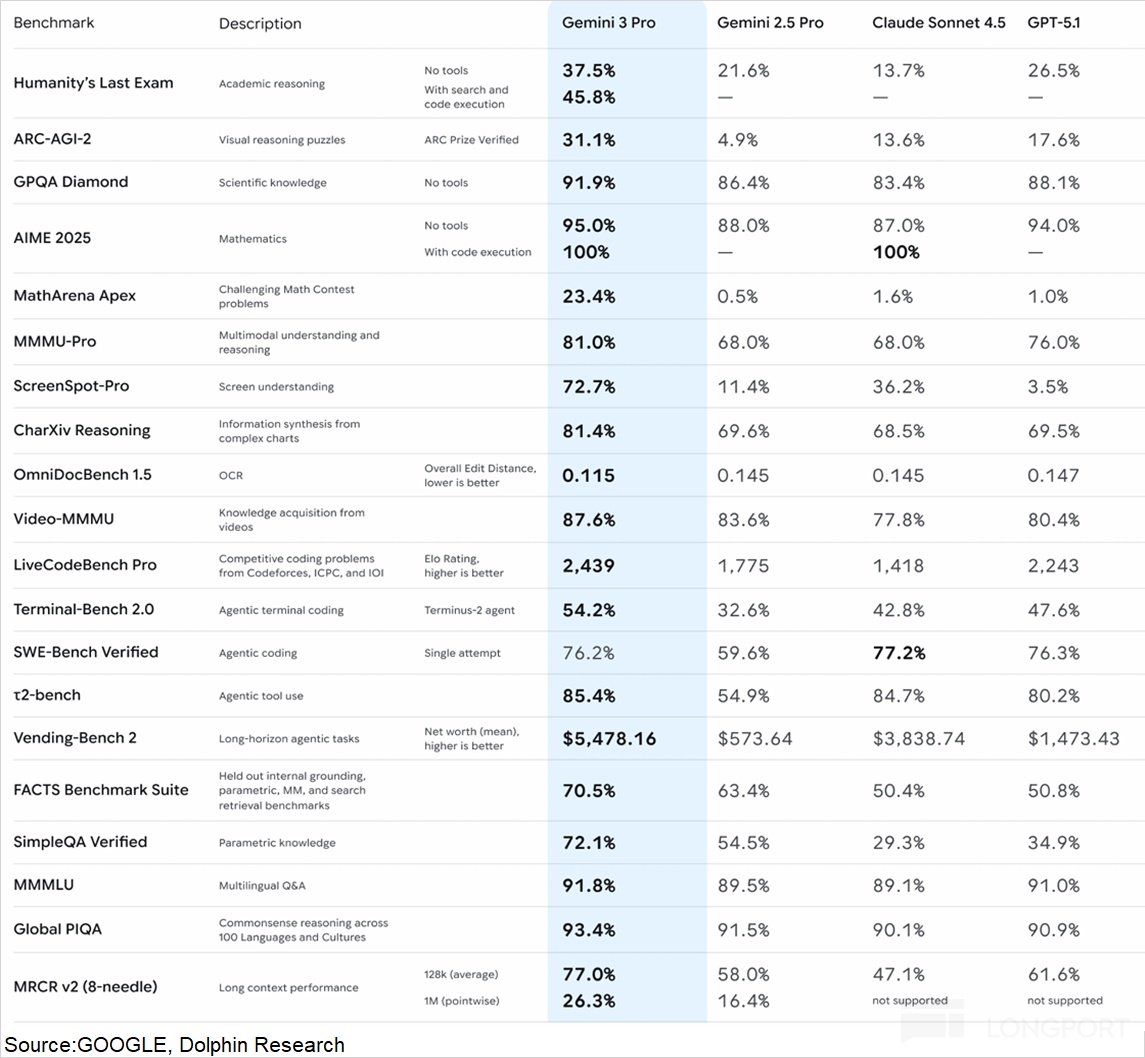
ii) Training is performance-max constrained and cost rises with performance, while inference benefits from scale economics via batching.After Google’s Gemini matched GPT-level performance, the market reassessed whether NVIDIA’s performance lead translates into real-world advantages at scale.
With workloads tilting to inference, custom ASICs can be fully competitive, especially when scaled.Compared with AI training servers, inference servers lean more on DDR (parallelism), SSD (fast response), and HDD (capacity).
b) From compute to data movement (‘memory’ capacity and bandwidth): The market had focused on raw compute, assuming more FLOPS meant faster models.But compute needs to be fed by memory bandwidth and capacity. If storage cannot deliver data fast enough, compute sits idle, the essence of the ‘memory wall’.
The ‘memory wall’ in practice: During inference, model weights (GBs) and KV cache (GBs) must be loaded from HBM into GPU caches before computation.Compute takes microseconds, but data movement takes milliseconds.
Using H100 as an example, HBM bandwidth is 3.35TB/s and per-token compute is ~10μs. To produce one token for a 10GB model with a 20GB KV cache, moving 30GB from HBM into GPU caches can take ~9ms, yielding ~99% idle time (9ms ÷ [9ms + 0.01ms]).Idle rate = waiting time (data movement + kernel launch) ÷ total time × 100%.
1.3 How does today’s setup shape AI storage demand?
Two shifts stand out: inference servers demand relatively more DDR, SSD, and HDD; and the ‘memory wall’ requires shortening data paths and raising bandwidth to cut wait time.Post MU’s acquisition of Groq, some argued SRAM could replace HBM (SRAM here refers to the on-die L2 cache that hubs traffic to external HBM).
At CES 2026, Jensen Huang responded that while SRAM is much faster than HBM, its capacity is far smaller.Thus, even as SRAM ramps, the likely form factor is ‘SRAM + HBM’, not SRAM as a near-term substitute.
Three main approaches address the ‘memory wall’:
i) HBM (more bandwidth): Move from 12-Hi to 16-Hi stacks, raising capacity and pushing bandwidth from B300’s 8TB/s to 16–32TB/s.This meaningfully cuts queueing and wait time.
ii) SRAM (shorter path): 3D-stacked SRAM vertically integrates multiple dies, placing KV cache and light model weights on or near the compute die.As it reaches volume, the ‘SRAM + HBM’ split emerges (SRAM for speed, HBM for capacity), potentially shrinking latency from ~100ns to ~2ns.
NVIDIA’s purchase of Groq underscores the value of 3D SRAM know-how; key players include TSMC, Groq, and Samsung.Market expectations suggest Groq tech could be integrated into NVIDIA’s Rubin in 2H26, boosting memory-side throughput.
iii) Compute-in-memory: Embedding portions of compute into the memory fabric to cut redundancy and lift efficiency and performance-per-watt.This has not yet landed at data center scale. From 2027 onward, it could become a path to resolving the ‘memory wall’.
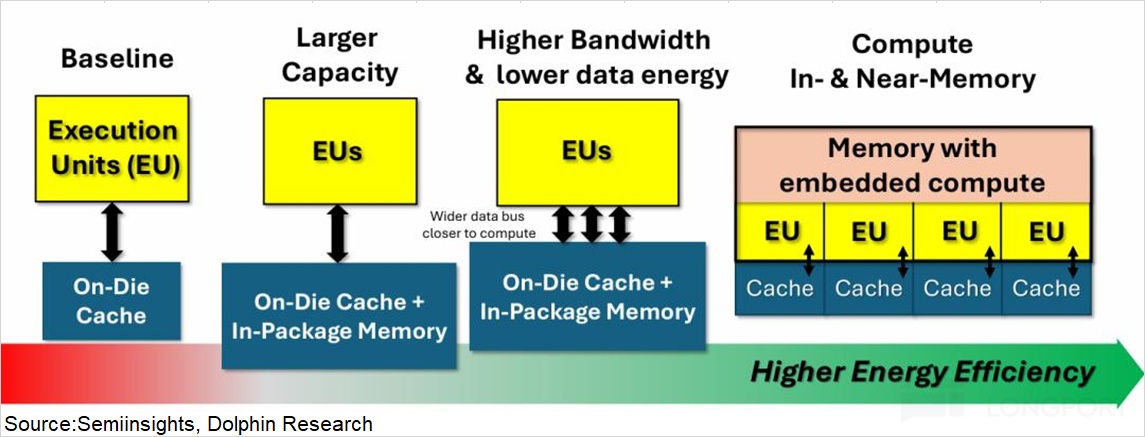
Data center priorities are shifting from pure compute toward memory bandwidth and capacity.Near term, faster HBM iterations and SRAM adoption are the practical ways to reduce wait time. Over the longer run, compute-in-memory may offer a more complete answer.
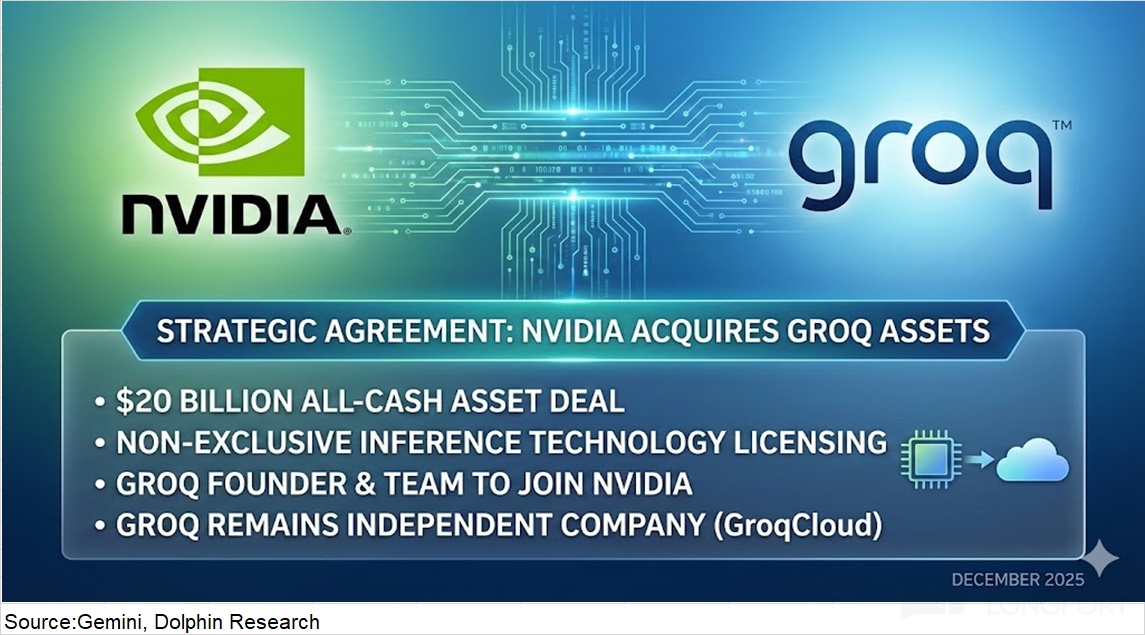
Note: NVIDIA’s acquisition of Groq is primarily an acqui-hire, while securing Groq’s core IP (LPU architecture, TSP micro-architecture, compiler) and rights to hardware assets. Founder Jonathan Ross (a Google TPU founding member) and ~90% of the core engineering team have joined NVIDIA, with Simon Edwards becoming Groq’s new CEO.This both augments NVIDIA’s inference roadmap via SRAM integration and serves as a defensive move to keep Groq’s tech from rivals.
II. HBM market: upgrading to HBM4, supply-demand in tight balance
As AI enters large-scale inference and the ‘memory wall’ persists, HBM remains a practical way to cut wait time.Accordingly, Samsung, SK hynix, and MU continue to put capex behind HBM.
HBM is the most direct incremental demand from AI, essentially created from zero.Because HBM ships alongside AI accelerators, HBM demand tracks AI chip shipments one-for-one.
Mainstream AI chips (NVIDIA, Google, AMD) are on HBM3E. After Samsung’s HBM3E passed NVIDIA’s qualification, it rejoined the lead pack.All three are now sampling HBM4, and next-gen AI flagships will migrate as HBM4 enters volume.
While HBM demand is led by AI servers, HBM supply is not the tightest part of the stack.One reason is that recent capex growth has been concentrated in DRAM, especially high-end HBM lines.
Management commentary reflects this: SK hynix is investing to expand M15x HBM4 capacity; Samsung is focusing spend on 1c-node HBM penetration and a small uplift at P4L; MU is prioritizing 1-gamma migration and TSV tooling.These moves should keep HBM expansions on track.
2.1 HBM supply: from capacity to output
The HBM market is supplied by SK hynix, Samsung, and MU, and aggregate output depends on their effective capacity.With capex concentrated in HBM, capacity is ramping fast.
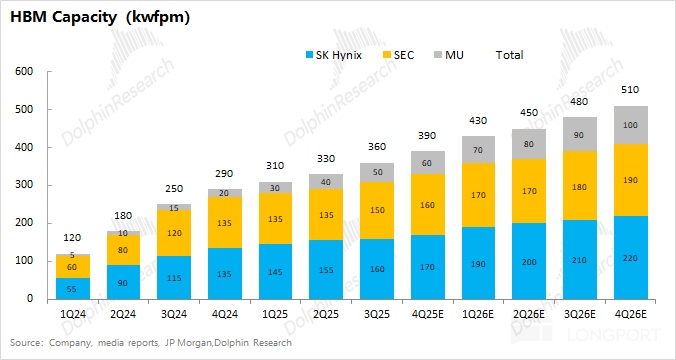
Based on company and industry checks, combined HBM monthly capacity is ~390k wafers now, led by SK hynix and Samsung, with MU smaller.As spending continues, monthly capacity could reach ~510k wafers by end-2026, adding ~120k wafers/month YoY.
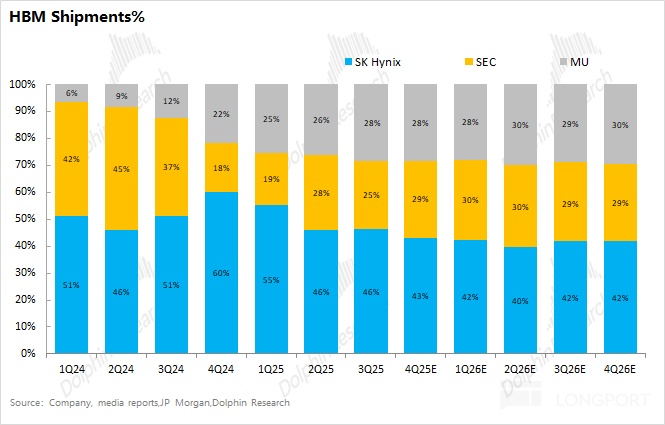
Capacity does not equal shipments. For example, Samsung’s HBM capacity is sizable, but HBM3E yield issues and delayed NVDA qualification cut its actual shipments to below 30% share.Currently, SK hynix holds close to half the market, with MU and Samsung similar. As Samsung’s HBM3E received NVDA qualification in Q4, its utilization and share should recover and may overtake MU.
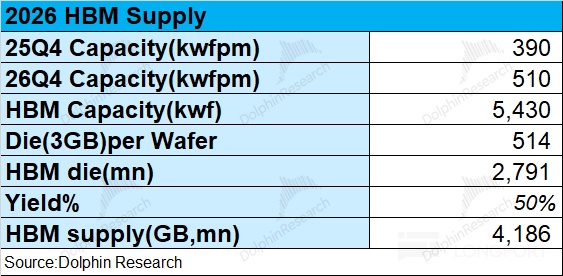
We estimate supply using capacity and yield. Since HBM is essentially a three-supplier market (SK hynix, MU, Samsung), we focus on their trajectories.From the combined view above, monthly capacity is ~390k wafers in Q4 2025 and ~510k by Q4 2026.
Accounting for ramp dynamics, we estimate 5.43mn wafers of total HBM capacity in 2026.A 300mm wafer can yield ~514 equivalent 3GB HBM dice (after edge and sawing losses), implying ~2.79bn dice. At 50% blended yield, that’s ~4.19bn GB of HBM supply in 2026.
2.2 HBM demand: CoWoS → AI chips → HBM
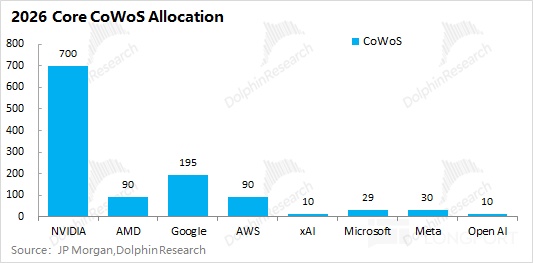
Because HBM is paired with AI accelerators, and these accelerators require CoWoS, we estimate HBM demand via CoWoS capacity, then chips, then HBM.In 2026, NVDA should still hold over half of CoWoS allocations; Google, AMD, and Amazon are also major downstream users.
Assuming the core customers below account for 90% of demand, global CoWoS needs are ~1.28mn wafers in 2026.We then map that to chip output by platform.
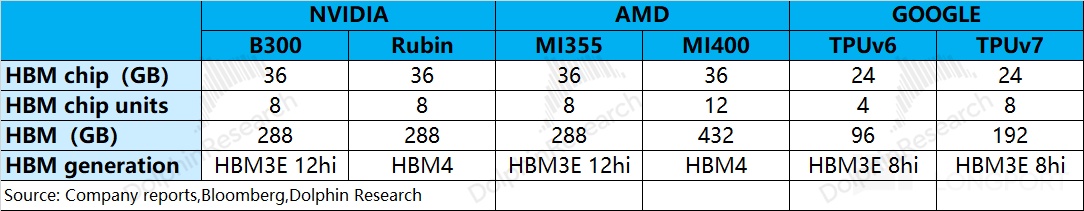
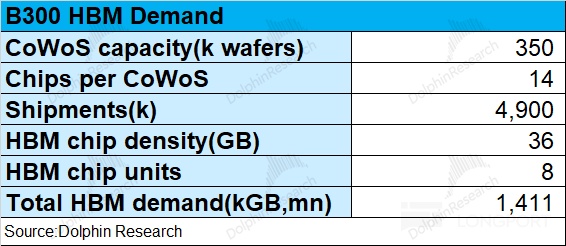
Take NVIDIA’s B300: one CoWoS wafer yields ~14 B300 packages (28 bare dies), so a 350k-wafer CoWoS allocation implies ~4.9mn B300 chips.Each B300 carries 8x HBM3E at 36GB each, or 288GB per chip. That translates to ~1.4bn GB of HBM for B300 alone.
Applying the same method to Google, AMD, and others, total 2026 CoWoS demand of ~1.28mn wafers maps to ~4.2bn GB of HBM demand.With supply at ~4.19bn GB and demand at ~4.21bn GB on our estimates, the 2026 HBM market sits in tight balance despite aggressive expansions by the Big Three.
This article outlined storage roles within AI servers and the HBM supply-demand setup.The next piece will extend to how AI reshapes legacy storage.
<End here>
Recent Dolphin Research work on storage:
Earnings season
Dec 18, 2025 call ‘MU (Analyst Call): Cash prioritized for capacity build; HBM4 yield ramp faster’
Dec 18, 2025 call ‘MU (Trans): GPM to continue improving, but at a slower pace’
Dec 18, 2025 earnings take ‘MU: AI ignites memory bandwidth; a new storage supercycle?’
Risk disclosure and disclaimer: Dolphin Research disclaimer and general disclosure
The copyright of this article belongs to the original author/organization.
The views expressed herein are solely those of the author and do not reflect the stance of the platform. The content is intended for investment reference purposes only and shall not be considered as investment advice. Please contact us if you have any questions or suggestions regarding the content services provided by the platform.
