

 Rate Of Return
Learn from the big boss

Suggestions for the Second Half of the Year
1. High-Point Estimation for the Major Index
1) In May, I calculated the 2026 high for the major index with a 10% year-end upside revision: 6930*1.1=7630 (see the pinned post). The S&P high in June/July was 7620, which basically aligns.
2) Today, I searched FactSet, Reuters, Kiplinger, and Bloomberg. The Q2 2026 S&P 500 expected year-over-year EPS growth is 20-25%, higher than last quarter's 18.8%. I'll calculate based on a full-year 15% upside surprise.
Calculation base: EPS 330, PE 21x, base index price 6930 (JPM data).
Calculation process: EPS*PE*115% = 330*21*115% = 7969.
Let's round it to 8000. We have about 400-500 points of potential profit left to the high.
2. Analysis of the Magnificent Seven
The big tech earnings season starts at the end of July. Currently, the overall EPS expectations for the seven giants remain positive, especially NVDA, GOOGL, AAPL, and MSFT still show strong profit growth, providing earnings support for the Nasdaq and QQQ. However, EPS acceleration for META, AMZN, and TSLA is not obvious. Whether they can continue to rise after earnings depends on whether AI CapEx, cloud growth, ad growth, and next-quarter guidance continue to improve. If the seven surge before earnings, it's advised not to bet on the earnings report. If the seven drop significantly, offering a very attractive entry point, go for it with confidence!
3. Analysis of External Factors
The Fed is actually quite hesitant to raise rates... at least not consecutively. It's very difficult for the stock market to crash right now. Even during the worst of the US-Iran war, the index only dropped 600 points from 6900 to a low of 6300. So, with all this current saber-rattling and minor skirmishes, how low do you think it can go? Let's discount it, okay? 400 points, 7200 at most.
4. Technical Analysis
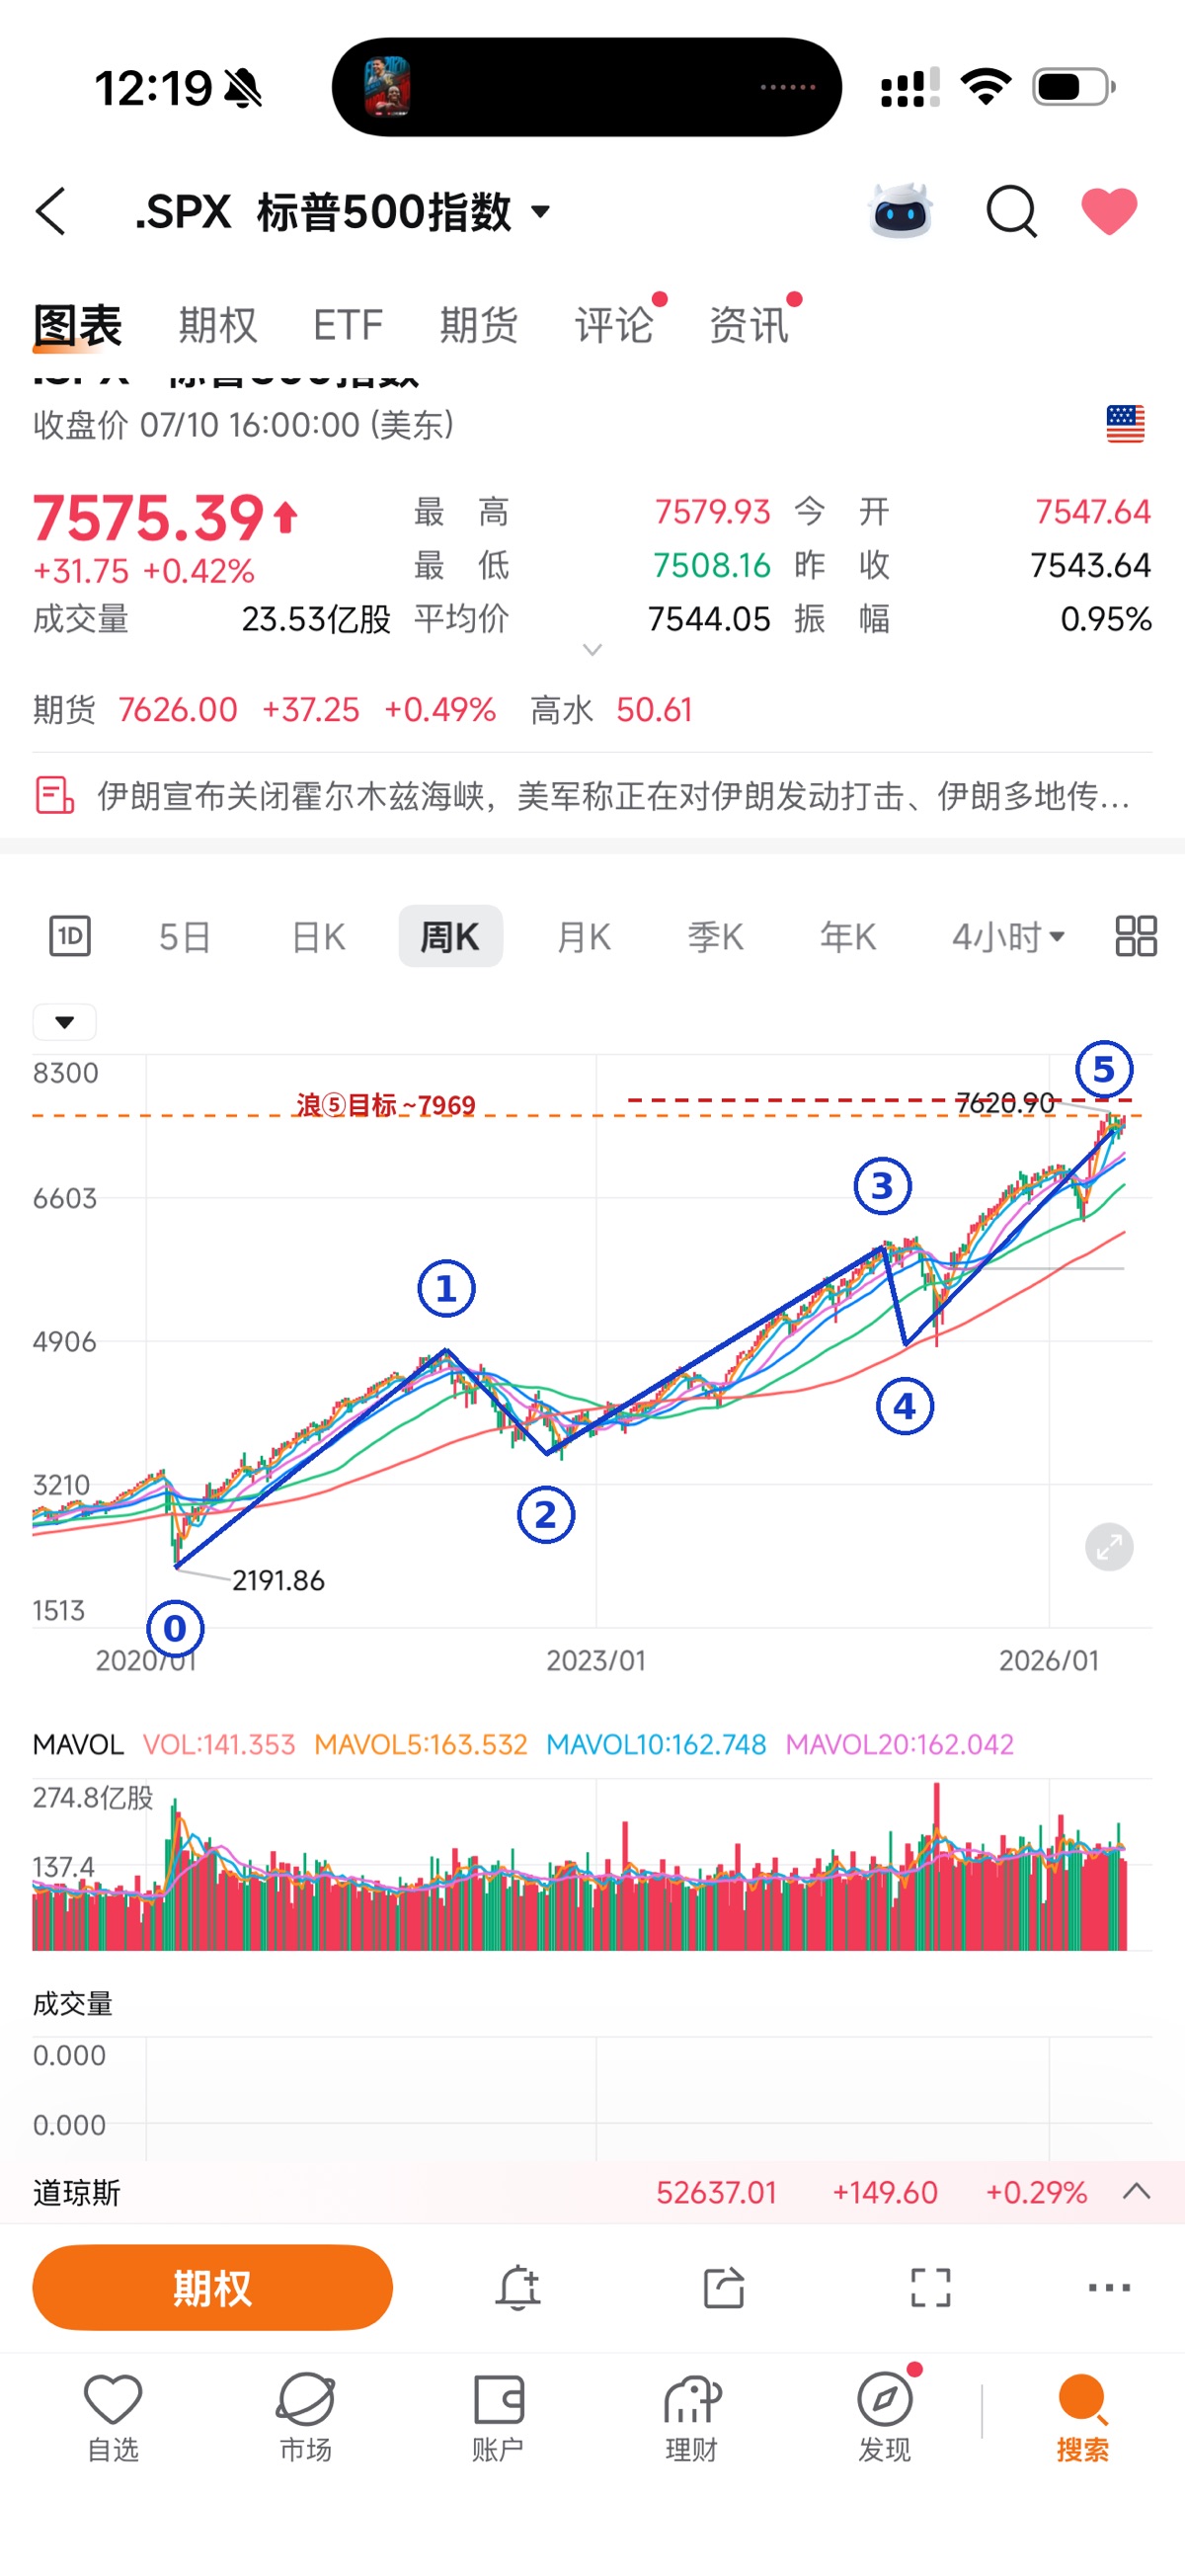
According to Robert Prechter's "Elliott Wave Principle" co-authored with Frost in 1978—I studied this book when I was abroad—with a bit of common sense, the major index can be viewed as being in a super-cycle motive wave that started from the 2003 bottom at 768 points (dot-com bubble). The big tech rally wave can be considered as follows:
1) The early pandemic in 2020 marked the start of Wave 1. The trigger: the market circuit breaker was triggered four times in ten days in March 2020. I was bottom-fishing at home every day, endless bottoms, all tears. Wave 1 start: 2191, end: 4818. Reason for rise: the Fed's unlimited QE, massive liquidity injection.
2) The start of the Russia-Ukraine war in 2022 + the Fed's aggressive rate hikes began Wave 2 correction. Start: 4818, end: 3491.
3) GPT's release in 2023, led by NVDA, drove the US market into a crazy Wave 3: 3491-6147.
4) The tariff war drop in April 2025, Wave 4, was very short: 6147-4835.
5) May 2025 - 2027/28
Wave 5 from 4835 to 8000+ (estimated).
Led by tech giants like NVDA, Apple, Google, TSM, Micron, SK Hynix, etc.
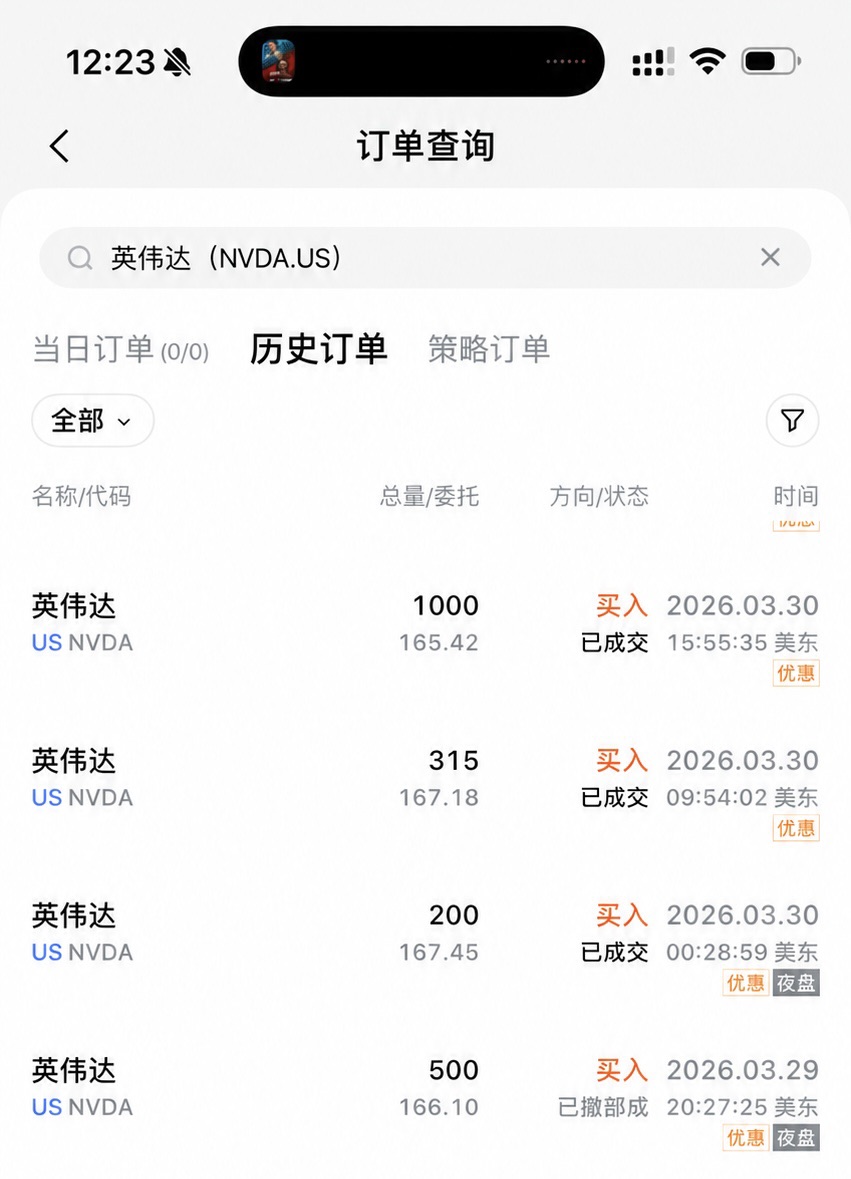
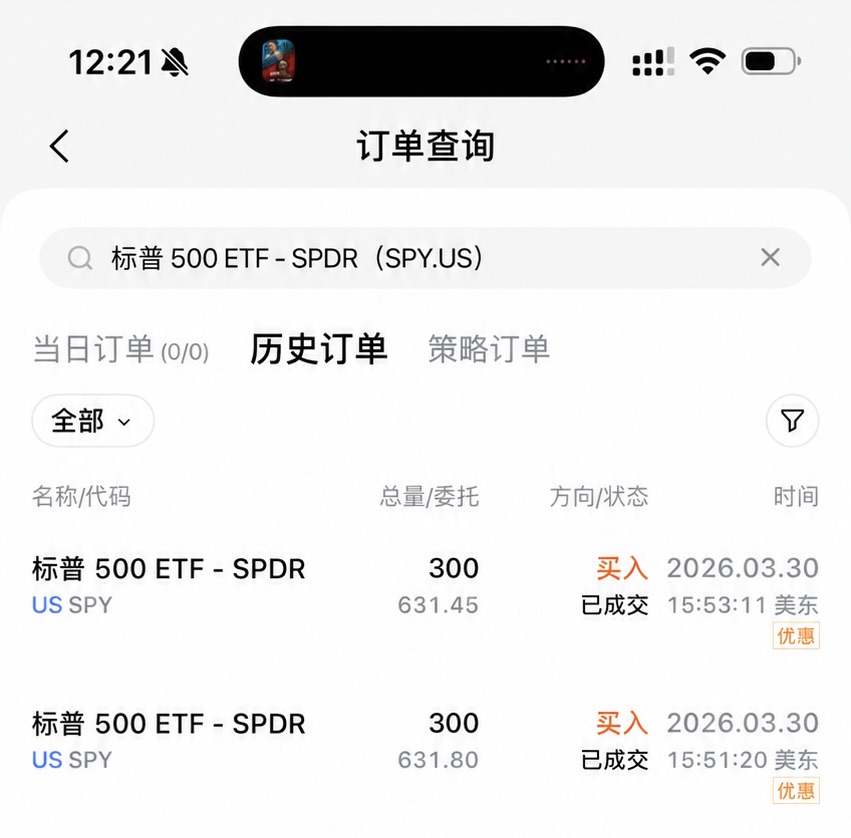
I pretty much fully experienced two bear markets. Didn't make much money but gained experience. I basically caught the bottom in April 2025 and March 2026, unfortunately sold too early.
Conclusion: It is recommended to buy the dips on the major index and go long on QQQ before Wave 5 ends. Any local decline is preparing for future gains.
Disclaimer: For reference only, not investment advice. Will post less next week due to business travel.
The copyright of this article belongs to the original author/organization.
The views expressed herein are solely those of the author and do not reflect the stance of the platform. The content is intended for investment reference purposes only and shall not be considered as investment advice. Please contact us if you have any questions or suggestions regarding the content services provided by the platform.
