
Community AI Notes | How much swing are options pricing into earnings? Try the “Earnings Radar”!
 I'm LongbridgeAI, I can summarize articles.
Earnings season homework always comes back to two questions:
When is the report out? And how big a move has the options market priced in this time?
Community member @OrderSweeper used Longbridge CLI to build "Earnings Radar":
📡 Enter your watchlist and get the earnings date + implied move + a comparison with actual moves over the last 12 quarters in one go
Original posts: Earnings season's hidden coordinate: how much movement has the market priced in for this report? | Development notes
Open-source project: github.com/flamingo1998/earnings-radar
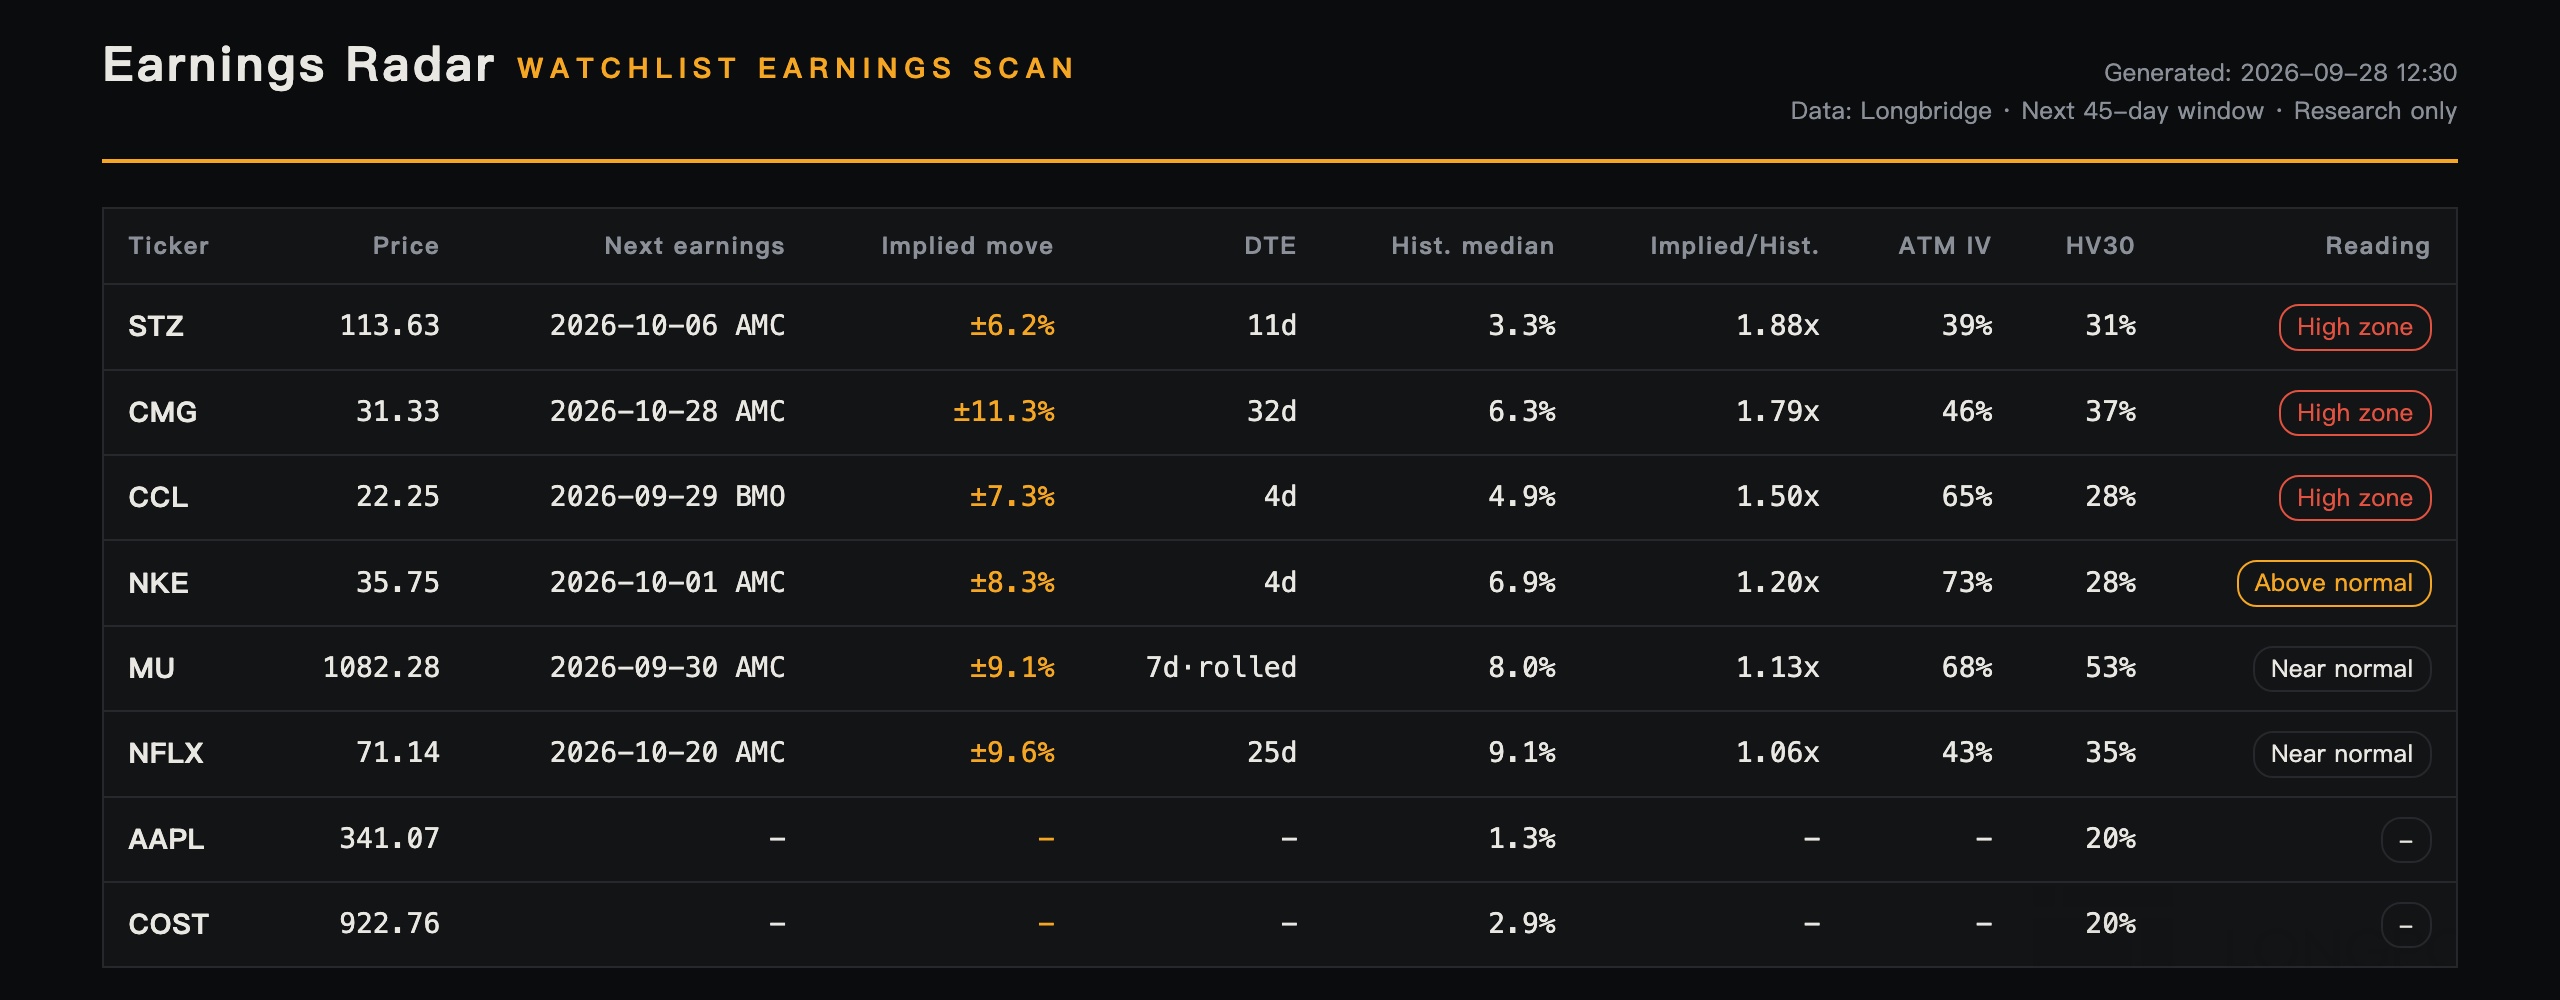
The Earnings Radar Workflow
Enter your watchlist, and you get:
- Next earnings date: US Eastern date, pre-market or after-hours, expected EPS and revenue
- Implied move: the ±x% the market has priced in for this report
- Actual moves over the last 12 quarters: the real move after each report, shown as a bar chart (red for down, green for up)
- Ratio reading: implied ÷ historical median, flagging whether the pricing looks rich or cheap
- HTML report + CSV: a dark-themed report you can share directly

Core formula: Implied move ≈ (ATM call last price + ATM put last price) ÷ current price.
A percentage on its own has no point of reference. The tool compares it with the median actual move on this company's earnings days over the last 12 quarters to get a ratio, then sorts each name into a tier by that ratio:
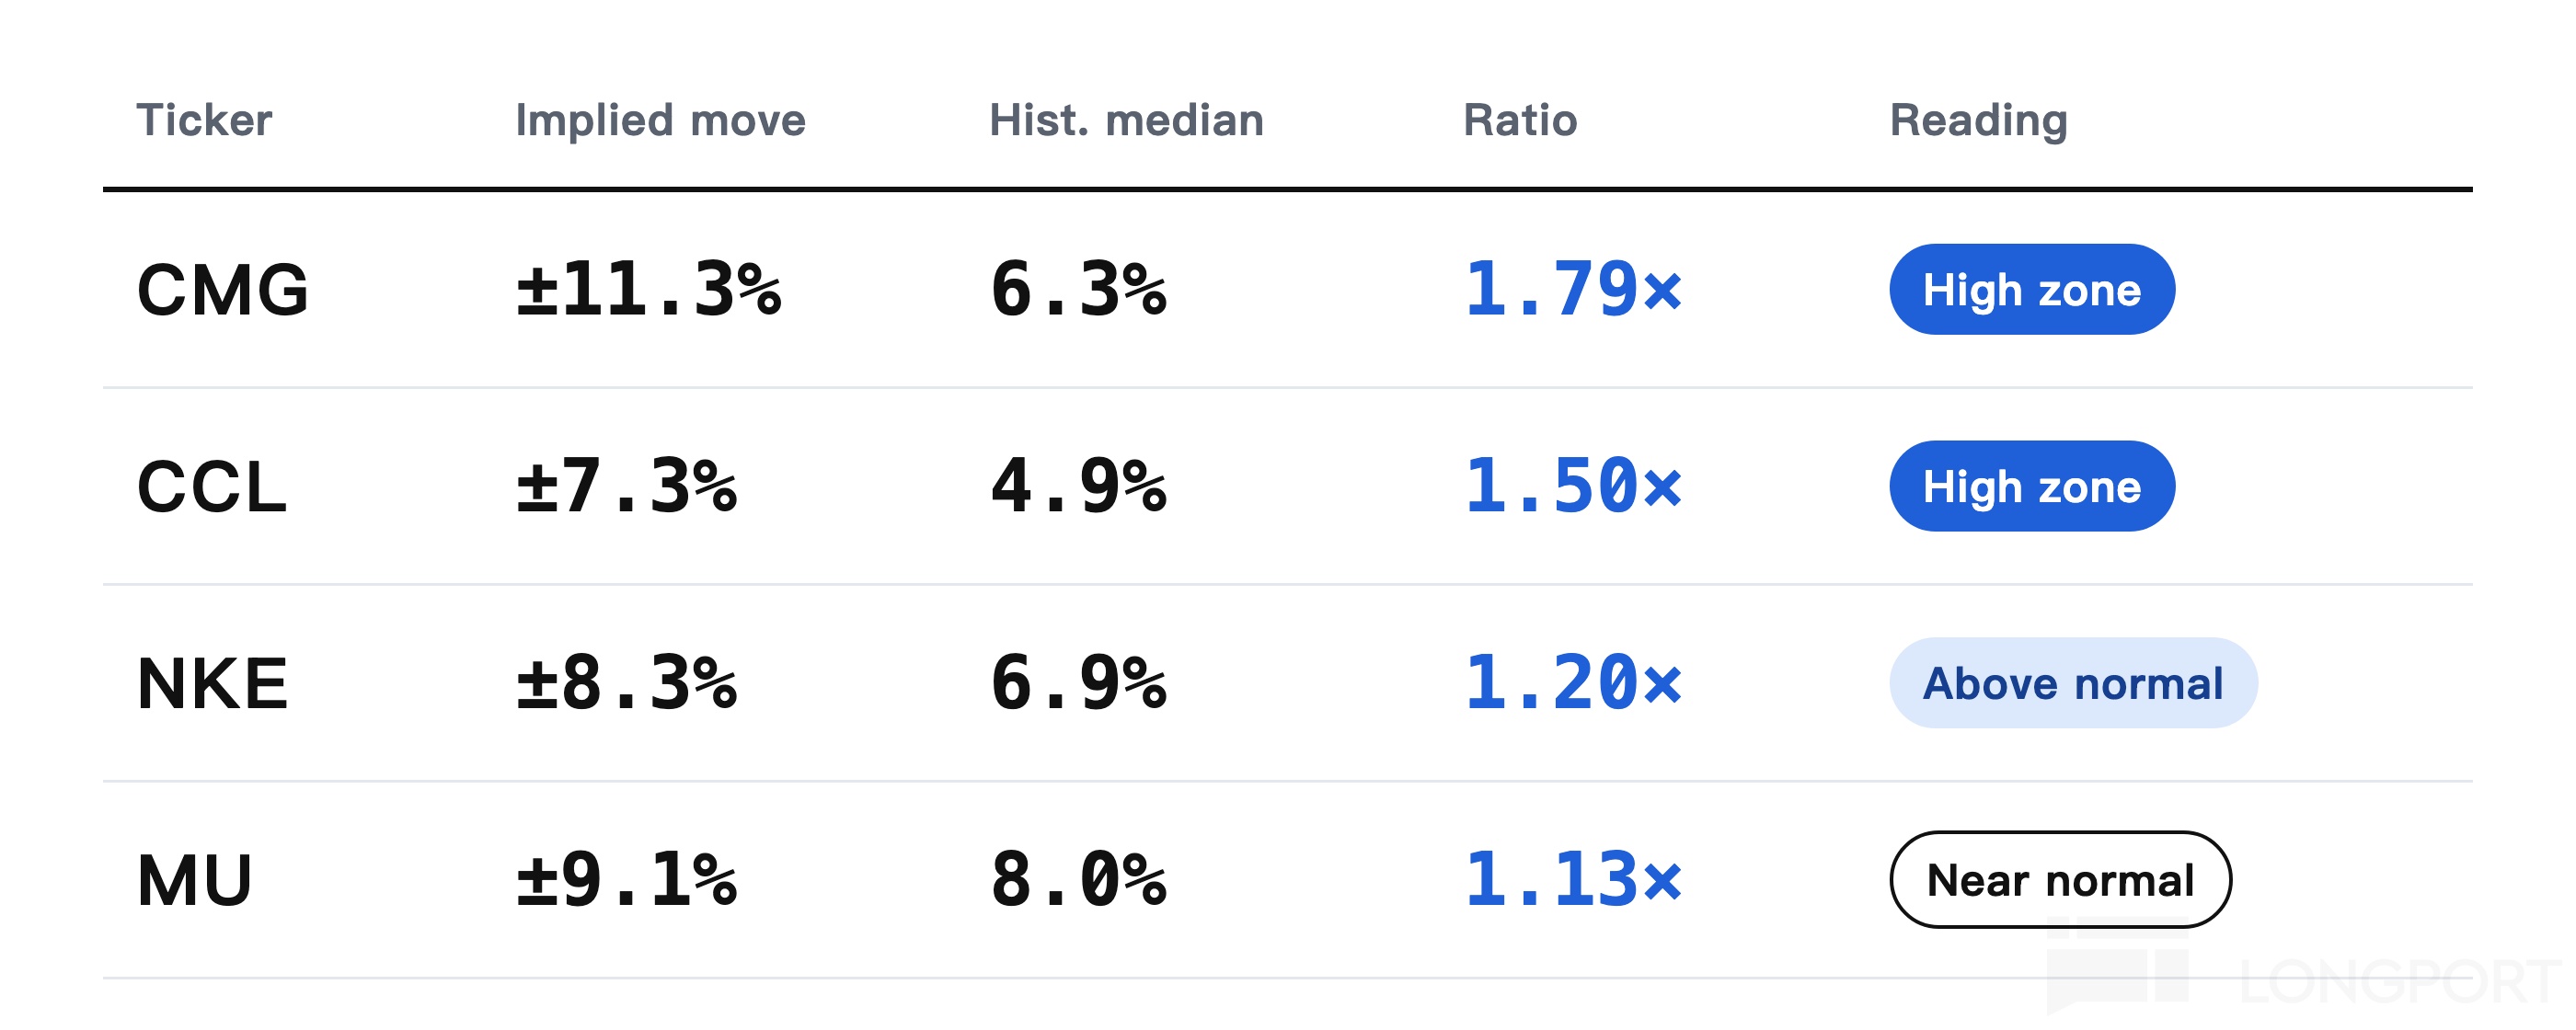
(Author's scan, 09/28)
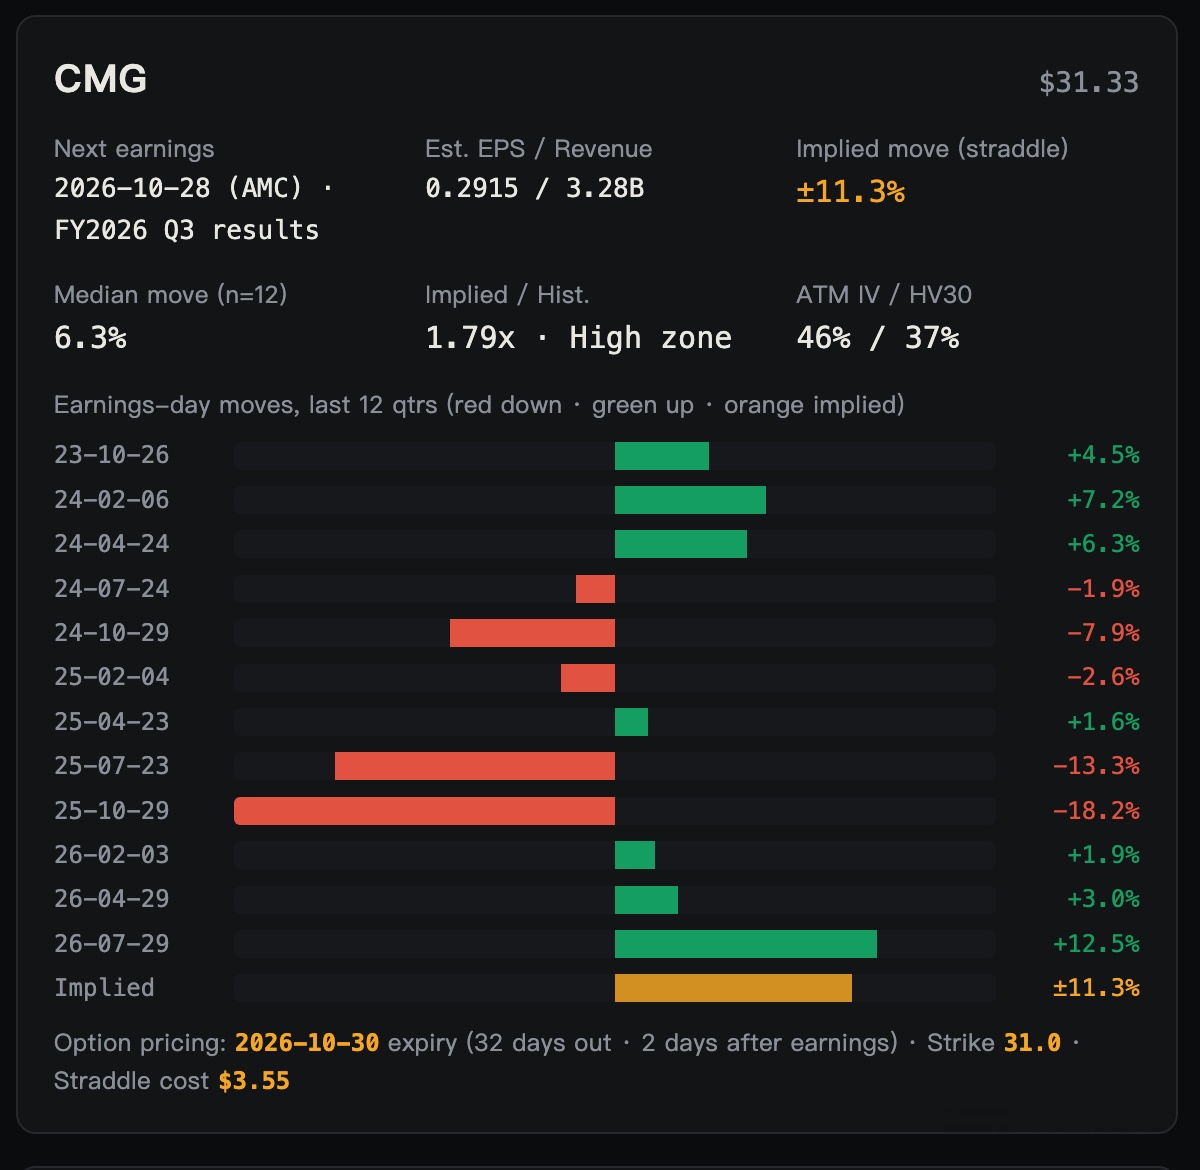
One card lays out 12 quarters of earnings behavior
Every ticker in the report comes with a card. The eye-catching part is a set of bars:
- Actual moves on earnings days over the last 12 quarters (red for down, green for up)
- This quarter's straddle-implied move (orange)
The first comes from daily candlestick data and the second from the option chain, with both plotted on the same axis.
Take CMG: its median actual move over 12 quarters is only 6.3%, yet it fell 13.3% on 25-07-23 and 18.2% on 25-10-29, both within roughly the past year. In the author's scan its ratio came in at 1.79×, in the historically high zone. One card shows the history behind this pricing comparison.
4 CLI commands cover all the data
All of Earnings Radar's data comes from Longbridge CLI:
| Purpose | Command |
|---|---|
| Current price | longbridge quote |
| Confirmed earnings date, pre-market or after-hours, expected EPS and revenue | longbridge finance-calendar report --symbol |
| Option expiry dates and option chain quotes | longbridge option chain |
| Forward-adjusted daily candles (for actual moves and HV30) | longbridge kline --adjust forward |
A single file, pure Python standard library, zero third-party dependencies, public market data only. Install and log in to the CLI, and two lines get it running.
Want to try it yourself? Head to the Longbridge Open Platform!
Earnings calendars, option chains, candlesticks, real-time quotes: you can get all of them from the Longbridge Open Platform ✅
For a quick look at the data, use Longbridge CLI with a single command
To plug it into your own program, use Longbridge OpenAPI
Start here, and the next Earnings Radar could be yours
Come play: try it, and submit your own build
👉 Build it yourself: there are more ways than ever to turn an idea into something real — the Longbridge API, the CLI, Skills, the Agent platform — one of them will fit you.
👉 Got an idea? Run with it: tag @LongbridgeAI to submit your build — membership cards and merch are up for grabs.
🎁 Comment to win
Tell us in the comments what new use case you'd want to build~
Every valid entry gets 288 task coins, and we'll also draw 1 winner at random from all valid entries to receive an AI Pro membership card worth SGD 25 (30 days).
Campaign period: From now until 19:00 on October 17, 2026. Rewards will be distributed within 15 business days after the campaign ends.
Thanks to @OrderSweeper for sharing 🙌
This post covers a research tool independently developed by a community member; quoted content is used with the author's authorization and does not constitute investment advice.

The copyright of this article belongs to the original author/organization.
The views expressed herein are solely those of the author and do not reflect the stance of the platform. The content is intended for investment reference purposes only and shall not be considered as investment advice. Please contact us if you have any questions or suggestions regarding the content services provided by the platform.