


NewUser_tXvx48

NewUser_tXvx48

5Following2Followers

Original

N
NewUser_tXvx48

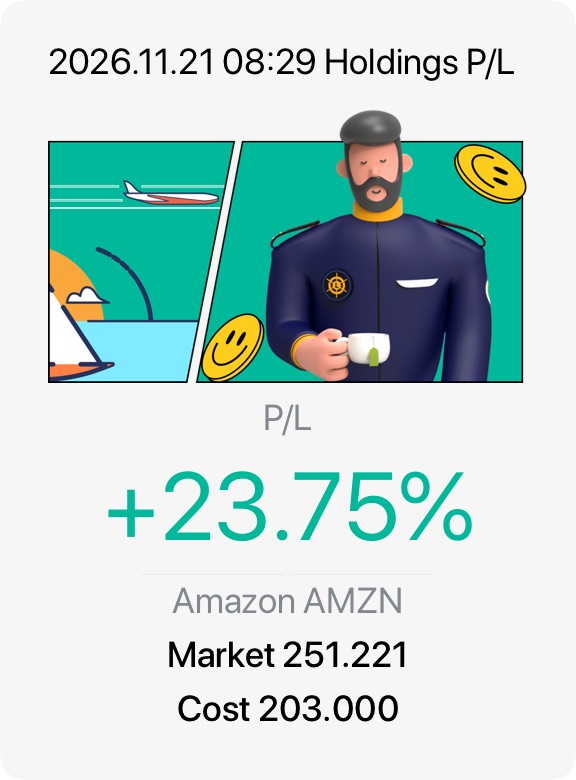
Amazon $Amazon(AMZN.US) holds a Strong Buy consensus from Wall Street analysts, with an average price target of $325.02—implying roughly 31.7% upside from its November 20, 2026 close of $246.82.

Bull Case

• Accelerating Cloud Growth. In Q3 2026, Amazon Web Services (AWS) revenue surged 39.3% year-over-year to $46.0 billion—its fastest pace in nearly five years—backed by a $578 billion order backlog and major AI partnerships with Meta, NVIDIA, and OpenAI.

• Record Operating Margins. Consolidated Q3 operating income jumped 61% to $28.1 billion, lifting operating margins to an all-time high of 13.9% alongside high-margin digital advertising momentum.

• Anthropic Stake. Amazon’s 14.6% equity stake in newly public Anthropic adds substantial balance-sheet value alongside a $110 billion long-term compute commitment.

Bear Case

• Massive CapEx & Cash Burn. Management projects ~$220 billion in 2026 capital expenditures (and more in 2027) to fund AI data centers, pushing trailing 12-month free cash flow to a $42.4 billion outflow.

• Retail & Top-Line Friction. Q3 total revenue ($201.9 billion) and EPS ($1.89) narrowly missed estimates, while softer consumer spending, promotional discounting, and local regulatory battles weigh on retail margins.

• Market Volatility. Mega-cap tech rotations and post-IPO swings in Anthropic shares have pressured AMZN near its 200-day moving average (~$245).

Analyst Consensus

Among 43 analysts tracked on Google Finance, 42 rate AMZN a Buy and 1 rates it a Hold, with price targets ranging from $230.00 to $390.00.
图片 1,共 1 张
Trade Showcase: Trade, Show & Earn Rewards!
N
NewUser_tXvx48

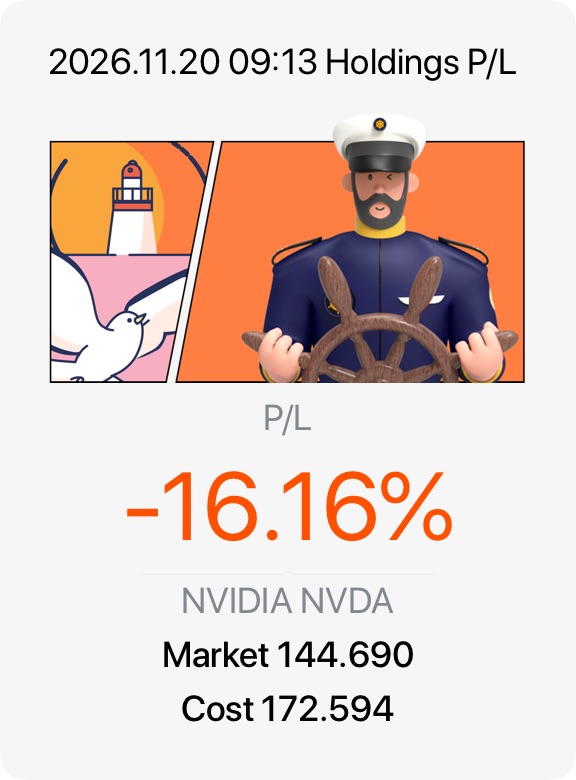
NVIDIA (NVDA) is caught between explosive operational growth and severe leadership and regulatory turmoil, trading near its 52-week low despite record earnings.

Bull Case (Fundamentals & Valuation)

• Record Q3 FY27 Results. On November 17, 2026, NVIDIA reported revenue of $115.8 billion (up 103% year-over-year) and non-GAAP EPS of $2.68, beating estimates.

• Strong Outlook & Product Ramp. Management guided Q4 revenue to ~$130 billion, fueled by the new Vera Rubin platform generating nearly $20 billion in its first shipping quarter—the fastest ramp in company history.

• Compressed Valuation. Following a ~40% pullback from its October peak of $243.37, NVDA trades at a trailing P/E under 16x and carries a fresh $150 billion share buyback authorization. Wall Street maintains a “Moderate Buy” consensus with an average price target above $243.

Bear Case (Governance & Macro Risks)

• CEO Departure & Probes. Co-founder Jensen Huang abruptly resigned on November 12 amid reports of a foreign intelligence inquiry, leaving CFO Colette Kress as interim CEO. The board confirmed Huang will not be reinstated, while SEC and state probes add legal exposure.

• Margin & Macro Pressure. Q4 gross margins are guided slightly lower to 71%–72% with zero China data-center revenue assumed. Rising 10-year Treasury yields above 5% and potential Fed rate hikes further compress tech multiples.

图片 1,共 1 张
Trade Showcase: Trade, Show & Earn Rewards!
N
NewUser_tXvx48

Amazon.com, Inc. $Amazon(AMZN.US) presents a compelling growth-at-a-reasonable-price profile, propelled by accelerating cloud momentum and record profitability, though weighed down near term by massive AI capital expenditures.

Key Growth Drivers (Bull Case)

• AWS Acceleration. In Q3 2026, Amazon Web Services (AWS) revenue surged 39.3% year-over-year to $46.0 billion—its fastest pace in nearly five years—backed by a $578 billion backlog and soaring demand for custom AI chips (Trainium/Graviton).

• Margin Expansion. Regionalized fulfillment efficiencies and high-margin service growth pushed Q3 operating income to a record $28.1 billion (a 13.9% operating margin).

• Strategic Catalysts. Amazon’s stake in Anthropic gained substantial value following its IPO pricing, while a $5 billion data-center deal with Blackstone frees up capital for AI reinvestment.

Primary Risks (Bear Case)

• Heavy CapEx & Cash Burn. Aggressive AI infrastructure spending (~$220 billion projected for 2026, rising further in 2027) pushed trailing 12-month free cash flow to -$42.4 billion and raised net debt to $58.9 billion.

• Execution Headwinds. Q3 revenue ($201.9B) and EPS ($1.89) slightly missed estimates amid softer ad growth (+11%) and a failed rocket launch that destroyed 40 Amazon Leo satellites.

Valuation & Outlook

Carrying a Strong Buy consensus on Google Finance across 43 analysts with an average target of $324.41, AMZN offers attractive upside if long-term AI returns outweigh near-term cash flow compression.

图片 1,共 1 张
Trade Showcase: Trade, Show & Earn Rewards!
N
NewUser_tXvx48

NVIDIA Corporation (NVDA) presents a stark contrast between explosive financial fundamentals and severe governance turmoil. Despite a roughly 35% sell-off from its October highs, the chipmaker’s core AI business continues to beat Wall Street expectations.

Bull Case & Financial Momentum

• Blockbuster Q3 FY27 Earnings. Reported on November 17, 2026, quarterly revenue surged 103% year-over-year to $115.8 billion, driven by $107.6 billion in Data Center sales.

• Strong Forward Guidance. Management projected Q4 revenue around $130 billion and raised FY2028 revenue growth expectations to 75%, fueled by rapid Vera Rubin architecture adoption.

• Attractive Valuation. With a 62% net profit margin, the recent pullback has compressed valuation multiples while Nvidia retains its dominant CUDA software moat.

• Shareholder Returns. The board recently added $150 billion to its share repurchase authorization, leaving $227.3 billion available for buybacks.

Bear Case & Key Risks

• Leadership Vacuum. Co-founder Jensen Huang abruptly resigned as CEO amid a personal scandal and national security scrutiny, and the board has ruled out his return.

• Regulatory & Export Headwinds. The SEC is investigating Nvidia’s disclosures, while new U.S. Commerce Department rules ban renting Nvidia AI chips to Chinese firms.

• Macro & Competitive Pressure. Rising Treasury yields threaten tech valuations, alongside long-term risks from hyperscalers designing custom silicon.

Wall Street Consensus

Analysts on Google Finance maintain a Buy consensus across 40 ratings (26 Buy, 13 Hold, 1 Sell) with an average price target of $232.33, implying roughly 49% upside if interim CEO Colette Kress executes a smooth transition

图片 1,共 1 张
Trade Showcase: Trade, Show & Earn Rewards!
N
NewUser_tXvx48

Context

Amazon is transitioning from a traditional e-commerce giant into a leading global AI infrastructure powerhouse. While headline numbers for Q3 2026 slightly missed estimates, underlying metrics show Amazon Web Services (AWS) accelerated to a massive 39% revenue growth rate, marking its fastest expansion in nearly five years. Short-term headwind pressures from a recent 40-satellite launch failure and tightening U.S. AI chip export restrictions have dropped the stock to $257.75, presenting a highly strategic pullback entry point.

My trade

• Action: Accumulate shares on current pullback dips below $260.

• Stop Loss: Strict execution close under $230 (the post-earnings structural support floor).

• Target 1: $287 (testing the previous 52-week structural high resistance).

• Target 2: $322 (aligning with the current 12-month average analyst price target).

Takeaway

The structural thesis for Amazon remains fully intact because you want to own the digital landlord that everyone else must rent computing power from. Near-term news regarding satellite deployment delays provides a tactical entry to buy institutional-grade cloud acceleration at a discounted multiple. Monitor the upcoming Nvidia earnings and Anthropic IPO momentum to gauge immediate sector volatility.

图片 1,共 1 张
Trade Showcase: Trade, Show & Earn Rewards!
N
NewUser_tXvx48

Context

Broadcom $Broadcom(AVGO.US) closed at $347.01 on November 13, 2026, down 4.76% amid semiconductor profit-taking and analyst scrutiny over customer concentration.

Despite recent volatility, AVGO has outperformed chip peers in November following Nvidia CEO Jensen Huang’s resignation, which drew investor interest toward Broadcom’s custom AI accelerators (XPUs) and networking chips. Financially, momentum remains strong: Q3 FY26 AI semiconductor revenue surged 221% YoY to $16.7 billion, and management projects full-year AI revenue to reach $58 billion in FY26 and $115 billion in FY27. However, a downgrade from Rothschild & Co Redburn flagged risks around AVGO’s reliance on six major AI buyers (including Google, Anthropic, OpenAI, and Meta) and its $42 billion lending agreement with Anthropic.

My trade

• Entry Strategy. Accumulate shares on pullbacks into the $330–$336 technical support zone, positioning ahead of Q4 FY26 earnings on December 9, 2026.

• Risk Management. Place a stop-loss below $315 to guard against AI capex pullbacks, and trim partial exposure near the $398–$400 resistance level.

• Downside Risks. Heavy customer concentration, vendor-financing exposure to cash-burning AI labs, and a ~44x trailing P/E leave little margin for guidance misses.

Takeaway

Broadcom pairs rapid custom AI growth with high-margin VMware software cash flows, trading at ~17x forward FY27 earnings. While customer concentration and vendor-financing risks require disciplined sizing, pullbacks toward support offer an attractive risk-reward setup into December earnings.

图片 1,共 1 张
Trade Showcase: Trade, Show & Earn Rewards!
N
NewUser_tXvx48

NVIDIA Corporation $NVIDIA(NVDA.US) trades around $162.85, reflecting a near-term market cap of approximately $3.92 trillion and a trailing P/E ratio near 20.5, well below its historical multi-year average.

Market Position & Valuation

• Core Business: NVIDIA continues to anchor the global AI infrastructure and accelerated computing ecosystem, with deep integration across major hyperscalers and tech builders.

• Compression in Multiples: Sell-side caution and macro shifts have compressed valuation metrics down toward a P/E of ~11–20 depending on forward fiscal projections, causing several major brokerages to revise price targets (ranging roughly between $200 and $230).

Key Risks & Catalysts

• Leadership & Governance Scrutiny: Investor sentiment has turned volatile amid intense board deliberations and public reports surrounding CEO Jensen Huang and executive governance.

• Geographic & Regulatory Shifts: Adjustments in reporting methodologies for overseas demand and export compliance continue to draw regulatory and congressional focus.

• Upcoming Earnings: Near-term price action remains sensitive to upcoming quarterly financial disclosures and guidance updates.

图片 1,共 1 张
Trade Showcase: Trade, Show & Earn Rewards!
N
NewUser_tXvx48

NVIDIA Corporation $NVIDIA(NVDA.US) trades around $162.85, reflecting a market capitalization of roughly $3.92 trillion.

Key Market & Financial Metrics

• Price & Range: Closed at $162.85 (-2.01%), with a 52-week range of $148.80 – $243.37.

• Valuation: Trailing P/E ratio sits near 20.59, making it look cheaper relative to historical multi-year averages as the market prices in cyclical AI infrastructure shifts.

• Fundamentals: TTM revenue stands over $302.97 billion with strong net income margins.

• Upcoming Catalyst: Quarterly earnings are scheduled for November 17, 2026, which will provide updated guidance on data-center demand.

Current Investment Drivers & Risks

• AI Infrastructure Cycle: Wall Street sentiment remains broadly positive (consensus analyst rating leans Buy/Strong Buy with higher-end price targets above $325), though near-term hesitation persists over data-center buildout pacing.

• Geopolitical & Regulatory Headwinds: The stock faces headline pressure from U.S. export controls on AI chips to China and ongoing political scrutiny.

• Support Levels: Technical analysts are closely watching lower bounds near the $150–$170 zone as a key multi-month testing base.

图片 1,共 1 张
Trade Showcase: Trade, Show & Earn Rewards!
N
NewUser_tXvx48

Nvidia (NVDA) stock trades around $166.19, down over 30% from its 52-week high of $243.37 (hit on October 6, 2026), driven by a sharp corporate and macro selloff.

Key Drivers & Analysis

• Leadership & Governance Turmoil: Co-founder and CEO Jensen Huang recently stepped down amid an investigation into personal relationships linked to security scrutiny. CFO Colette Kress has stepped in as interim CEO, raising near-term execution and strategic transition risks.

• Macro & AI Spending Worries: Investor sentiment has cooled due to concerns over high capital intensity, potential data-center deployment delays, and broader political/regulatory shifts.

• Valuation Compression: Following the pullback, Nvidia’s trailing P/E has compressed to roughly 21x, making it look cheaper relative to historical peaks and select semiconductor peers, even as multiple Wall Street firms (including Bernstein and Baird) have trimmed their price targets.

• Upcoming Earnings: Nvidia is scheduled to report its Q3 fiscal 2027 results on November 17, 2026, which will serve as a crucial test for underlying AI chip demand.

图片 1,共 1 张
Trade Showcase: Trade, Show & Earn Rewards!
N
NewUser_tXvx48

Nvidia (NVDA) faces acute governance and national security turmoil after CEO Jensen Huang admitted to an extramarital affair with an executive suspected of Chinese espionage. The scandal has erased over $450 billion in market value this week and pushed the board toward a potential ouster.

The Current Controversy

• Espionage and Affair Fallout. On November 8, Huang admitted to an affair with Alice Huang, an executive at Singapore-based Megaspeed whom U.S. intelligence believes is a Chinese spy. Reports also surfaced of a second relationship with Nvidia VP Kimberly Powell.

• Leadership Crisis. Nvidia’s board hired law firm Wachtell, Lipton, Rosen & Katz to lead an independent probe and is reportedly preparing to oust Huang.

• Legal and Political Pressure. Shareholders filed a class-action lawsuit via Rosen Law Firm alleging securities fraud over hidden Megaspeed ties, while House Republicans threaten subpoenas over potential export control breaches.

Stock Outlook and Analyst Sentiment

• Valuation and Fundamentals. Despite dropping roughly 25% from its October peak, Nvidia trades at an attractive ~22x trailing P/E with 63.7% net profit margins ahead of Q3 earnings on November 17.

• Wall Street Split. While Baird and Bernstein downgraded NVDA to Hold over “key-man risk,” 32 of 35 analysts still rate it a Buy with a $311.17 average target.

图片 1,共 1 张
Trade Showcase: Trade, Show & Earn Rewards!
N
NewUser_tXvx48

Nvidia $NVIDIA(NVDA.US) currently trades at $168.89, down 5.53% today following news of an FBI investigation involving CEO Jensen Huang and a separate probe into his personal conduct. Despite this sudden leadership turbulence, the underlying financials remain fundamentally strong, boasting an annual revenue of $215.94 billion and a massive net income of $120.07 billion for the latest fiscal year.

Financial Health & Key Metrics

• P/E Ratio: 21.34, representing an attractive entry point compared to its multi-year valuation history.

• Margins: Stellar gross margin of 71.07% paired with a net profit margin of 55.60%.

• Market Capitalisation: $4.07 trillion, cementing its role as an AI infrastructure titan.

• Earnings Per Share: Stands at $7.91.

Growth Drivers vs. Executive Risks

The long-term bull thesis relies entirely on Nvidia’s dominant AI chip market share, massive data centre hardware demand, and relentless R&D spending ($18.50 billion). However, the near-term price action will remain volatile as Wall Street digests the risk of executive instability and potential regulatory penalties.

Following the executive probes, Wall Street institutions have taken divergent paths:

• The Bulls: Institutional analysts from firms like Baird and Bernstein maintain price targets up to $500.00, reiterating that core semiconductor demand remains detached from personal scandals.

• The Cautious: Bank of America recently removed Nvidia from its top stock list, and Aletheia Capital downgraded the equity to a “Hold” citing a “$165 billion risk” surrounding leadership stability.

Overall consensus among 35 analysts tracked by Google Finance remains a Strong Buy, boasting an average price target of $327.83—a 75.65% upside from its current depressed trading levels.

图片 1,共 1 张
Trade Showcase: Trade, Show & Earn Rewards!
N
NewUser_tXvx48

📊 NVIDIA Corp $NVIDIA(NVDA.US) is currently trading at $178.67, following a volatile session where it closed down 4.3%. The decline directly bucks a sharp broader market rally. The stock has experienced significant pressure, sliding roughly 25% from its October record highs and erasing hundreds of billions in market value.

🔍 The Controversy & Governance Crisis

The primary catalyst for the recent downturn is a major corporate governance and geopolitical scandal involving CEO Jensen Huang. On November 8, 2026, Huang issued an internal memo admitting to an extramarital affair with Alice Huang, a Chinese businesswoman and former executive at Singapore-based cloud firm Megaspeed.

The situation expanded beyond a personal matter because U.S. intelligence agencies alleged that Alice Huang was recruited by China’s Ministry of State Security to target the CEO. U.S. authorities have been probing Megaspeed over violations of advanced AI chip export restrictions. In response, NVIDIA’s board launched an independent investigation led by outside counsel. While the board explicitly stated there is no evidence that national security or company secrets were compromised, the geopolitical headline risk has introduced a hefty risk premium.

💡 Core Valuation & Market Pressures

• Regulatory & Geopolitical Pressures: Concern over potential changes to AI data center regulations following U.S. midterm elections, alongside 600,000 H200 chips currently stalled in Hong Kong due to Beijing’s import hesitations.

• Compressed Valuation: The recent sell-off has dropped NVIDIA’s forward P/E multiple to a highly attractive 12x–13x fiscal 2028 EPS estimates.

Many analysts view the drop as a sentiment-driven reputational storm rather than a structural threat to demand. The core business fundamentals remain solid, and the board’s massive $235 billion share buyback authorization becomes significantly more accretive at these lower price points.

图片 1,共 1 张
Trade Showcase: Trade, Show & Earn Rewards!
N
NewUser_tXvx48

Nvidia has been in the spotlight recently for various controversies. With the company reporting earnings later this week, it is now an apt time to analyze the stock.

Nvidia Corporation $NVIDIA(NVDA.US) trades around $178.56 ahead of its upcoming quarterly earnings report on November 17, 2026, facing short-term pressure while Wall Street maintains a heavily bullish consensus.

Current Market & Valuation Snapshot

• Share Price & Range: Trading near $178–$181, down from a 52-week high of $243.37 and closer to its 52-week low of $164.27.

• Valuation Multiples: The trailing P/E sits at roughly 23.59, with forward P/E estimates compressed down near 13x–17x depending on calendar assumptions—representing a steep discount compared to historical peaks and broader tech sector averages.

• Analyst Consensus: Out of tracked analysts, roughly 97% recommend a Buy or Strong Buy rating (50% Strong Buy, 47% Buy) with average price targets stretching well above current levels (consensus around $326–$333). Major institutions like Goldman Sachs recently reiterated a Buy rating with a $300 price target.

Key Catalysts & Debates Ahead of Earnings

• Datacenter & Blackwell Demand: Data center revenue drives nearly 90% of Nvidia’s business (growing past triple-digit rates in recent quarters, e.g., 106% jump to $96.2B in Q2). Investors are focused on delivery velocity and customer adoption of the new Blackwell architecture.

• Governance & Regulatory Scrutiny: Near-term sentiment has been weighed down by headline risks, including a board investigation into CEO Jensen Huang and scrutiny over China chip export strategy.

• Macro & Power Visibility: Wall Street is tracking enterprise ROI on AI infrastructure and datacenter power/shell capacity visibility through 2028.

图片 1,共 1 张
Trade Showcase: Trade, Show & Earn Rewards!
N
NewUser_tXvx48

Context

Apple Inc. (AAPL) recently delivered a strong Q4 FY2026 earnings report, posting record September quarter revenue of $114.5 billion (up 12% YoY). Despite robust hardware demand driven by the new iPhone Duo and record Services growth, management issued a rare warning: skyrocketing global memory chip costs will squeeze holiday quarter gross margins down to 45%–46%. This margin pressure, combined with stalling sales growth in Greater China and a rich forward P/E sitting near 37x, has halted the stock’s recent bullish momentum. The equity currently trades at $342.37, down slightly from its new all-time high of $355.38.

My trade

Given the valuation premium and imminent margin compression from component costs, a neutral-to-bearish short-term strategy is optimal. I executed a bear call spread on AAPL, selling the December 2026 $360 call and buying the $365 call for a net credit. This credit-collecting option play capitalizes on the massive institutional options resistance at the $350–$355 range, allowing me to profit from time decay and structural consolidation as the market prices in higher input bills over the holiday season.

Takeaway

Component costs overrule revenue records. Even a massive global ecosystem cannot completely escape hardware supply headwinds. While Apple remains a secular long-term winner due to its highly sticky Services layer and impending Apple Intelligence cycles, near-term upside is capped by severe margin friction. Investors should avoid chasing the stock at all-time highs and wait for pullbacks closer to structural support.

图片 1,共 1 张
Trade Showcase: Trade, Show & Earn Rewards!
N
NewUser_tXvx48

Context

Following its Q3 2026 earnings report, Palantir delivered a masterclass in hyper-growth. Quarterly revenue surged 96% year-over-year to $2.31 billion, driven by U.S. commercial revenue, which exploded 148% to $984 million—surpassing government revenue for the first time. Management confidently raised full-year 2026 revenue guidance to $8.53 billion. The underlying unit economics are highly robust, yielding a 61.7% adjusted operating margin.

Despite these metrics, the stock experienced sharp downward pressure, dropping toward $160.38. Investors are reacting to a significant deceleration in U.S. commercial total contract value (TCV) growth (which slowed to 11% YoY) and anxiety surrounding potential defense budget trims following the recent 2026 midterm elections. Trading at roughly 53 times sales, PLTR commands the steepest valuation premium in the S&P 500, leaving zero margin for error.

My trade

• Strategy: Scaled Dollar-Cost Averaging (DCA) buy.

• Execution: Capitalizing on this 13% weekly post-earnings selloff by building an entry position near the $150–$160 psychological floor. While a forward P/E sitting near 112 presents near-term compression risk, institutional buyers are providing support. Prominent analysts from Barclays and JPMorgan Chase maintain aggressive price targets of $273 and $262 respectively, identifying the company as a definitive enterprise AI platform standard.

Takeaway

Palantir’s underlying business fundamentals are fundamentally strong, but its near-term price behavior remains highly speculative due to institutional re-ratings. The commercial engine is scaling efficiently, though contract backlog duration must improve to protect its multiple. Maintain a medium-term holding period while managing portfolio sizing to weather systemic growth-sector turbulence.

图片 1,共 1 张
Trade Showcase: Trade, Show & Earn Rewards!
N
NewUser_tXvx48

Context

• Financial Strengths: Record annual revenue ($478.83B) and explosive growth in Services. The iPhone remains a dominant cash cow.

• Headwinds: Macro tech sector exposure, internal AI spending cuts, and an executive warning that upcoming gross margins will contract to 45%–46% due to high component expenses.

• Valuation: Trailing P/E sits at a rich 38.33x, showing substantial growth expectations are baked into the current multi-trillion dollar market cap.

My Trade

• Strategy: Capitalize on high near-term volume and buy-the-dip opportunities.

• Action: I would maintain a Hold/Accumulate stance. Look to enter long positions on price drops between $310 and $320 (aligning with historical support zones).

• Parameters: Set a price target at $380 for late 2026/early 2027, with a firm stop-loss at $290 to guard against a deep tech sector valuation contraction.

Takeaway

Apple’s hardware upgrades and ecosystem stickiness continue to generate unmatched cash flows. However, at a P/E approaching 40x, the margin for error is razor-thin. Investors should expect short-term turbulence as the company digests higher memory components. Long-term appreciation remains likely, but entry timing is essential to avoid overpaying for the premium.

图片 1,共 1 张
Trade Showcase: Trade, Show & Earn Rewards!
N
NewUser_tXvx48

Context

Palantir Technologies Inc. (PLTR) has achieved a historic operational milestone, but it arrives alongside a classic Wall Street paradox. In its newly released Q3 2026 earnings report, Palantir’s revenue nearly doubled, surging 96% year-over-year to $2.313 billion, marking its first-ever quarter crossing the $2 billion threshold.

The explosive narrative underpins a fundamental transition: U.S. commercial revenue skyrocketed 148% year-over-year to $984 million, officially surpassing U.S. government revenue ($953 million) for the first time in company history. Powered by its Artificial Intelligence Platform (AIP), Palantir is translating enterprise AI hype into concrete, cash-generating deployment models at a scale the rest of the software sector is struggling to match.

However, despite raising full-year 2026 revenue guidance to ~$8.53 billion (implying 91% annual growth), the stock triggered a aggressive “sell the news” reaction, falling roughly 3% to 6% post-earnings to hover around $170.88.

My trade

1. For Existing Shareholders (The Protection Leg): I recommend implementing a protective collar strategy. With the stock trading around $170, investors can lock in generational gains by buying out-of-the-money put options at the $160 key technical support level while financing the premium by writing out-of-the-money call options near the 52-week high of $212.

Takeaway

Palantir is no longer a speculative concept; it is an foundational piece of global enterprise AI architecture. The Q3 2026 report shifts the entire investment thesis out of the “hope” phase and directly into the “scale” phase.

图片 1,共 1 张
Trade Showcase: Trade, Show & Earn Rewards!
N
NewUser_tXvx48
Featured

Context

Apple Inc. (AAPL) reported solid fiscal Q4 earnings, beating expectations with a record revenue of $114.48B and EPS of $2.10. This success was largely driven by robust iPhone sales. Despite the strong headline results, the stock slid nearly 2% to around $331.90. Investors are reacting negatively to pressured gross margin guidance (projected at 45%–46% due to rising memory chip costs) and slowing growth in its high-margin Services division. Additionally, Apple’s recent annual filing raised caution by highlighting potential legal and reputational risks tied to unpredictable AI agents, dampening near-term momentum.

My Trade

I executed a short-term tactical buy-the-dip order on AAPL at $332.00. While the post-earnings pullback reflects valid concerns over input costs and regulatory headwinds for Services, the primary hardware engine remains exceptionally healthy. The upcoming holiday quarter traditionally serves as a strong seasonal catalyst for Apple, and the stock is finding technical support near its 60-day moving average.

Takeaway

Apple’s core business remains highly profitable, but its elevated trailing P/E multiple demands flawless execution. The near-term narrative will be determined by how effectively Apple manages chip supply constraints and rolls out its Siri AI developer ecosystem.

图片 1,共 1 张
Trade Showcase: Trade, Show & Earn Rewards!
N
NewUser_tXvx48

Palantir Technologies $Palantir Tech(PLTR.US) trades around $173.00, down roughly 6% following recent market volatility ahead of its Q3 2026 earnings report.

Financial and Market Snapshot

• Share Price: ~$173.00 (52-week range: $106.37 – $212.94)

• Market Capitalization: ~$428.5 billion

• P/E Ratio: ~152x trailing earnings

• Recent Performance: Q2 2026 revenue hit $1.935 billion (up 93% year-over-year), driven by 149% growth in U.S. commercial revenue via its Foundry, Ontology, and AIP platforms.

Bullish Case

• AI Momentum: Strong demand for artificial intelligence and sovereign AI deployments across defense, commercial enterprises, and healthcare (e.g., L3Harris, Nvidia partnerships).

• Wall Street Targets: Major firms maintain an upbeat stance; JPMorgan initiated coverage with an Overweight rating and a $262 price target, while the consensus average price target sits near $212–$216.

• Strong Balance Sheet: Zero debt and billions in cash/short-term U.S. Treasury securities.

Bearish Case & Risks

• Rich Valuation: A triple-digit P/E ratio and high price-to-sales multiples leave little room for error if growth slows or macro sentiment shifts.

• Insider Activity: Net insider selling has totaled hundreds of millions over recent quarters.

• Execution & Political Scrutiny: High-profile contracts like the UK’s NHS data platform face ongoing political pressure and long sales cycles in regulated sectors.

Summary

Palantir remains a high-conviction, premium-priced AI leader that acts more like a high-octane growth engine than a conservative portfolio anchor, making it best suited for investors with a high risk tolerance and a long-term horizon. Given its steep triple-digit P/E valuation, buying the stock at all-time highs exposes you to sharp, sentiment-driven corrections; however, its robust debt-free balance sheet and explosive U.S. commercial growth provide a solid fundamental floor.

图片 1,共 1 张
Trade Showcase: Trade, Show & Earn Rewards!
N
NewUser_tXvx48

Context

Micron Technology (MU) reported record-breaking performance for the full fiscal year 2026, punctuated by a blockbuster Q4 report showing $133.19 billion in full-year revenue (up 256% year-over-year) and non-GAAP net income of $86.76 billion. Driven by an insatiable demand for AI-specific memory hardware—particularly High Bandwidth Memory (HBM) and data center SSDs—the company has officially guided for tight structural supply extending into fiscal 2027 and 2028.

However, despite these monstrous fundamental metrics, the stock has experienced significant near-term pressure. General macroeconomic jitters and algorithmic “sell the news” behavior regarding heavy capital expenditures ($20 billion+ directed toward production scaling) have pulled the stock roughly 30% below its summer highs. It currently trades around the $885–$930 range, presenting a textbook divergence between exceptional earnings power and macro-driven multiple compression.

My trade

• The Action: I am building a long-term long position via scale-in tranches at current levels ($880–$930).

• The Rationale: At its current price, MU trades at a highly compressed ~5x to 5.5x forward fiscal 2027 earnings. This is remarkably cheap compared to the tech peer median P/E of roughly 28x. The market is mispricing this as a typical, fleeting cyclical peak. However, more than 35% of Micron’s revenue through 2030 is already insulated by multi-year, take-or-pay strategic customer agreements. This structurally shifts Micron from a highly volatile commodity chipmaker to an indispensable, highly predictable infrastructure pillar of the AI buildout.

Takeaway

Ignore the short-term noise surrounding high capital expenditures; in a capacity-constrained market, aggressive spending guarantees market share longevity. While traditional consumer sectors (like PCs and smartphones) remain soft, the data center tailwinds are strong enough to completely carry the business.

图片 1,共 1 张
Trade Showcase: Trade, Show & Earn Rewards!
N
NewUser_tXvx48

Investment Thesis

Microsoft $Microsoft(MSFT.US) remains the premier commercial enterprise compounder. My primary recommendation is to Buy and hold MSFT for long-term growth. The stock seamlessly pairs stable, high-margin legacy software suites with a high-growth cloud computing juggernaut.

Financial & Growth Drivers

• Accelerating Cloud Growth: In Q1 FY2027 (ended Sept 30, 2026), revenue jumped 19% YoY to $92.3 billion, beating estimates. The driving force is Azure, which accelerated to 48% YoY growth.

• Surging Backlog: Commercial Remaining Performance Obligations (RPO) skyrocketed to $677 billion. This immense pipeline reflects locked-in corporate demand, with roughly 30% converting to revenue within the next 12 months.

• High Profitability: Operating margins sit at an exceptional ~50%. Net income reached $36.6 billion ($4.92 GAAP EPS).

Key Counter-Thesis Risks

• CapEx Constraints: To support next-gen AI, Microsoft expects calendar year 2026 capital expenditures to reach ~$170 billion. Investors must monitor whether AI monetization scales fast enough to justify this capital intensity.

• Lagging Consumer Units: While the enterprise division shines, consumer units are soft; Xbox hardware fell 14% and Windows OEM/devices dropped 22% in the latest quarter.

• Valuation Premium: Trading at a forward P/E of 26.9x, the stock prices in near-perfection.

Strategic Rationale

While massive AI infrastructure costs pose margin risks, Microsoft’s structural discipline—including aggressive cost control like offering voluntary buyouts to up to 60,000 employees—ensures free cash flow remains resilient.

图片 1,共 1 张
Trade Showcase: Trade, Show & Earn Rewards!
N
NewUser_tXvx48

Amazon ($Amazon(AMZN.US)) is currently trading near $240.80 following a ~7% post-earnings decline triggered by its Q3 2026 financial report. While operations remain resilient, intensive capital expenditures into artificial intelligence infrastructure have introduced near-term cash flow volatility, testing investor sentiment.

Core Drivers & Financial Health

• AWS Acceleration: Amazon Web Services (AWS) grew revenue 39.3% year-over-year to $46 billion. Management expects >40% growth in 2027 and 2028, targeting a $1 trillion cloud revenue run rate within 5–10 years.

• Profitability Milestones: Total revenue rose 12% to $201.94 billion. The company achieved its highest-ever group operating margin at 13.9%, yielding an operating income of $28.1 billion.

The Core Risk: Capex & Cash Flow Outflows

• AI Capex Pressures: Amazon held its massive 2026 capital expenditure target at $220 billion to fund data centers and custom Trainium/Graviton chips.

• Negative Free Cash Flow: This aggressive infrastructure build-out resulted in a trailing 12-month free cash flow outflow of $42.4 billion, a stark shift from the positive $14.8 billion cash generation seen in prior periods.

Valuation & Outlook

• Historical Multiples: Despite a small Q3 earnings miss ($1.89 EPS vs. $1.96 consensus), the stock pullback pushes its valuation to 24x forward earnings—an 80% discount to its 5-year historical median.

• Wall Street Stance: Consensual brokerage sentiment remains a Strong Buy with an average price target near $330, implying over 35% upside potential from current depressed levels.

图片 1,共 1 张
Trade Showcase: Trade, Show & Earn Rewards!
N
NewUser_tXvx48

Microsoft $Microsoft(MSFT.US) remains a premier secular growth engine, trading at $531.01 with a $3.94 trillion market cap. Its Q1 FY2027 earnings report highlights absolute dominance in enterprise software and infrastructure.

Financial Health & Hyper-Growth

• Earnings Beat: Revenue surged 19% to $92.28 billion; EPS hit $4.89, crushing consensus.

• Azure Surge: Azure revenue grew 48%, fueled by massive enterprise AI adoption.

• Cash Machine: Generated $18.6 billion in free cash flow with a stellar 49.8% operating margin.

Strategic Catalysts & Risks

• AI Monetization: Recorded $10 billion in quarterly revenue from OpenAI arrangements.

• Efficiency Gains: Copilot users rose 50% YoY, optimizing GPU token returns.

• Capex Headwinds: Capital expenditures hit $45.2 billion and will surpass $50 billion next quarter, limiting intermediate FCF expansion.

Valuation & Outlook

Trading at 29.5x trailing earnings, MSFT is highly attractive for its compounding power. Wall Street maintains a strong “Buy” consensus with an average price target near $596 ($580–$600 post-earnings upgrades). Microsoft is a definitive Top Pick Core Long, offering the safest profile and highest visibility of monetization in the AI value chain.

图片 1,共 1 张
Trade Showcase: Trade, Show & Earn Rewards!
N
NewUser_tXvx48

With Q3 2026 earnings dropping tomorrow (Oct 29), Wall Street is hyper-focused on Big Tech’s crown jewel. The stock has been trading sideways lately, up ~10% this year, but the underlying engines are roaring. Here is your quick, no-nonsense breakdown.

📈 The Bull Case: Hyper-Growth Cloud & AI

• AWS Reacceleration: Cloud growth surged to an explosive 37% YoY in Q2. Analysts think it could touch 40%+ this quarter driven by aggressive generative AI enterprise adoption.

• Sold Out Through 2027: CEO Andy Jassy revealed that most of AWS’s cloud computing capacity is already booked out through 2027. The demand is real.

• High-Margin Ads: Amazon’s advertising business continues to grow at a mid-20% clip, cushioned further by lucrative Prime Video live sports.

• Wall Street Backing: Institutional analysts are overwhelmingly bullish, carrying a consensus target near ~$325 (representing a ~23% upside from current levels).

📉 The Bear Case: The $220 Billion Capex Burden

• Cash Flow Squeeze: Amazon is spending a jaw-dropping ~$220B in capital expenditures this year to construct AI data centers. This aggressive infrastructure spend has pushed trailing free cash flow into negative territory.

• Margin Headwinds: Massive spending means rising depreciation costs will weigh down reported operating margins over the next few quarters, even if the top-line grows.

• Valuation: Trading at a forward multiple around 24x, it carries a premium valuation that leaves little room for a Q3 earnings miss.

💡 The Verdict

Amazon isn’t just buying growth; its $496B backlog proves customers are waiting in line. If AWS hits the high-30s or low-40s tomorrow, the stock could easily break out toward $300+. But if capex Guidance spikes higher without matching near-term revenue, expect a short-term pullback.

图片 1,共 1 张
Trade Showcase: Trade, Show & Earn Rewards!
N
NewUser_tXvx48

Microsoft Corp (MSFT) is trading at $532.60, rebounding sharply from mid-year pullbacks and approaching its 52-week high of $553.72. The tech giant enters its fiscal Q1 2027 earnings report on October 28 with immense fundamental momentum.

Bull Case & Catalyst Growth

• Cloud Dominance: Azure cloud revenue remains the primary growth engine, expanding by 41% year-over-year in fiscal 2026 and crossing the $100 billion milestone for the first time.

• Enterprise AI Commercialization: Microsoft 365 Copilot has surpassed 30 million paid seats, demonstrating that customer demand continues to outpace available infrastructure capacity.

Bear Case & Strategic Risks

• CapEx Intensity: Projected capital expenditures of $175 billion for calendar 2026 are putting intense pressure on near-term free cash flow conversion.

• Consumer Stagnation: Deeper hardware declines persist, with third-quarter global PC shipments tumbling 20.1% year-over-year.

My Trade Strategy

Given the high options implied volatility ahead of the October 28 earnings announcement, my trade is to avoid buying the stock at these peak levels and instead deploy a Bull Put Spread. Specifically, selling the $500 put and buying the $480 put expiring in November allows me to capture high premium while utilizing the strong horizontal support floor at $500. This strategy generates attractive yield if MSFT consolidates or moves higher, while defining risk in case massive AI capital expenses trigger a temporary earnings pullback.

图片 1,共 1 张
Trade Showcase: Trade, Show & Earn Rewards!