

 Rate Of Return
Investment is the survival of the fittest. To make money, you first need to know whose money you're making. Logic Investment Market Review 240506


Key points of this article:
𝒪 Performance of various assets last month
𝒪 Trading opportunities this month
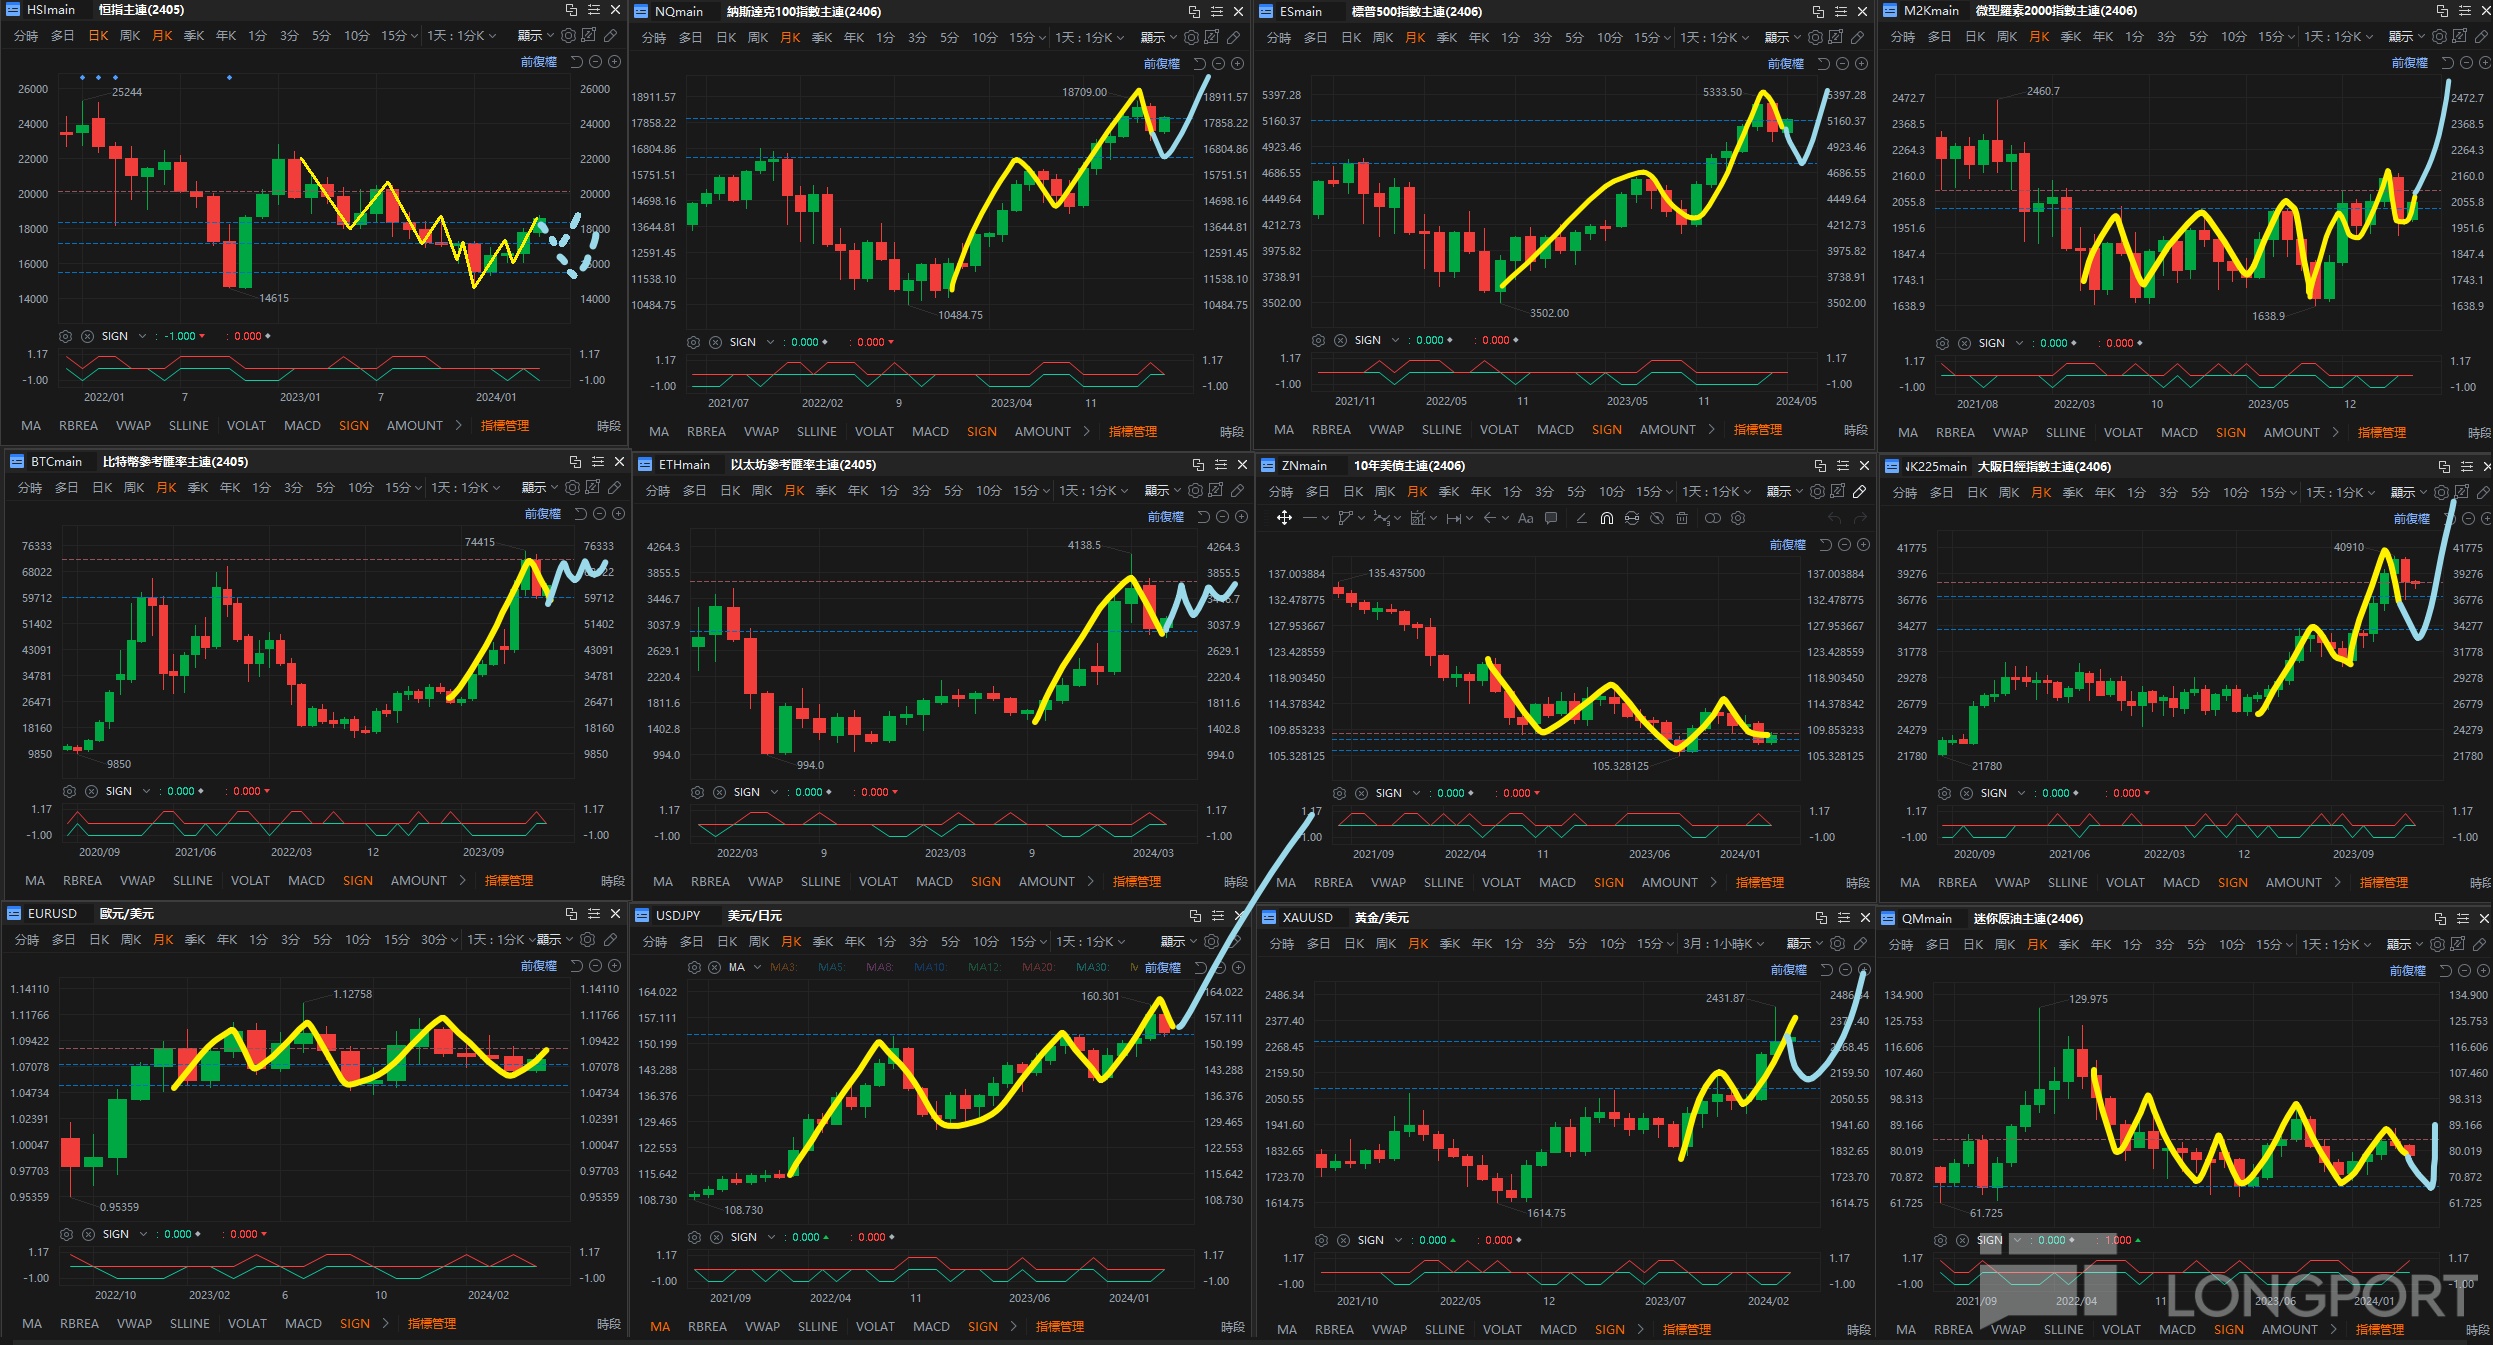
For high-definition images, please visit: https://logicinvestmenthk.notion.site/240506-8ac14b4ce99c4c31b98ec91beac06ad6?pvs=4
◉ Asian Markets—Hang Seng Index surges sharply, Nikkei adjusts from highs
Hang Seng Index futures rose by nearly 1,149 points in April, a gain of 6.93%, making it the strongest performer among the assets we monitor.
On the monthly chart, the futures even broke through the previous support-turned-resistance level of 18,330, potentially reversing the downtrend.
On the long-term chart, I believe the chances of directly breaking through 20,000 are slim, but a rise to around 19,000 followed by a pullback is not impossible, so I wouldn’t consider going short so quickly.
For the bulls, I have two scenarios:
- A pullback to around 17,200, forming a head-and-shoulders bottom before resuming the upward trend. If this scenario plays out, the ideal timeline would be for the correction to start between June and July, ending in Q3 before the uptrend resumes.
- A pullback to around 15,500, forming a double bottom before resuming the upward trend. If this scenario plays out, the ideal timeline would be for the correction to start between June and July, ending in Q4 before the uptrend resumes.
As for short-term trading, the monthly chart suggests a strong bullish trend recently, so it’s best to follow the trend and look for long positions, but exit quickly.
Our members know that trades executed on the 15-minute chart rarely last overnight.
Nikkei 225 futures fell by 2,080 points in April, a drop of 5.13%, with the lowest point at 36,710.
Last week, we mentioned that Japan might rebound near 36,550, but the daily chart gradually shifted to a consolidation pattern when the actual price was still 200 points away from the prediction.
If the rebound happens immediately instead of pulling back to around 33,920, the Nikkei would become very strong, even stronger than the Hang Seng Index.
However, long-term traders should be aware of currency risks—the yen continues to depreciate, though this has little impact on short-term speculation.
◉ U.S. Markets—The extent of the pullback is disappointing
In April, Nasdaq futures fell by 5.18%, S&P 500 futures dropped by 4.7%, and Russell 2000 futures declined by 7.61%.
First conclusion: Small-cap stocks in the U.S. are still the unloved stepchildren—they rise less than the broader market during good times and fall more during bad times.
As for why the pullback is disappointing, it’s because it’s still far from our desired entry points (Nasdaq: 16,450; S&P: 4,600–4,770), and there’s no panic in the market. Most star stocks have only experienced minor corrections.
Like the Nikkei, if the market turns upward in May and breaks new highs, the trend would be extremely strong, a carnival for bulls.
The monthly chart for 10-year U.S. Treasury futures shows a clear head-and-shoulders bottom pattern.
Even better, the daily chart has just formed a head-and-shoulders bottom and successfully broken out.
I believe the market reflects fundamentals ahead of time, so if there’s a long opportunity in Treasuries, it suggests the market is increasingly betting on an imminent Fed rate cut.
◉ EUR/USD—Still in consolidation range
The euro fell by 1.21%, continuing to fluctuate within its range.
If you look at the moving averages, you’ll see the price constantly crossing them, a clear sign of consolidation.
I prefer to view 1.06 as the best entry point for long positions, so it’s not yet time for long-term deployment.
◉ USD/JPY—Breakout from pullback pattern
In early April, we noted an attractive ascending triangle pattern in USD/JPY.
Subsequently, the price officially broke out, rising by 4.27% for the month and becoming our most profitable trade recently.
However, the Bank of Japan intervened in the first week of May, curbing the depreciation trend and forming a breakout-pullback pattern, offering a better risk-reward entry opportunity.
Fundamentally, I don’t think Japan will continue intervening, and the Fed is still some time away from cutting rates.
As long as the technicals hold, I’ll stay long on USD/JPY with a target of 180.
Of course, the precondition is that May doesn’t see a major breakdown.
◉ Cryptocurrencies—Breakout fails, no support in pullback
In April, Bitcoin futures fell by 15.94%, and Ethereum futures dropped by 17.62%.
Stock investors might break into a cold sweat seeing these numbers, but for crypto traders, it’s just another day.
Like U.S. and Japanese stocks, neither cryptocurrency has pulled back to key support levels, so it’s too early to call the bottom.
At least both leaders are still near highs, and the trend remains bullish.
For shorter-term traders, going long is simpler.
On the monthly chart, we’re hoping for an ascending triangle pattern.
◉ Gold—Long upper shadow doesn’t hinder upward trend
Gold peaked at 2,431 last month but pared gains, ending up only 2.3%.
The long upper shadow in April indicates strong resistance above, so we expect May to be a correction month.
But don’t overlook the accumulated buying pressure over the past months—even if the price falls to 2,090 in May, we remain steadfast long-term bulls.
◉ Crude Oil—Head-and-shoulders top
Crude oil formed a bearish candle with an upper shadow in April, falling 1.98%.
Combined with the head-and-shoulders top pattern, this is a very bearish signal.
Barring any special circumstances, like a worsening Middle East situation affecting supply, we expect crude oil to fall to 67.3 in the coming months.
◉ To Profit, First Find Your Counterparty
Here’s a recent thought.
A mentor recently told me that to make money in the market, you must first identify who will lose to you and exploit their mistakes.
Your counterparty could be uninformed retail investors, traders with less research depth than you, or funds forced to adjust positions due to rules.
The fund angle reminds me of Japanese stock god CIS, who once mentioned in his book that he would strategize around potential special events.
For example, he noted that the TOPIX index (not the Nikkei 225) favors large-cap stocks and excludes high-priced stocks to avoid distorting the index.
So, if TOPIX ever changed its methodology, he would buy large-cap stocks en masse, betting they’d be included in the index.
After inclusion, he’d sell them to funds forced to track the index.
In short, finding a weaker counterparty is crucial.
Can you identify who your counterparty is in your current trading strategy?
The copyright of this article belongs to the original author/organization.
The views expressed herein are solely those of the author and do not reflect the stance of the platform. The content is intended for investment reference purposes only and shall not be considered as investment advice. Please contact us if you have any questions or suggestions regarding the content services provided by the platform.
