

 Rate Of Return
Beginners can make money in the U.S. stock market by learning this pattern first. Logic Investment Market Review 240616

Key points of this article:
𝒪 The breakout of a converging ascending triangle is a buying pattern that even beginners can recognize, with good odds, and is particularly useful in a long-term rising market like the U.S. stock market.
◉ The go-to technical pattern for beginners: Converging Ascending Triangle Breakout
This is a trading strategy I've used since my beginner days and still employ today. Many mentors charge specifically to teach this basic trading pattern.
Since it doesn't require advanced technical skills, I'll explain it simply.
As the name suggests, a converging ascending triangle breakout occurs when the price tops remain at a horizontal level while the bottoms gradually rise over time, eventually leading to a breakout.
From a core logic perspective, the horizontal tops indicate strong selling interest among holders at that level.
On the other hand, the rising bottoms suggest eager buyers who can't wait for prices to drop to previous lows, rushing to enter the market.
This signals an increasingly imbalanced market. When supply is exhausted but demand remains high, prices can surge rapidly.
To improve success rates, consider:
- The breakout candle should have a large body and high volume.
- The breakout should occur at an all-time high.
- More instances of rising bottoms are better.
- Larger timeframes are preferable, though smaller ones are common.
- Works best with U.S. stocks.
Think about what kind of stocks typically meet these conditions.
◉ Two examples
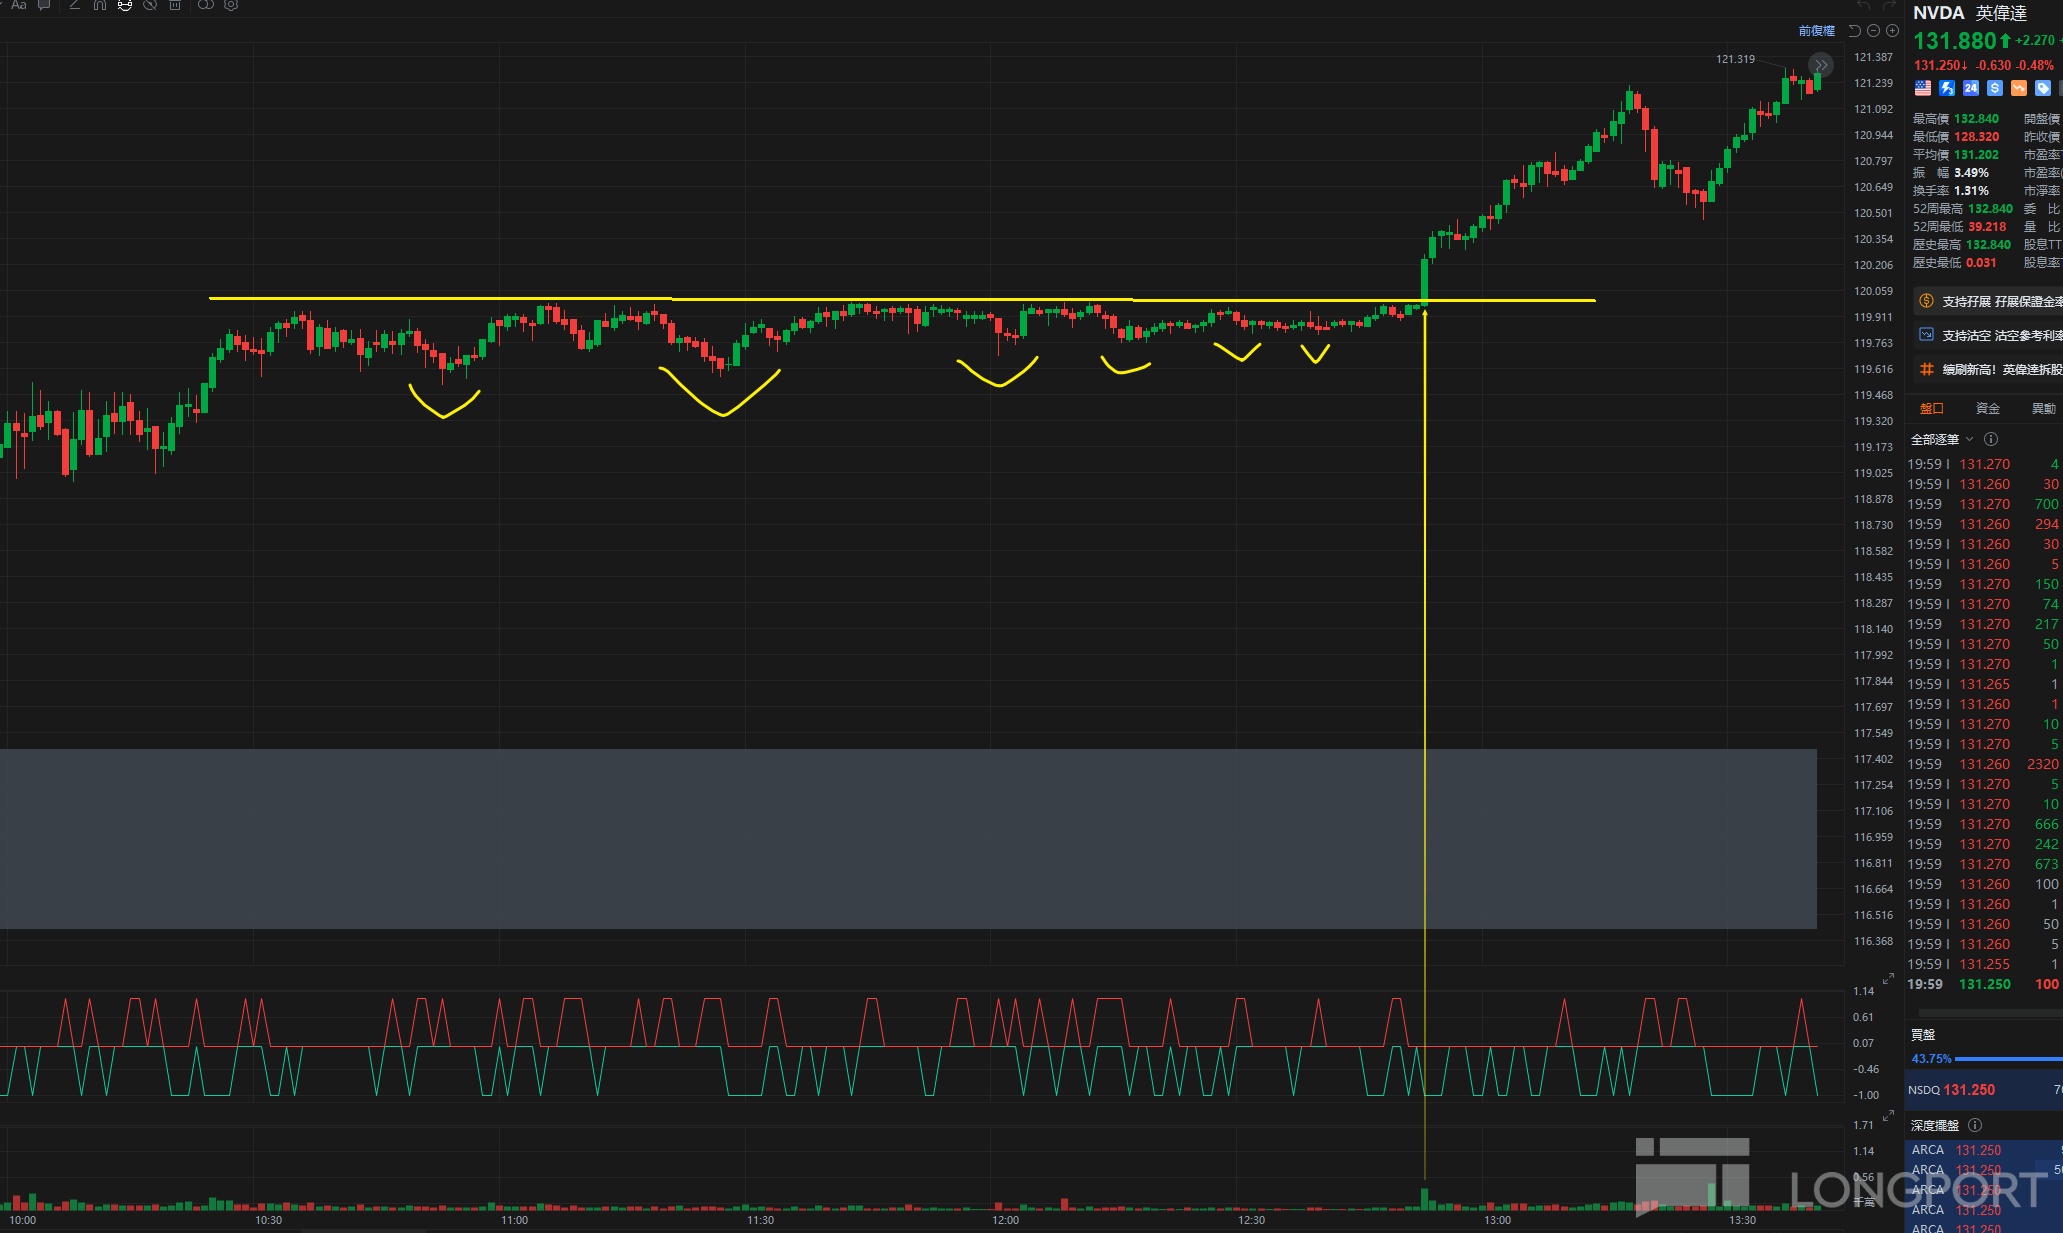
NVDA 1-minute chart
On June 5th, the price consolidated for three hours before breaking out with a large bullish candle.
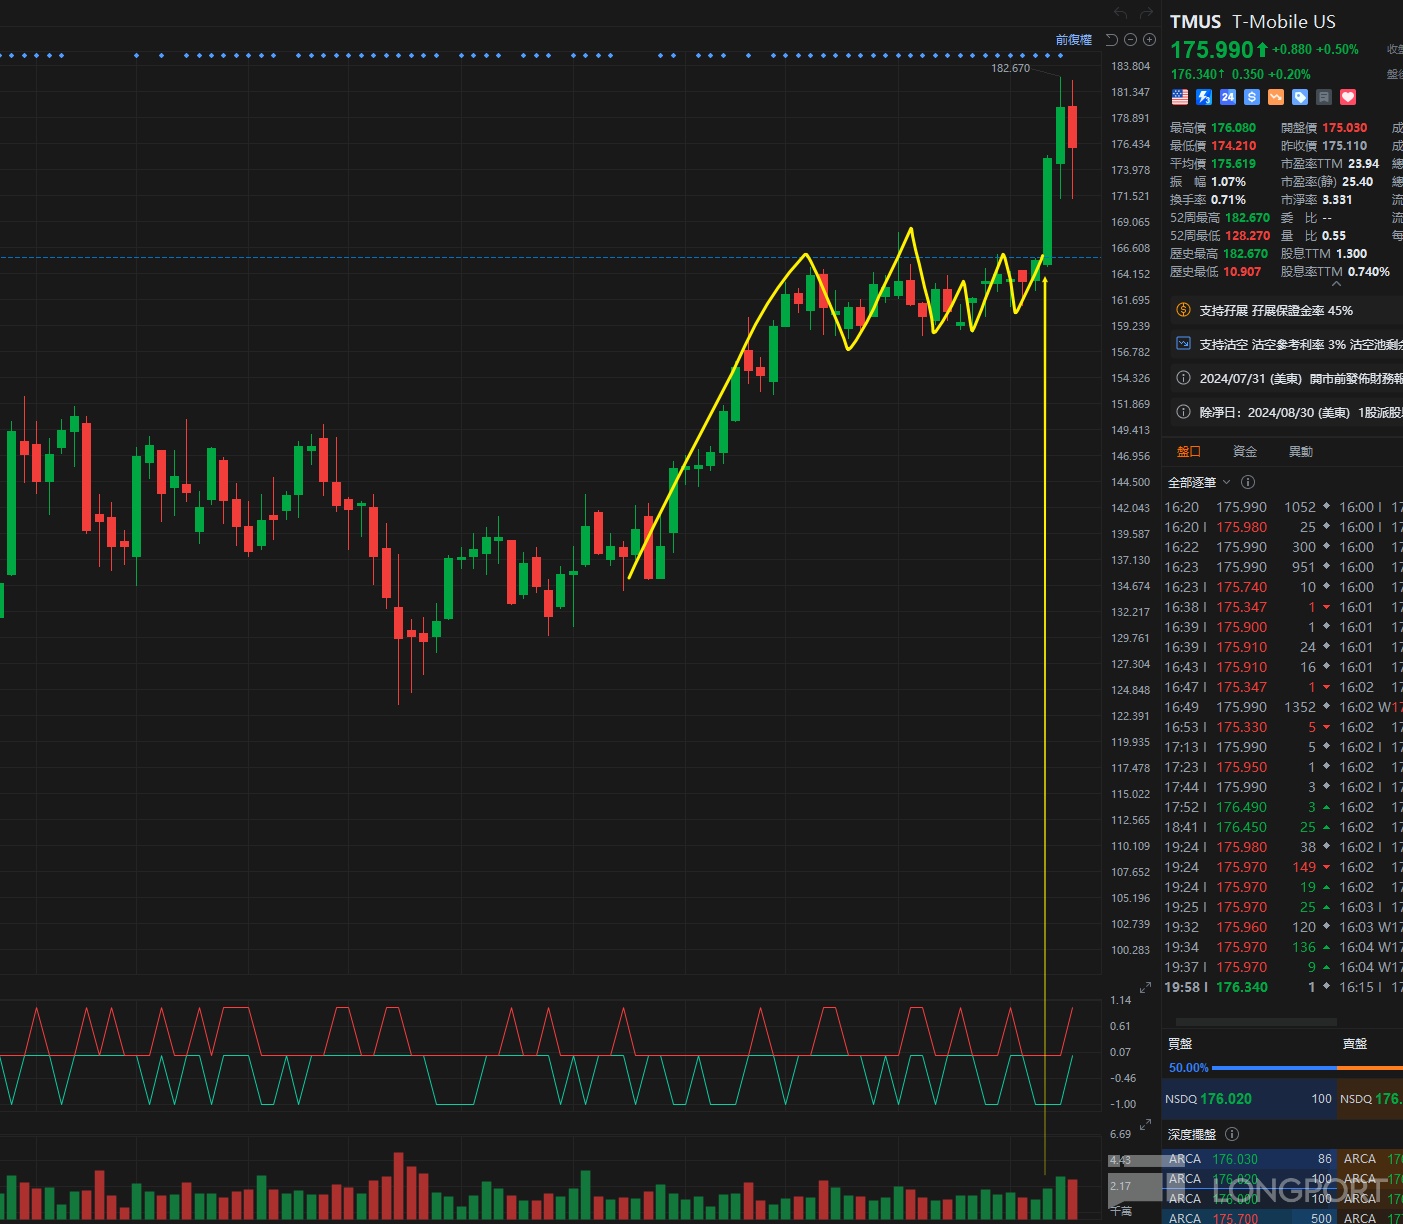
TMUS weekly chart
Before breaking out in late May, it also showed an ascending triangle pattern.
Investors who want to analyze charts together and improve are welcome to join our free Discord & Telegram groups to share and discuss.
I'll also publish a more detailed explanation on my fan page in the future.

◉ Hong Kong & Japan Markets—Double Bottom and Consolidation
Readers across channels have asked about the Hang Seng Index's bottom. My consistent answer: At least a double bottom is needed.
A V-shaped rebound isn't impossible, but it's unlikely and lacks identifiable patterns.
A double bottom, however, provides clear reference points, as it reflects prior selling pressure absorption.
This time, whether it stabilizes at the previous low or forms a 2B pattern (breaking and quickly recovering), we'll have a clear stop-loss level before entering.
Thus, I'm watching Tuesday's performance at 18,000 points.
If it forms a lower shadow and closes above 18,000, I'll be eager to go long.
Meanwhile, the Nikkei remains in a tight range. With rising support, a breakout above 38,990 seems increasingly likely—a good long opportunity.
◉ U.S. Market—New Highs Again
U.S. stocks continue their rally, with Nasdaq and S&P futures hitting new highs.
Note: The gap on the chart is due to June futures rollover.
In this resistance-free zone, predicting a top is a low-probability gamble.
For individual stocks, as noted in our member logs, large caps remain the focus.
U.S. bonds, after breaking support last week, rebounded sharply for five days and reached new highs.
The current trend is chaotic—not ideal for entry.
◉ EUR/USD—Breaking Support
After breaking support, EUR/USD plunged further. Despite Friday's rebound, it failed to reclaim support, confirming the downtrend.
However, prices are back at long-tested lows, creating uncertainty.
◉ USD/JPY—Potential Ascending Pattern
USD/JPY retested resistance at 157.9 this week, possibly forming a converging ascending triangle.
◉ Crypto—Breaking Support
Bitcoin and Ethereum both broke key support levels, weakening their trends.
Bitcoin's major support is near 65,000; Ethereum's is around 3,320—key levels for potential longs.
◉ Gold—Choppy Movement
After breaking support with a large bearish candle last Friday, gold hovered near 2,300.
This aligns with a two-month support zone—a stronghold for bulls.
Recent daily charts don't suggest a good entry.
◉ Oil—Potential Inverse Head-and-Shoulders
Oil reclaimed support, forming a potential bullish pattern. Watch for entry opportunities at 76.5.
The copyright of this article belongs to the original author/organization.
The views expressed herein are solely those of the author and do not reflect the stance of the platform. The content is intended for investment reference purposes only and shall not be considered as investment advice. Please contact us if you have any questions or suggestions regarding the content services provided by the platform.
