

 Rate Of Return
Whether the U.S. stock market is turning bearish or not, the first thing to look at is this pattern. A logical review of the market 240624.


Key points of this article:
𝒪 The US stock market is currently experiencing only a short-term pullback, with the overall trend remaining strong.
𝒪 A confirmed short-term bearish pattern would only be established if US stocks fail to break through previous highs again.
HD image: https://logicinvestmenthk.notion.site/240624-4e63fe1d95f34f788fa2b9668705779f?pvs=4
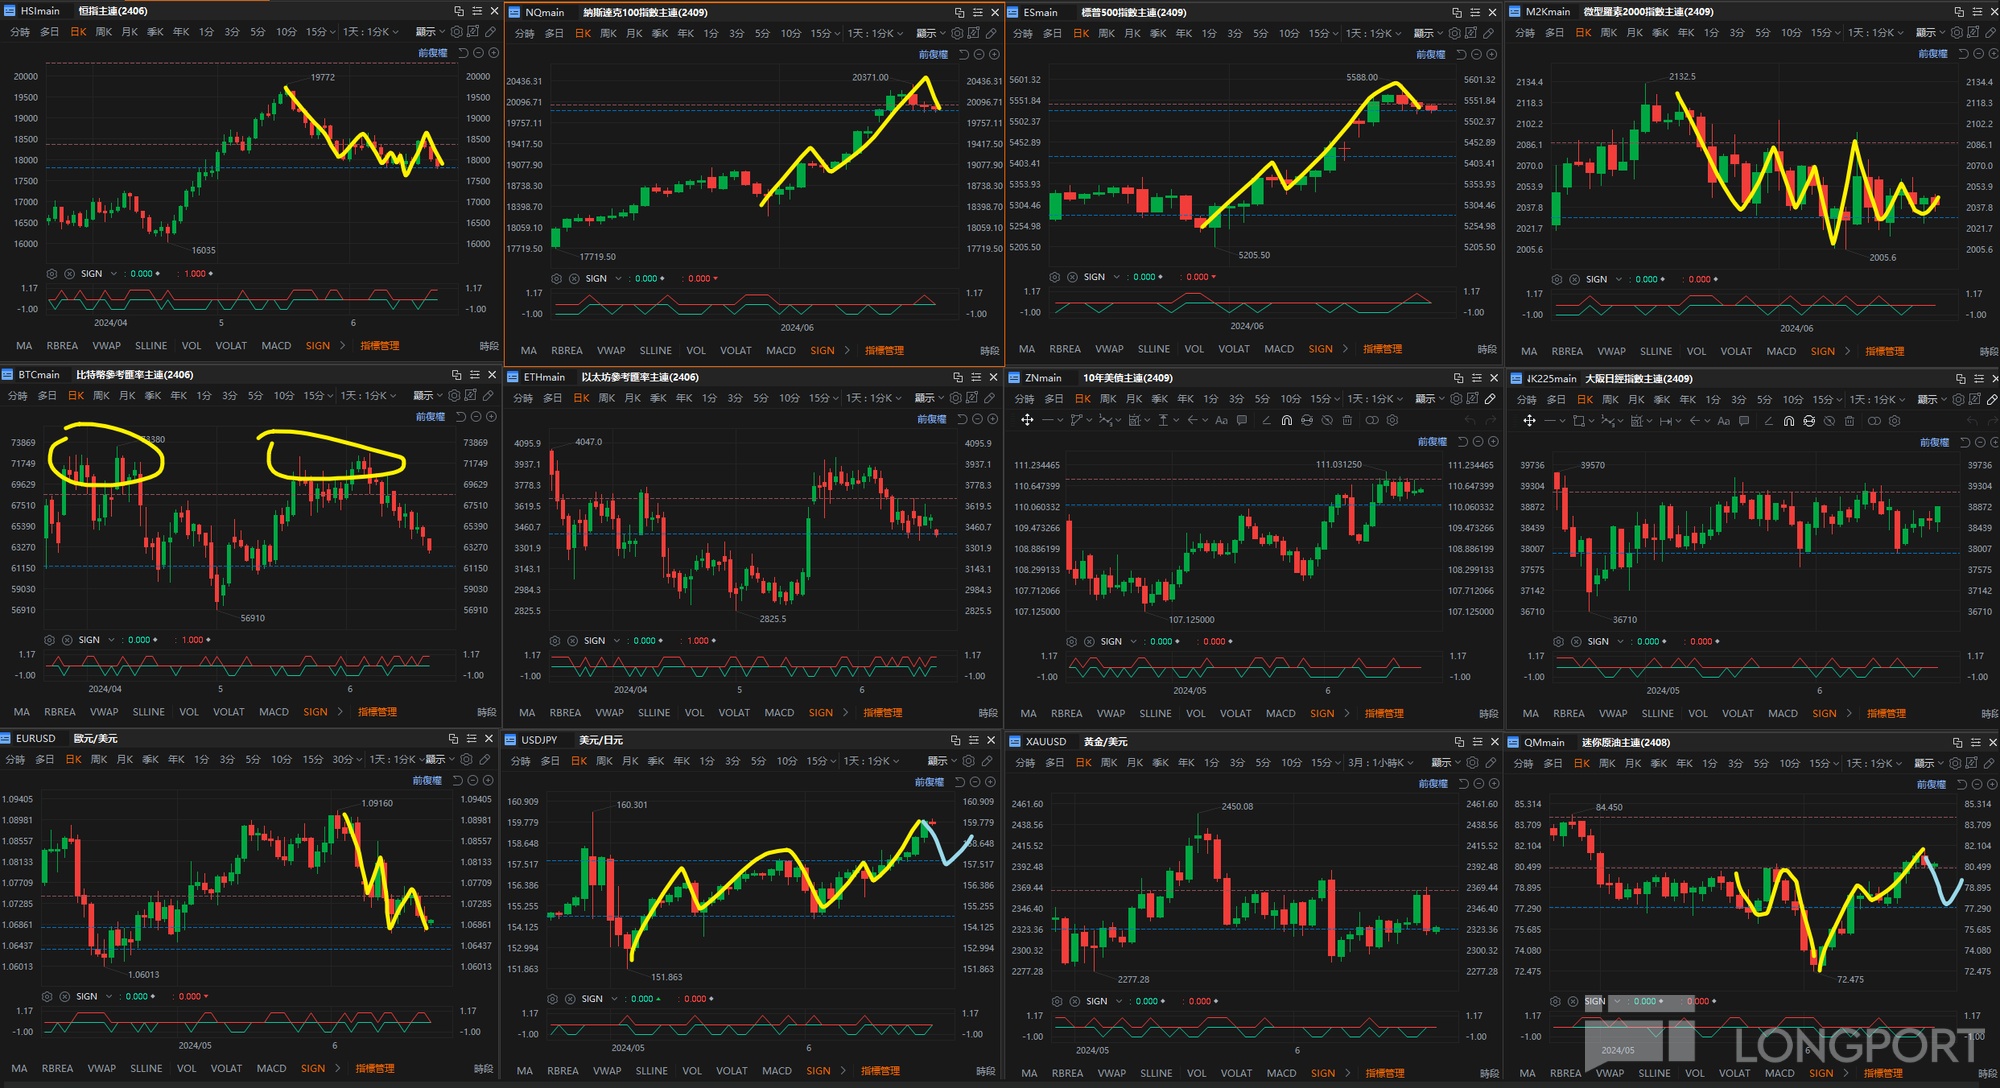
◉ Hong Kong & Japan Markets - Head and Shoulders Bottom and Consolidation Range
Last week we mentioned that the Hang Seng Index needed a double bottom for a more bullish outlook, and on Monday we saw an extremely bullish candlestick that dipped then recovered to support level, followed by a strong bullish breakout to the range top on Wednesday.
After starting to pull back on Thursday, it has now fallen to the previous bottom level, forming a head and shoulders bottom pattern.
This is a more reliable bullish pattern than a double bottom, so we'll continue focusing on buying opportunities around 17900.
The Nikkei 225 has been fluctuating between 37910 and 39180 for two months, showing clear consolidation.
Currently in the middle of the range with no clear bullish or bearish bias.
◉ US Market - Minor Pullback
After nearly a month of bullish gains, US stocks have finally seen more significant declines.
However, unless you're a day trader, it's still too early to go short as this is just a necessary correction within an upward trend.
To confirm weakness like we saw in March, we'd need to see prices fail when retesting previous highs.
Whether it's a double top or 2B pattern, these are what bears want to see.
Therefore, bulls shouldn't worry excessively at this stage.
The Russell 2000 continues to underperform the Nasdaq and S&P 500, indicating market focus remains on the latter's components.
US Treasuries are oscillating narrowly at high levels.
◉ EUR/USD - Breaking Support
EUR/USD is forming a consolidation pattern between 1.0686 and 1.0744.
Given the previous clear downtrend, bottom-fishing here carries significant risk.
We prefer going long after breaking through 1.074 and seeing a pullback.
◉ USD/JPY - Breaking Resistance
Our last review mentioned USD/JPY was forming a bullish pattern.
Indeed, prices successfully broke resistance and may reach new highs, with our positions showing substantial profits.
A pullback to 157.7 would present the next long entry point.
◉ Cryptocurrencies - Weak Performance
Cryptocurrencies have shown weak performance recently, with Bitcoin forming multiple tops around 73000 while Ethereum failed to break its all-time high.
Comparatively, Ethereum shows slight signs of stabilization.
61300 and 3400 will be our focus levels for long positions.
◉ Gold - Consolidation Range
Gold's recent movement has been relatively flat, with the consolidation range so narrow it's almost equivalent to daily candle fluctuations.
Moreover, while there's a head and shoulders bottom pattern, last Friday's large bearish candle indicates increased bearish pressure.
Exercise caution when looking for long opportunities.
◉ Crude Oil - Clear Rebound to Resistance Zone
Crude oil has risen continuously and just reached previous resistance levels, where we anticipate a pullback.
Watch for entry opportunities around 77.
The copyright of this article belongs to the original author/organization.
The views expressed herein are solely those of the author and do not reflect the stance of the platform. The content is intended for investment reference purposes only and shall not be considered as investment advice. Please contact us if you have any questions or suggestions regarding the content services provided by the platform.
