
#Bitcoin market analysis: After half a year of volatility, is BTC about to "turn bullish"?

$Strategy(MSTR.US) $Coinbase(COIN.US) $NVIDIA(NVDA.US)Today's post exceeded 1,000 words, so it's a long one. Hahaha~
Today is October 12th, and the #Bitcoin market has entered a critical phase. Let's analyze it.
First of all, today's analysis is extremely valuable—every word is worth its weight in gold. Don't regret missing it! Bitcoin's market has entered a crucial stage, and today we'll discuss its trend during this phase. The analysis is packed with insights, so don't forget to share, like, and comment if you enjoy it! Let's "share the opportunity" together. If you're not a fan, no worries—you're always welcome to come back and check it out!
Looking back to mid-March this year, after I accurately identified 73.7k as the 阶段性顶部, Bitcoin seemed to have taken a "sedative,"横盘震荡 for half a year. This period was a classic "triple three-wave" sideways adjustment. Think it's the market's "calm period"? Actually, it's quietly 积蓄力量, ready to surge at any moment! After reading the following analysis, you'll understand the secret behind this move.
Now, let's get to the point. The question all Bitcoin traders face now is: When will Bitcoin's adjustment end? When will the next bull market arrive?
Today, we boldly 假设—Bitcoin's sideways adjustment may already be over! We're in the early stages of a bull market 起点! Yes, that confident. Why? Here's the analysis—
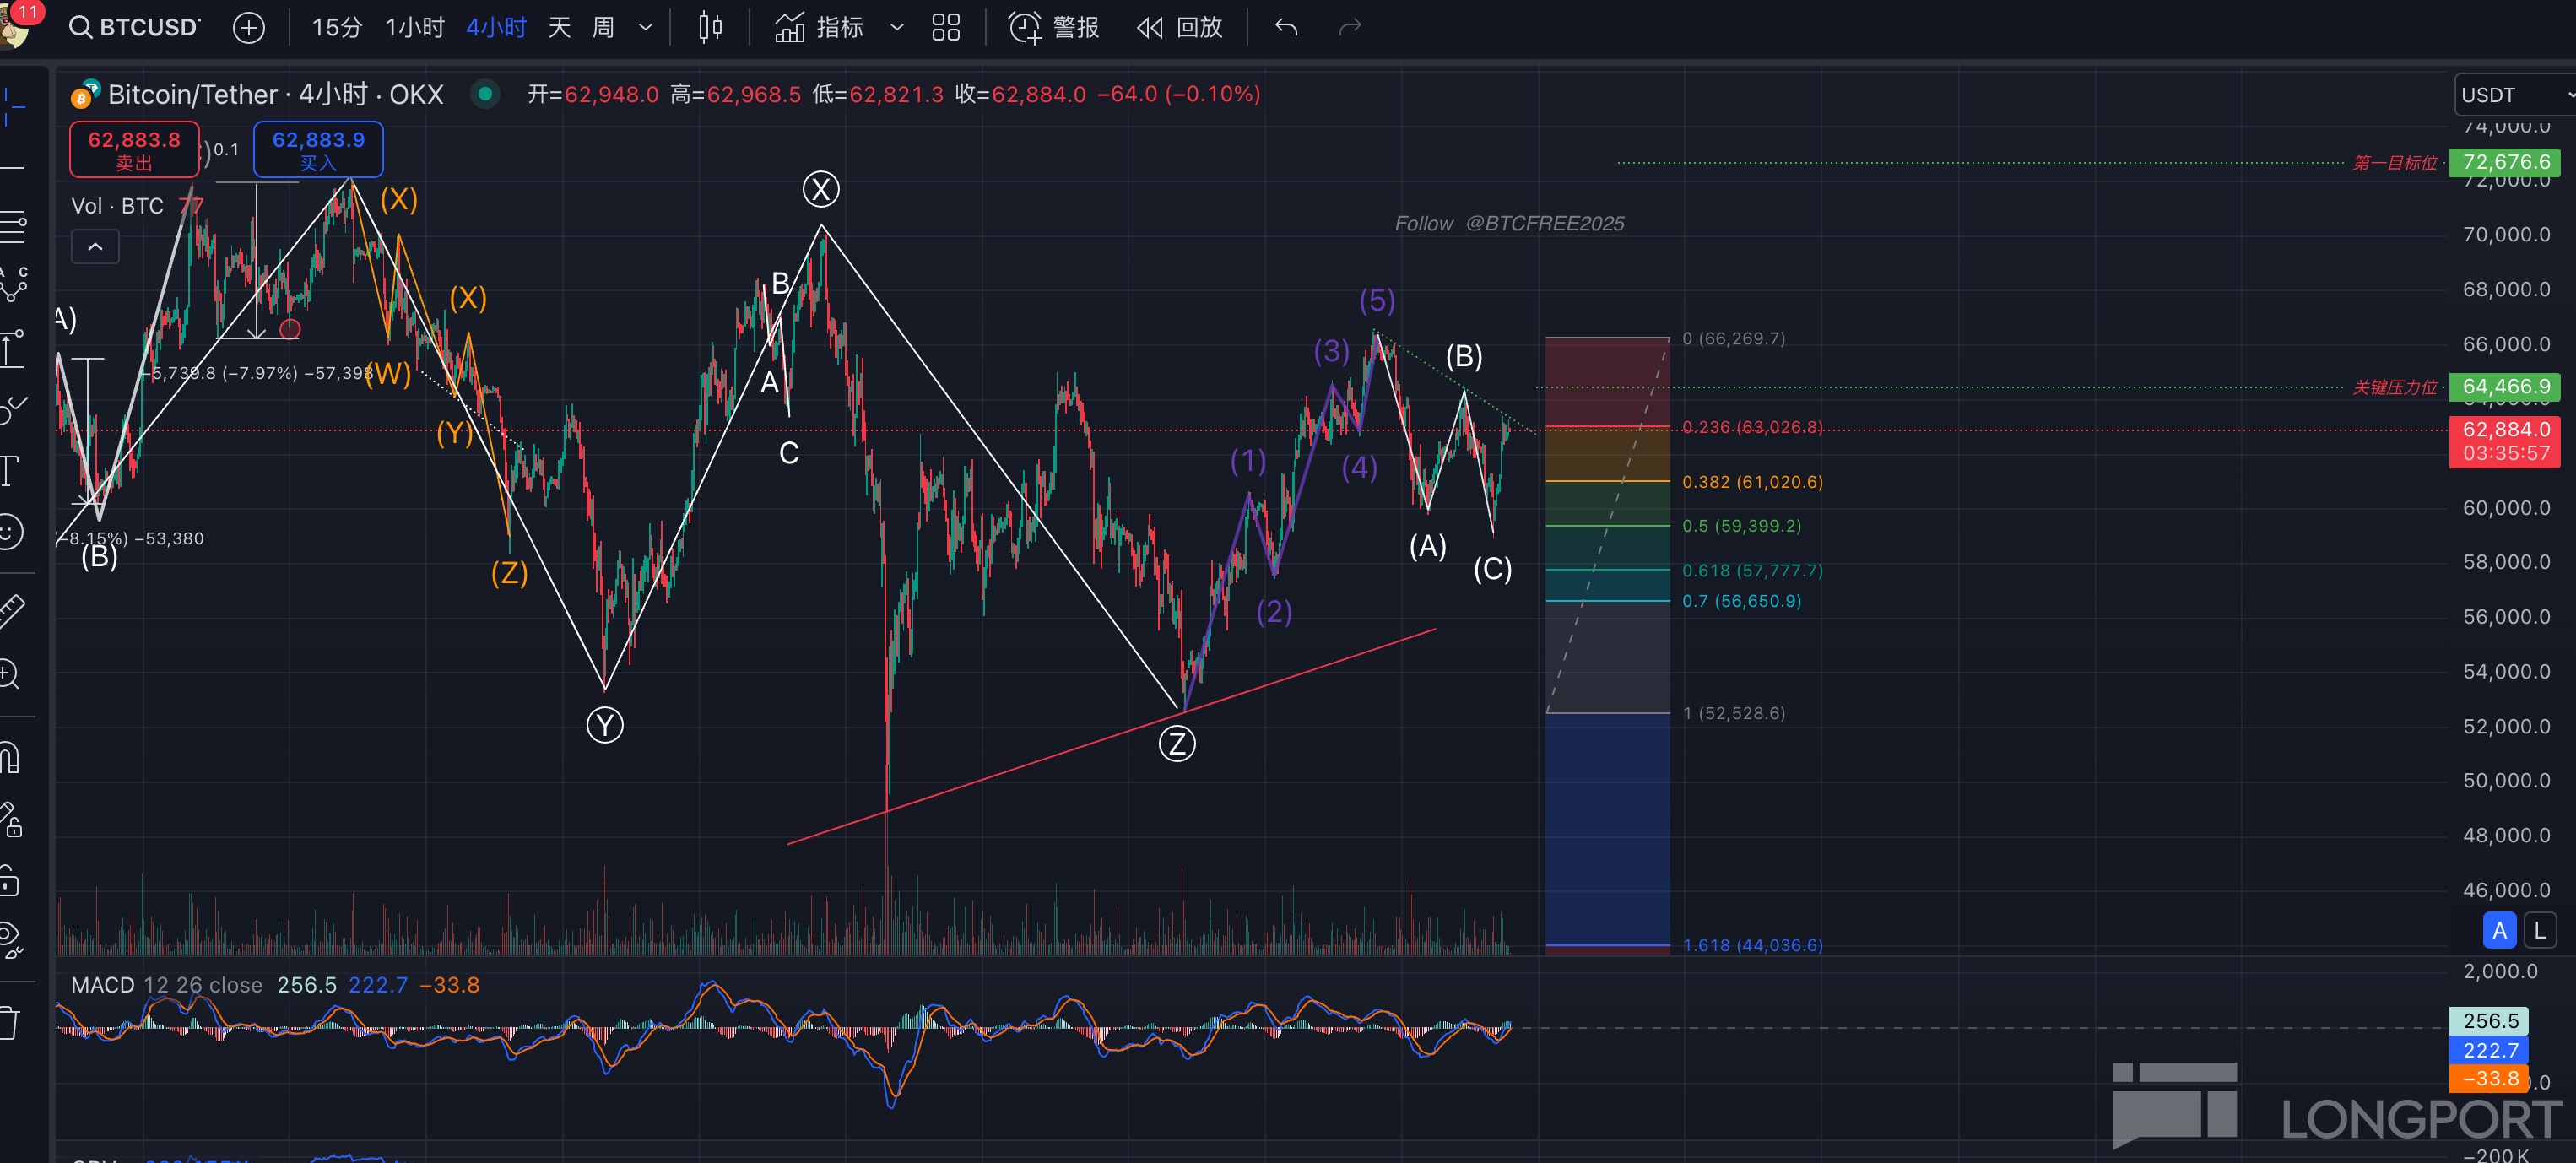
Since the March peak of 73.7k, we believe Bitcoin has undergone a typical triple three-wave 横向调整 (marked as wxyxz, indicated by the white 主浪线 in the chart). Based on the current trend, wave z likely concluded around 52.5k. Starting from 52.5k, a five-wave 上升结构 has emerged, numbered 12345 (marked by the purple line in the chart), followed by a typical ABC 锯齿型调整 (marked by the white line in the chart). 58.9k is highly likely to be the end of this adjustment, and Bitcoin has a high probability of entering the next 上升推动浪. Starting to feel excited?
Of course, no one can 完全预测 how the market will ultimately move. But we can use the following "观测神器" to determine whether the market has truly entered the 主升浪:
Break through the green 虚线压力位: Observe the green 虚线压力位 of purple 5 and white B. If it's effectively 突破, congratulations—the probability of a 主升浪 skyrockets!
Monitor the 突破 of white B wave 顶点: If the white B wave 顶点 is successfully 突破, it basically confirms—the bull market has "departed" again. Don't get left behind!
Target price 参考:
No "盲目乐观" here. If the market enters the 主升浪, here are two target prices for reference.
First target: 72.6k (marked by the green 虚线 in the chart). Breaking this point should be a breeze.
Second target: 81.1k (marked by the red 虚线 in the chart). This is a higher goal—if reached, it's truly "Bitcoin taking you to the moon"!
In short, Bitcoin's adjustment may already be over. Now, it's all about whether it will lead us into a new bull market. Let's count our profits together in this bull market! 💰💸
The above is for technical analysis 交流 only and not for 实盘交易参考!
The copyright of this article belongs to the original author/organization.
The views expressed herein are solely those of the author and do not reflect the stance of the platform. The content is intended for investment reference purposes only and shall not be considered as investment advice. Please contact us if you have any questions or suggestions regarding the content services provided by the platform.
