

 Traded Value
Image source: gs, interpretation: llm
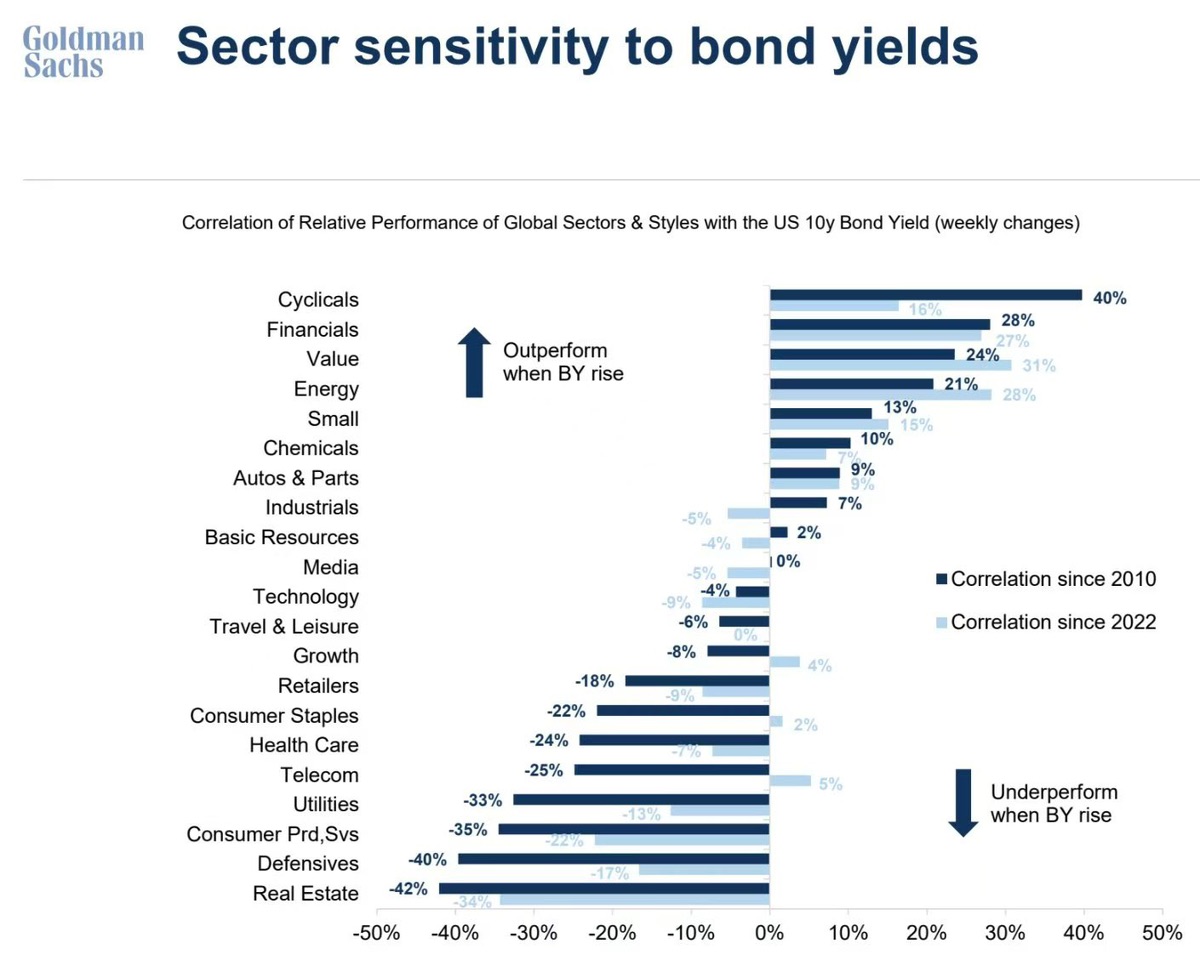
This chart shows the performance correlation of different global industries and styles relative to the weekly changes in the U.S. 10-year Treasury yield. The bar chart represents the correlation percentages since 2010 and since 2022. A positive value indicates that when the 10-year Treasury yield (BY) rises, the sector outperforms the market average, while a negative value indicates underperformance.
Here are some key points from the chart:
1. Outperforming the market (when BY rises):
• Cyclicals: Since 2010, the correlation was 40%, and since 2022, it was 16%, indicating that cyclical sectors generally perform well when Treasury yields rise.
• Financials: Since 2010, the correlation was 28%, and since 2022, it was 27%, showing that the financial sector also performs well when Treasury yields rise.
• Value: Since 2010, the correlation was 24%, and since 2022, it was 31%, indicating that value stocks perform well when Treasury yields rise.
• Energy: Since 2010, the correlation was 21%, and since 2022, it was 28%, showing that the energy sector also performs well when Treasury yields rise.
2. Underperforming the market (when BY rises):
• Real Estate: Since 2010, the correlation was -42%, and since 2022, it was -34%, indicating that the real estate sector generally underperforms when Treasury yields rise.
• Defensives: Since 2010, the correlation was -40%, and since 2022, it was -17%, showing that defensive sectors underperform when Treasury yields rise.
• Consumer Products & Services: Since 2010, the correlation was -35%, and since 2022, it was -22%, indicating that the consumer products and services sector underperforms when Treasury yields rise.
• Utilities: Since 2010, the correlation was -33%, and since 2022, it was -13%, showing that the utilities sector underperforms when Treasury yields rise.
The copyright of this article belongs to the original author/organization.
The views expressed herein are solely those of the author and do not reflect the stance of the platform. The content is intended for investment reference purposes only and shall not be considered as investment advice. Please contact us if you have any questions or suggestions regarding the content services provided by the platform.
