

 Rate Of Return
How to respond to the band when trend lines of different rates are broken through

"With a logical response plan in place, you can patiently wait for similar market conditions to unfold and apply the plan while managing risks."

Recently, the market has been under continuous impact from tariff disputes. For daily swing traders, the significant gaps caused by news have distorted daily charts,
rendering technical analysis ineffective on these distorted charts. The only option is to patiently wait for the charts to stabilize—either for the gaps to fill or for clearer trends to emerge before making decisions.
In such highly volatile conditions, intraday traders are better suited to capitalize on large price swings.
Cai Ma previously practiced swing trading on stock index futures, avoiding overnight positions and sticking to intraday trades. However, due to childcare responsibilities, she no longer has time to monitor the market and can only occasionally track and validate her ideas.
This has helped her identify a suitable daily swing trading strategy for the Hang Seng TECH Index (HSTECH.HK) based on the breakout of trendlines with different slopes. Here’s the plan:
01—Strategy After Trendline Breakouts
First, note that this plan works for me but may not suit you—please use discretion.
Cai Ma categorizes trendlines into accelerating (slope > 60°) and moderate (slope ~45°).
The strategy outlines actions for breakouts of both types. As previously discussed,
the logic is: Breaking an accelerating trendline doesn’t end a bullish trend but signals slower momentum. A reversal becomes likely only if resistance forms near prior highs. A confirmed reversal requires breaking the moderate trendline and prior lows.
Thus, after breaking an accelerating trendline, you can still trade with the trend but must watch for consolidation signals (failure to make new highs/lows) and breaks of the moderate trendline.
Breaking the moderate trendline increases reversal odds—watch for consolidation signals and breaks of prior highs/lows.
The derived strategy is illustrated below: Left shows bullish trendline breaks; right shows bearish breaks (timeframes vary—choose your primary one carefully).
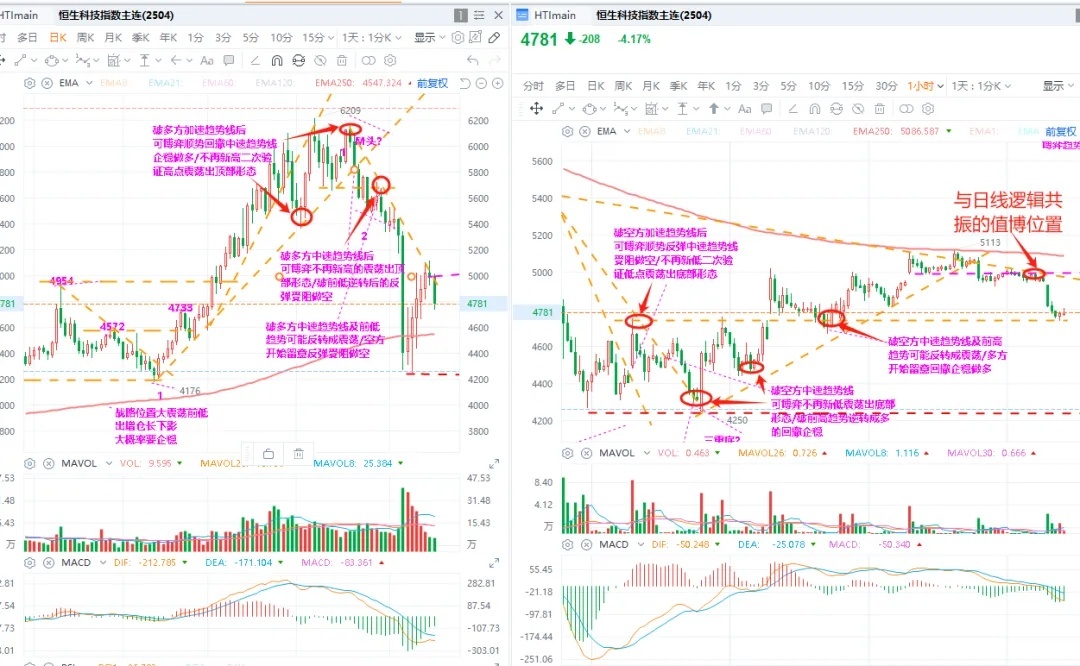
Bullish reversal plan: After breaking the accelerating trendline, trade pullbacks to the moderate trendline for longs/watch for double-top patterns if new highs fail.
Breaking the moderate trendline suggests shorting on failed rallies or breakdowns below prior lows. Reverse for bearish scenarios.
Currently, HSTECH.HK’s daily chart remains bearish—trade pullback shorts.
The 1-hour chart flipped bearish today, aligning with the daily trend. Shorts are viable after breaking the bullish trendline and prior lows, then retesting resistance.
Given recent tariff-driven volatility, intraday profits at key levels are substantial even without overnight risk.
In summary: With a logical plan, you can methodically apply it to similar conditions while managing risk.
Note: This is a swing trader’s perspective—neither exhaustive nor infallible. Use discretion.
02—Weekly Market Recap
Now, let’s review three key indices: FTSE China A50 (A50), Hang Seng Index (HSI), and Hang Seng TECH Index (HSTECH.HK):
1. FTSE China A50 Index
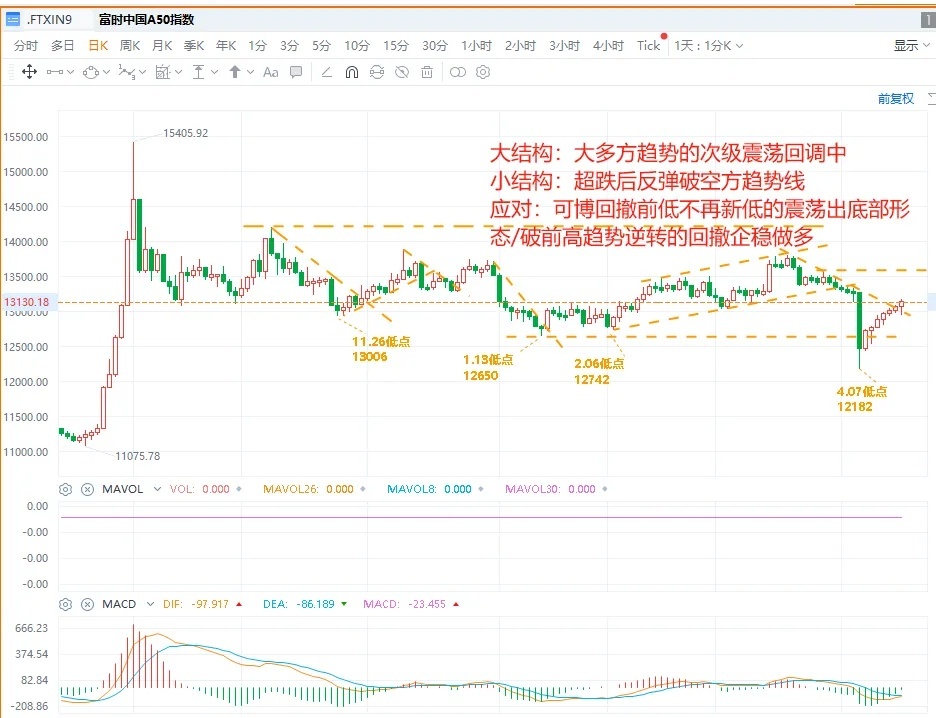
Despite tariff-driven new lows, A50’s daily chart remains in a bullish wide-range correction.
Short-term, it broke a minor downtrend line.
For swing traders: After breaking the moderate bearish trendline, watch for bottoming patterns (W-bottom/inverse H&S) or go long on pullbacks after breaking prior highs.
2. Hang Seng Index
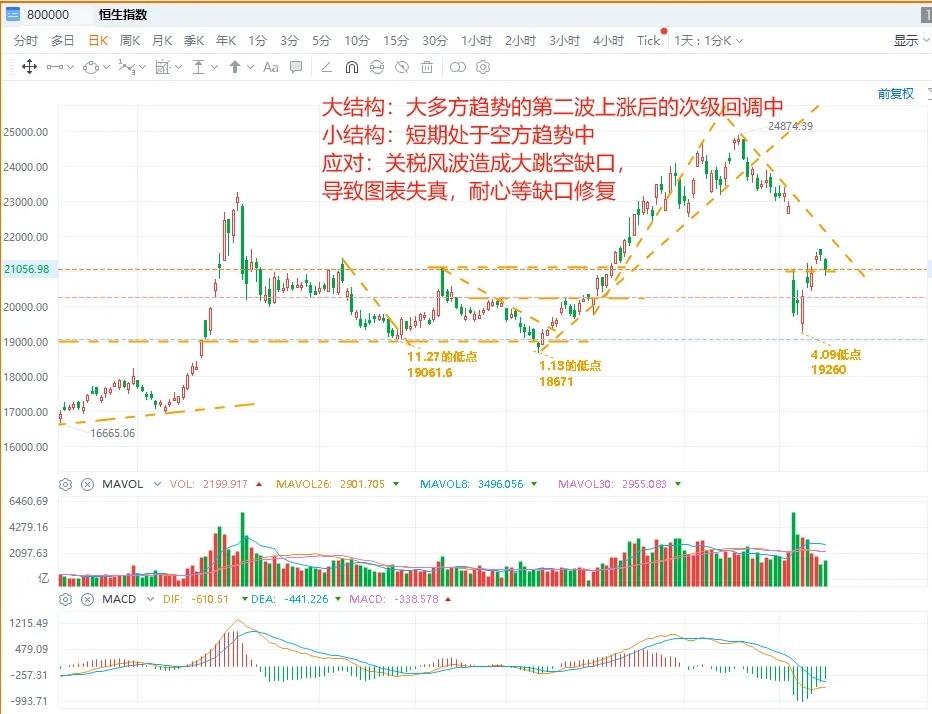
HSI’s major trend stays bullish (above the Jan 13 low) but is correcting after a second rally. Minor bearish trendlines exist,
but tariff-induced gaps distort daily charts. Swing traders must wait for stabilization; intraday traders aren’t affected.
3. Hang Seng TECH Index
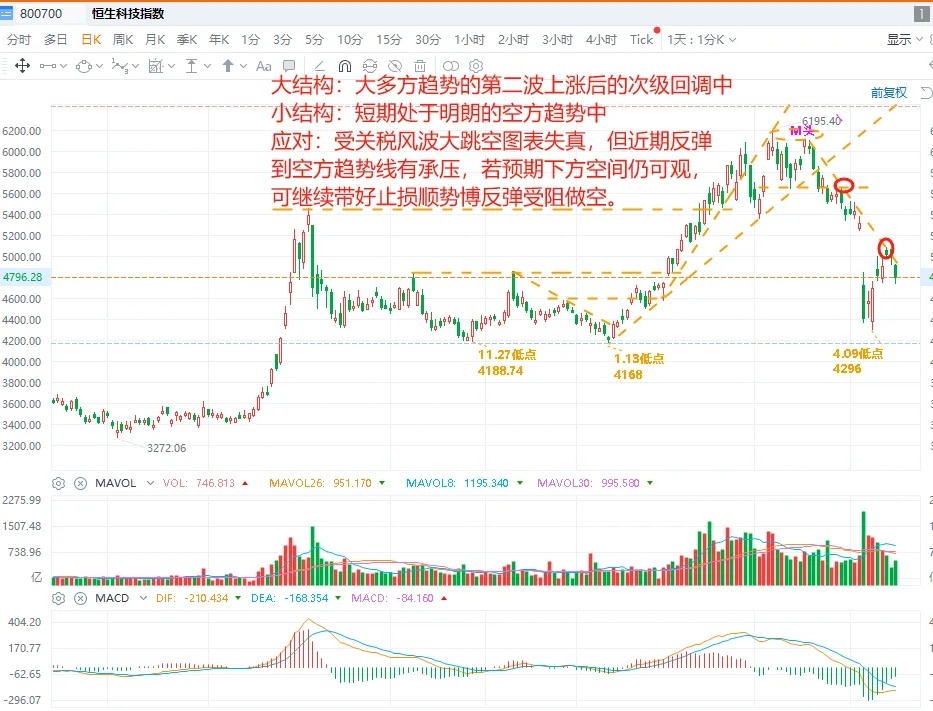
HSTECH.HK’s major trend is also bullish (above Jan 13 low), but short-term trends are clearly bearish.
Unlike HSI, recent rebounds show resistance at bearish trendlines—making it analyzable for swing traders.
If downside potential seems limited, wait for breaks of short-term bearish trendlines before acting.
Note: This is a swing trader’s perspective—use discretion.
Hope this helps. See you next time.
Disclaimer: This shares Cai Ma’s trading framework—not advice. Mentioned assets aren’t recommendations. Markets are risky; invest wisely.$Hang Seng TECH Index(STECH.HK)
The copyright of this article belongs to the original author/organization.
The views expressed herein are solely those of the author and do not reflect the stance of the platform. The content is intended for investment reference purposes only and shall not be considered as investment advice. Please contact us if you have any questions or suggestions regarding the content services provided by the platform.
