

The capital sentiment behind Pop Mart's investment bank holdings data

Adding an observation on Pop Mart recently. I looked at the distribution of broker holdings. The Stock Connect holdings in Hong Kong stocks have increased from 14% to about 16% across nearly 20 exchanges, with a net inflow of over 6 billion yuan. Basically, foreign investors are shorting, while domestic investors are bullish.
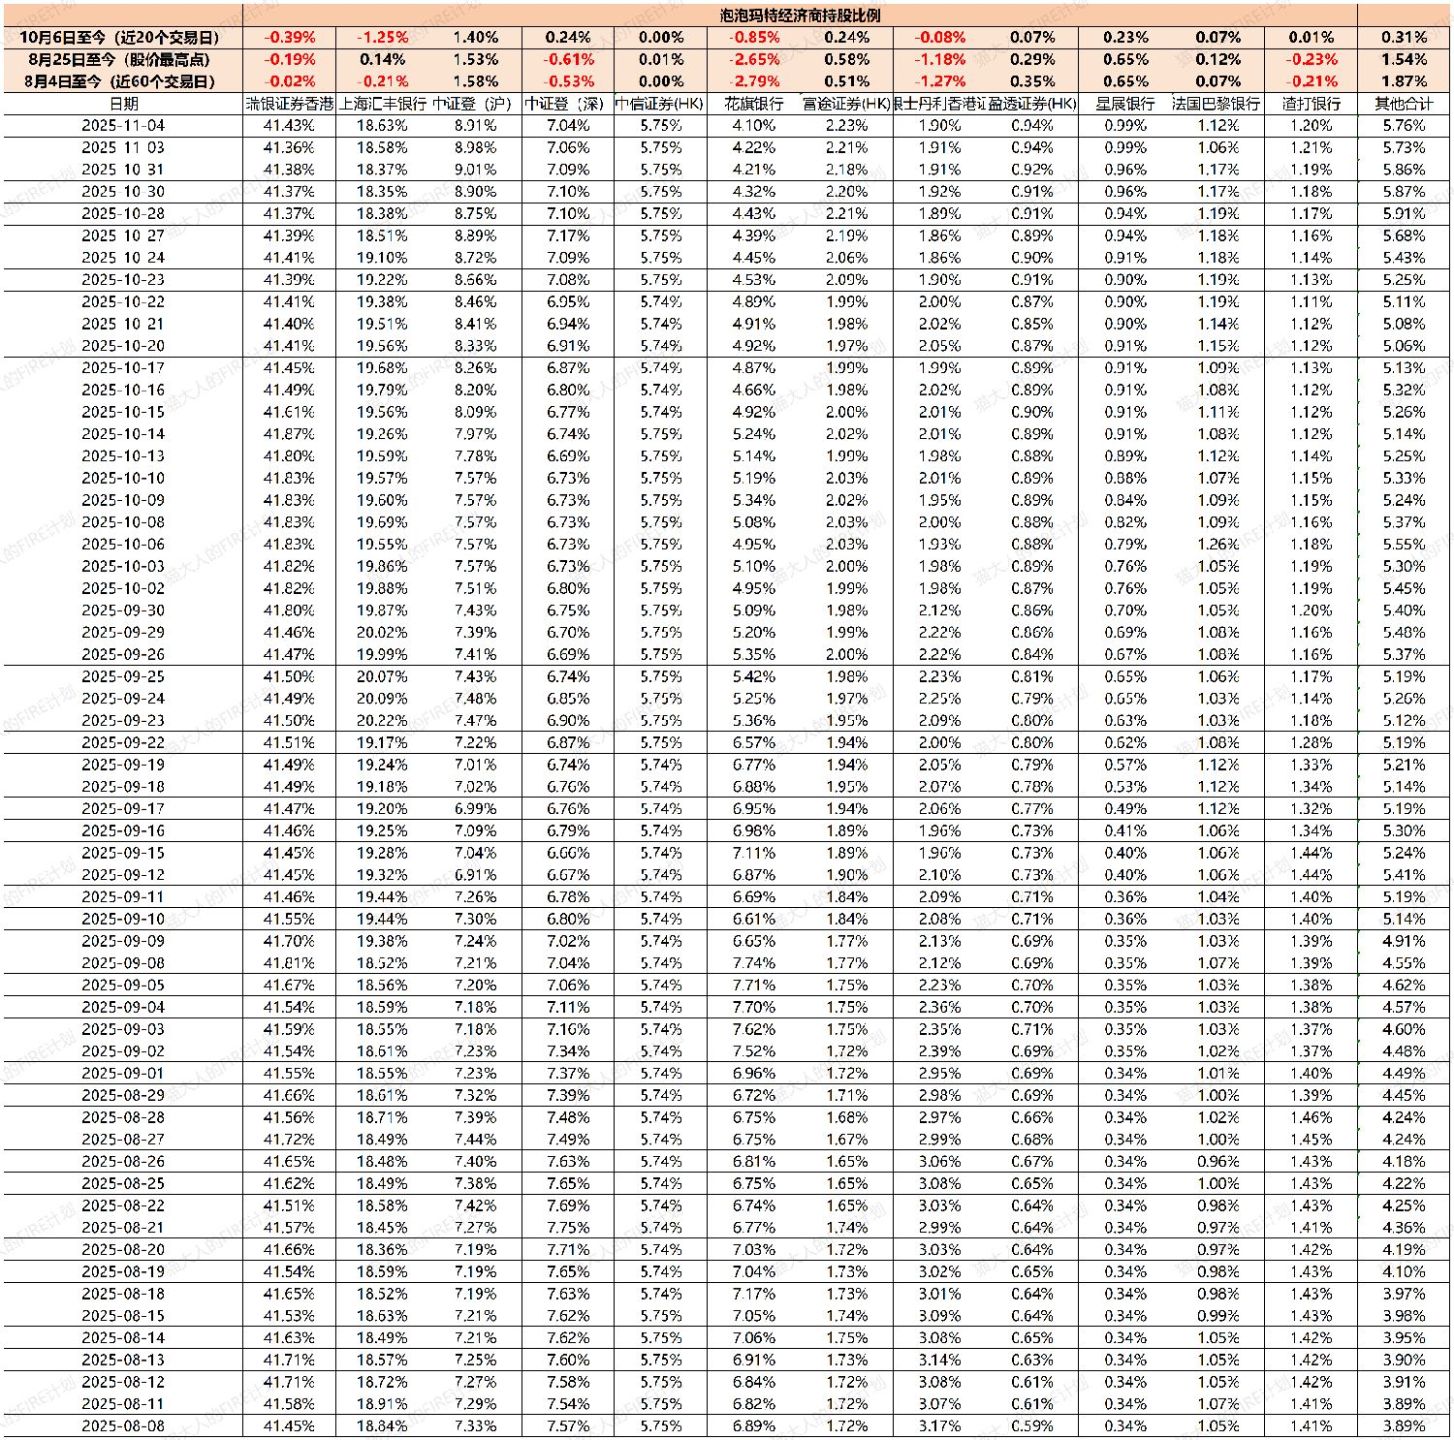
I further organized the relevant data and exported a detailed version. Although it’s not possible to directly distinguish between retail and institutional investors, the scale of retail investors (C-end) for some top foreign brokers isn’t large, especially for companies like Pop Mart. We can basically judge the stance of many institutional investors based on capital movements.
Combining this data table, I think there are more questions that can be answered behind the data.
1. What is the attitude of domestic investors toward Pop Mart?
For domestic investors, whether over 60 or 20 days, the trend has mainly been increasing holdings. Although the number of institutional holders of Pop Mart in public funds decreased in Q3, the amount of institutional holdings actually increased. At least from a capital perspective, domestic investors’ buying has mainly concentrated after October, with the net increase in holdings for Shanghai and Shenzhen combined rising by 1.624%. They are basically the main force supporting the market, and their total holdings are far higher than those of short-selling foreign institutions, so their firm stance is understandable.
2. What is the attitude of foreign investors toward Pop Mart?
In terms of foreign investors: The biggest short seller is clearly Citigroup, which reduced its position by over 3% at the peak, but its remaining position isn’t too large. The ammunition for further selling isn’t much, and buying interest has already picked up. Just keep an eye on it. UBS’s movements over 20 and 60 days are basically within normal fluctuations. HSBC was actively increasing holdings earlier but started selling in October. It’s hard to say they’re shorting; it’s more like the funds that were stuck at high levels started selling in the last 20 days. But because they accumulated too much earlier, they’ve become the main force driving the recent 20-day sell-off. Morgan Stanley was clearly bearish earlier but has basically stopped selling after October. However, its total position is already quite small. Other overseas brokers are mostly increasing holdings, but their overall positions are small.
3. How much shorting momentum does Pop Mart still have?
Morgan Stanley’s current holdings are very small, and it has basically stopped shorting in the last 20 trading days. HSBC is more about cutting losses on funds that flowed in at high levels. Things are basically balanced now, and there’s little willingness to actively participate in shorting. Citigroup’s position has dropped from a peak of 7.7% to 4.1%, meaning it has sold about half. There’s’t much ammunition left; there’s still some room but it’s limited, and we’re already in the latter half.
4. What are the signs of Pop Mart stabilizing and reversing?
Ignoring the noise, if Pop Mart maintains stable growth, I think there are two signals for stabilization and reversal. Institutional bottom: Morgan Stanley’s holdings start rising again, indicating it’s entering a phase of harvesting market chips. There’s been slight stabilization and buying since November, but the proportion is small, so we need to keep watching. Shorting bottom: Citigroup’s shorting has slowed but not stopped completely. If Citigroup stops shorting, that’s likely the stabilization phase. If Citigroup starts increasing holdings significantly in reverse, then Pop Mart’s most dangerous phase is probably over. This needs continuous monitoring.
Conclusion
Although I don’t like talking much about short-term capital movements, I think presenting data on these capital changes and objective facts is more helpful than empty encouragement, as it allows everyone to view volatility more rationally.
The copyright of this article belongs to the original author/organization.
The views expressed herein are solely those of the author and do not reflect the stance of the platform. The content is intended for investment reference purposes only and shall not be considered as investment advice. Please contact us if you have any questions or suggestions regarding the content services provided by the platform.
