

 Rate Of Return
Why do retail investors always buy at the peak? Here are two simple ways to improve. Logic Investment Market Review 240512



Key points of this article:
𝒪 The reason naive investors always buy at the peak is due to poor information and noticing the trend too late.
𝒪 Solutions: 1. Regularly monitor all market trends to stay alert. 2. Wait for overheated sectors to correct and confirm a long-term trend before entering.
𝒪 If you find this article helpful, feel free to like, share, and leave your comments!
◉Why naive investors are always late—slow information
One of the biggest gaps between naive investors and funds is the ability to gather information.
Even without insider information, it's hard for naive investors to outperform professional analysts in identifying industry trends and positioning early.
Worse, most naive investors rely solely on news for information, which only captures recent hotspots.
What are recent hotspots? They are usually the most actively traded and 最容易出现远高于内在价值的疯狂价格。
However, news states facts, but the market trades on expectations, which reflect earlier than facts.
This is why trading based on hot news often leads to buying overextended trends.
From a trader competition perspective, only when many naive investors participate can small money become big money, allowing smart money that bought low to offload large positions.
When the market is left with naive investors who lack price awareness and weak holdings, minor fluctuations can trigger a domino effect, bringing inflated prices back to reality.
◉Advantages of naive investors
The biggest advantage of naive investors is flexibility—they can enter or exit the market almost anytime.
Additionally, unlike passively managed funds, naive investors aren’t forced to trade by rigid rules even when facing huge risks.
Thus, for stocks trending upward, naive investors shouldn’t chase immediately but discern whether the price reflects value or has deviated.
If it’s the former, there’s still room to enter; if the latter, the price will soon plummet.
If you’re familiar with Elliott Wave Theory or Stan Weinstein’s four-stage bull/bear model, you can describe this as "third wave up" / "advancing phase" or "fifth wave up" / "distribution phase"—the logic is the same.
Unfortunately, technical analysis isn’t great for early prediction but excels at judgment.
Still, naive investors can avoid buying at peaks.
◉Wait for a pullback
The simplest method is to resist chasing and wait for a price correction.
From a technical analysis perspective, even in long-term uptrends, short-term selling pressure may occur, but the overall trend remains upward.
In other words, if the trend can’t sustain, don’t enter.
We can’t "predict" whether a trend will sustain, so we must wait to "see" confirmation before entering on the right side.
Though the entry price might be higher than if you chased earlier, profitability becomes easier.
◉Identify emerging sectors
Another method is to constantly observe all asset trends, abandon overheated sectors with exhausted buying power, and seek potential sectors.
To do this, first understand the supply-demand cycle common to most industries.
Industry cycles arise because suppliers can’t accurately predict demand, and capacity expansion takes time.
1. When sudden demand surges, suppliers can’t immediately increase capacity, leading to shortages and rising prices.
2. Later, industries expand to meet demand, but uncertainty about market share often results in overcapacity, causing prices to drop.
3. Industries then destock until the next demand surge, repeating the cycle.
Beyond short-term capacity cycles, there are longer real estate and demographic cycles spanning decades.
Even without fundamental knowledge, you can spot potential turning points by regularly observing sector price trends.
As the world’s most mature market, the U.S. stock market offers various sector ETFs for reference without analyzing individual stocks.
For example, we previously noted solar ETF prices consolidating in a range, signaling potential strength.
Buying here allows tight stop-losses, and if a major uptrend emerges, it creates high risk-reward opportunities.
◉Buying shipping stocks now? Too late!
Let’s examine the shipping sector.
Recently, shipping stocks surged. In Hong Kong, stocks like 1919 and 2343 bottomed in 2022 and steadily rose despite market downturns, now nearing all-time highs as news touts a shipping recovery.
But applying our logic, it’s clear: buying now carries high risk and low reward.
For 1919, the last technical buy point was mid-December to early February at a clear resistance-turned-support level.
Back then, news said things like "March may see off-season price wars until April 1, when price hikes ease the downtrend."
Following such news would’ve made you miss the rally; following current news likely means buying at a short-term peak.
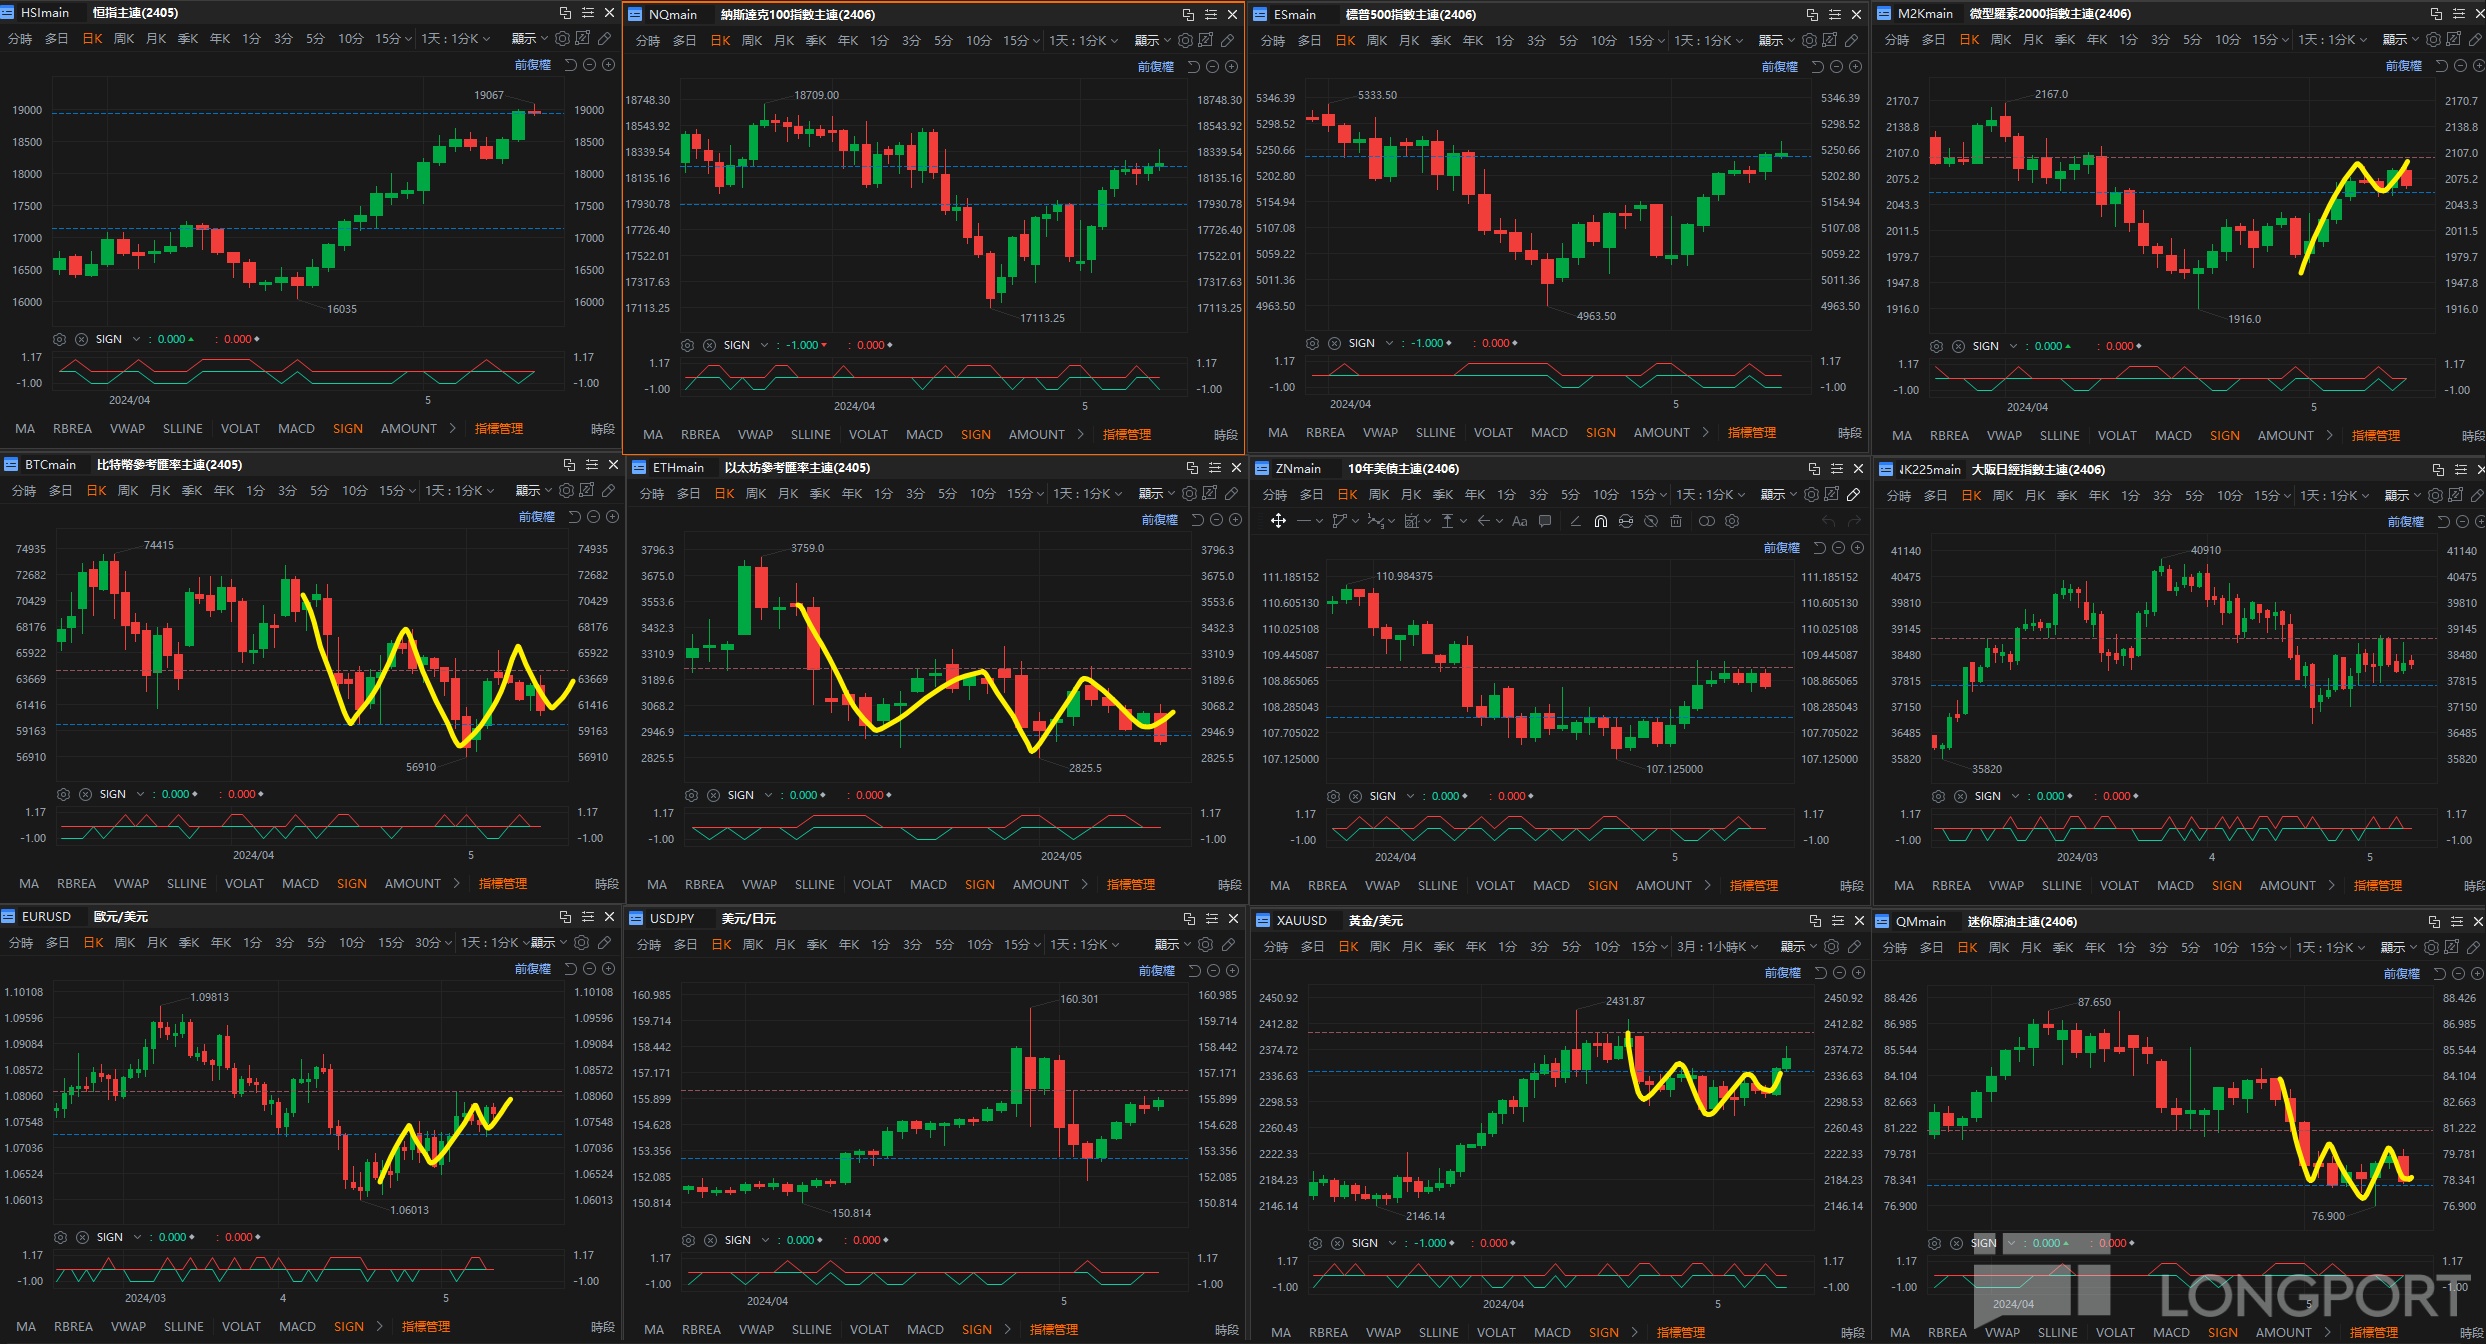
◉Asian markets—Hang Seng extends highs, Nikkei consolidates
Hang Seng futures continued rising this week, breaking the 19,000 level.
For index futures, we lean bullish, but this is an extremely extended trend—even if it reaches 20,000, we’d avoid it.
For stocks, 941, highlighted in April, held support and broke out again—congrats to readers.
Next, watch 9988; details will be shared in the trading log for members.
Nikkei futures are consolidating at former support-turned-resistance; watch 37,680 as support.
◉U.S. markets—Slow grind higher
S&P and Nasdaq futures rose slightly this week, with buyers slightly outweighing sellers.
Like the Hang Seng, the trend is strong but at unattractive levels, so no strong views.
Two weeks ago, we correctly identified a head-and-shoulders bottom in 10-year Treasury futures, predicting a rally that materialized.
The next buy zone is at 108.
◉EUR/USD—Still in consolidation
EUR/USD tested 1.073 resistance-turned-support and remains in an uptrend, but 1.08 is near-term resistance.
◉USD/JPY—Rebounding but facing risks
USD/JPY held resistance-turned-support but faces resistance at 156.
A pullback to 153 forming a double bottom could present a buying opportunity.
◉Crypto—Bottoming patterns
Bitcoin and Ethereum pulled back to prior support this week, forming head-and-shoulders bottoms.
This is one of our favorite patterns, and with prices at relative lows, it’s a rare chance to set very tight stop-losses.
Details will be shared in the trading log for members.
◉Gold—Breaking out of consolidation
Gold also formed and broke out from a head-and-shoulders bottom recently, with the next buy zone at 2343.
◉Oil—Early signs of a bottom
Oil has been falling since early April but showed a head-and-shoulders bottom this week.
If Monday holds without further declines, a short-term bottom may be confirmed.
The copyright of this article belongs to the original author/organization.
The views expressed herein are solely those of the author and do not reflect the stance of the platform. The content is intended for investment reference purposes only and shall not be considered as investment advice. Please contact us if you have any questions or suggestions regarding the content services provided by the platform.
