

 Rate Of Return
July brings major changes! Here's how to trade in August. Market review by Logical Investment 240803


Key points of this article:
𝒪 This article is a monthly review of the market based on monthly charts.
𝒪 When you feel confused about market trends, zoom out to a higher timeframe.
𝒪 Using monthly charts as a guide for daily trading can help avoid getting whipsawed.
𝒪 Price reveals the truth earlier than data.
HD original image: Notion – The all-in-one workspace for your notes, tasks, wikis, and databases.
◉ Hong Kong & Japan Markets—Facing Resistance Again and Starting to Pull Back
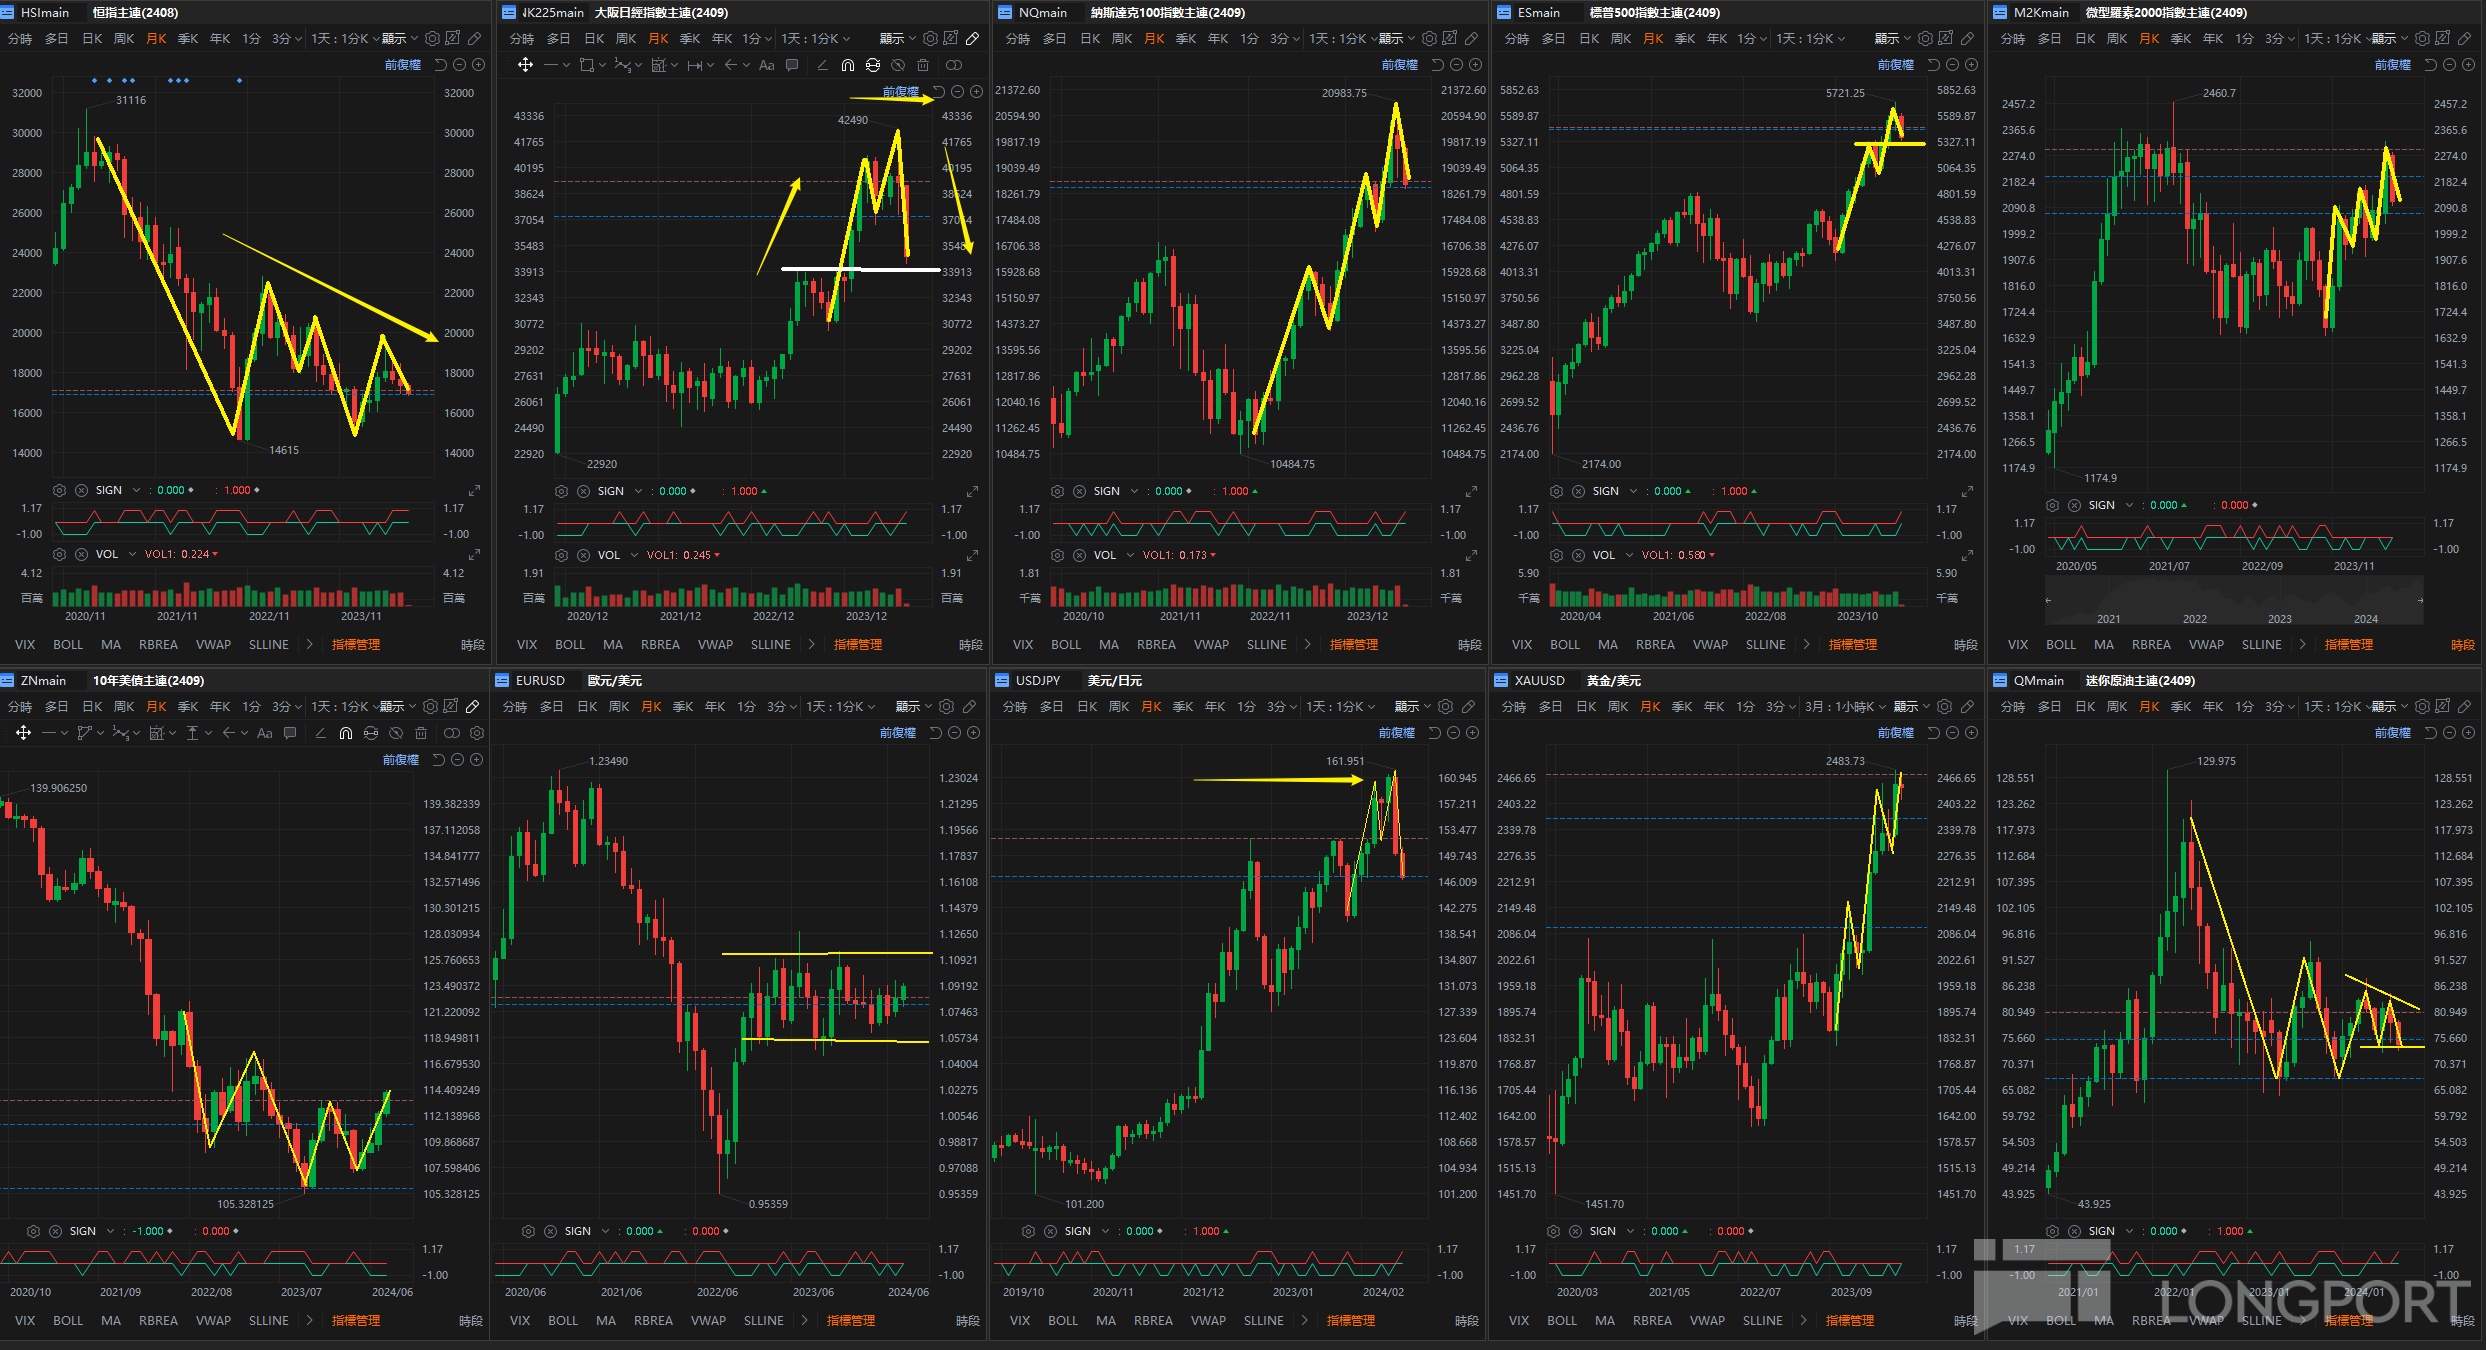
Hang Seng Index futures didn't perform poorly in July, dropping only 281 points.
However, the overall long-term trend remains downward.
Combined with the low of 14620, which was tested twice, a descending triangle has formed.
For longer-term investments, Hong Kong stocks currently need a stronger upward wave than the previous decline to reverse the current downtrend.
Japan's market trend is much clearer than the Hang Seng: After a strong uptrend, Nikkei futures flattened and sharply retreated after failing to break the previous high, clearly turning into a downtrend.
Prices have now fallen to a former resistance-turned-support level. Without further negative news, we expect bulls to step in here for a multi-month consolidation before deciding the next direction.
In other words, we'll wait for the daily chart to show strength again near 34260 before initiating short-term long trades.
◉ US Market—Entering a Bearish Trend
On July 16, in our members-only market log, we noted clear bearish signals in Nasdaq futures' daily chart, followed by a rapid two-week decline. However, monthly charts show both Nasdaq and S&P futures have retreated to former resistance (potential support) levels at 18440 and 5340, respectively. Throughout August, we'll wait for daily charts to consolidate or strengthen before positioning for long-term trades.
If these support levels break downward, even the monthly trend will weaken, turning these levels back into resistance.
These are high reward-to-risk opportunities ideal for small-cap traders.
Winning means riding monthly-level waves; losing means only daily-level stop losses.
Russell outperformed last month but has now hit monthly resistance and followed other indices in a sharp August pullback, nearly erasing July's gains.
I mainly use it to gauge small-cap sentiment rather than trade heavily.
US Treasury futures broke previous highs, clearly reversing into an uptrend since 2020's downtrend. It's time to position long until the trend reverses again.
◉ EUR/USD—Monthly Consolidation Continues
EUR/USD remains range-bound, with highs and lows converging toward the center.
We prefer explosive moves and will watch for breakout signals rather than trade during consolidation.
◉ USD/JPY—Central Bank Interference Can't Alter the Trend
First, let's revisit our USD/JPY strategy since April.
We predicted widening interest rate gaps due to expected US rate cuts and unlikely BOJ hikes, further weakening JPY.
With technical analysis, we devised two exit scenarios:
After buying at breakout:
Mid-term: Partial exit near 160
Long-term: Buy back at 150 after confirmed pullback, then sell at 180
When JPY broke below key support at 150, the long-term strategy failed. We exited initial 150 positions after partial profit-taking at 160.
Long-term trading is challenging due to unpredictable variables.
We can only prepare contingency plans to minimize losses while capturing major trends.
◉ Gold—Still Surging but Potential Double Top
Gold has maintained its uptrend since April's breakout.
However, charts show a red flag: After reaching 2430, repeated upper shadows indicate selling pressure. July's breakout above these shadows was followed by August's pullback.
The steep rally also attracted many momentum traders.
Short-term longs at key daily levels are fine.
But from a monthly perspective, this rally lacks corrections and risks being overextended.
If momentum stalls, a drop to test 2100 (former resistance as support) is possible.
We'd consider buying if gold retests 2100.
◉ Crude Oil—Volatility Declining
Monthly crude volatility is decreasing, with recent swings smaller than previous ones.
Bears dominate but lack strength.
Bulls hope this decline won't revisit 67 support, as breaking it amid lower highs would signal bears challenging bulls' last defense.
A breakdown could trigger a major bearish candle.
◉ Cryptocurrencies—Showing Weakness
Bitcoin and Ethereum show weakening trends.
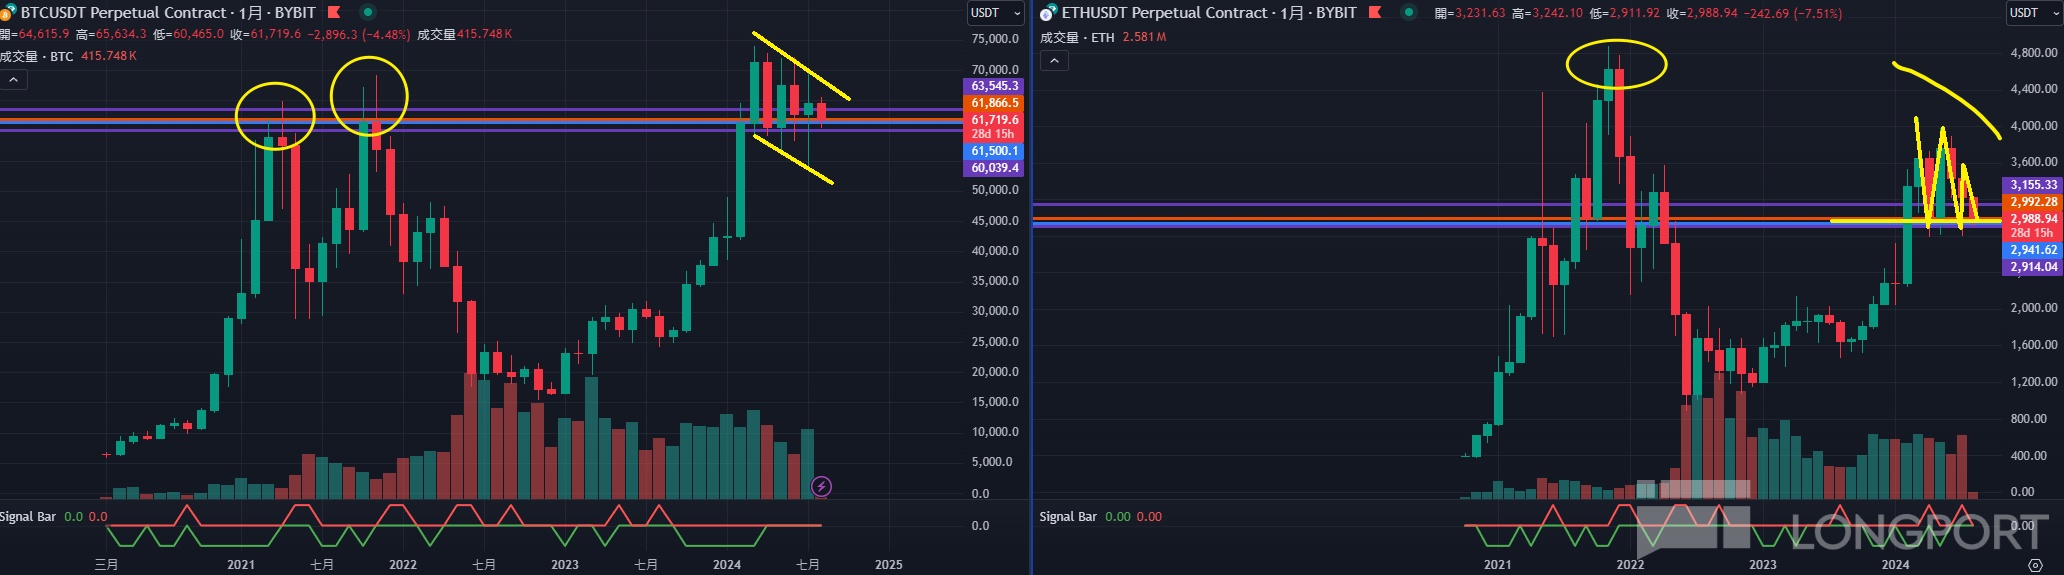
Bitcoin appears to consolidate after highs but shows slight downtrend when connecting swing points. Ethereum's potential descending triangle also reflects bearish strength.
Bitcoin's prominent shadows make monthly-level entries tricky, indicating no clear bullish consensus—a silver lining.
Unlike Ethereum, where bulls cluster near 2915 support. Breaking this could trigger a plunge to 2000.
The copyright of this article belongs to the original author/organization.
The views expressed herein are solely those of the author and do not reflect the stance of the platform. The content is intended for investment reference purposes only and shall not be considered as investment advice. Please contact us if you have any questions or suggestions regarding the content services provided by the platform.
