

 Rate Of Return
US stocks staged a strong V-shaped rebound! Why do I think there will be a pullback next week? Free market review by Logical Investment 240818

Key points of this article:
𝒪 Trading opportunities for various assets next week
𝒪 US stocks surged sharply and V-rebounded to previous highs, reversing the trend.
𝒪 Gold broke through a key level, presenting a rare clear long opportunity recently.
High-resolution original image: https://logicinvestmenthk.notion.site/V-240818-6115ac8f505e4a87aeb45a7a62212fe9?pvs=4
◉ Hong Kong and Japan Markets
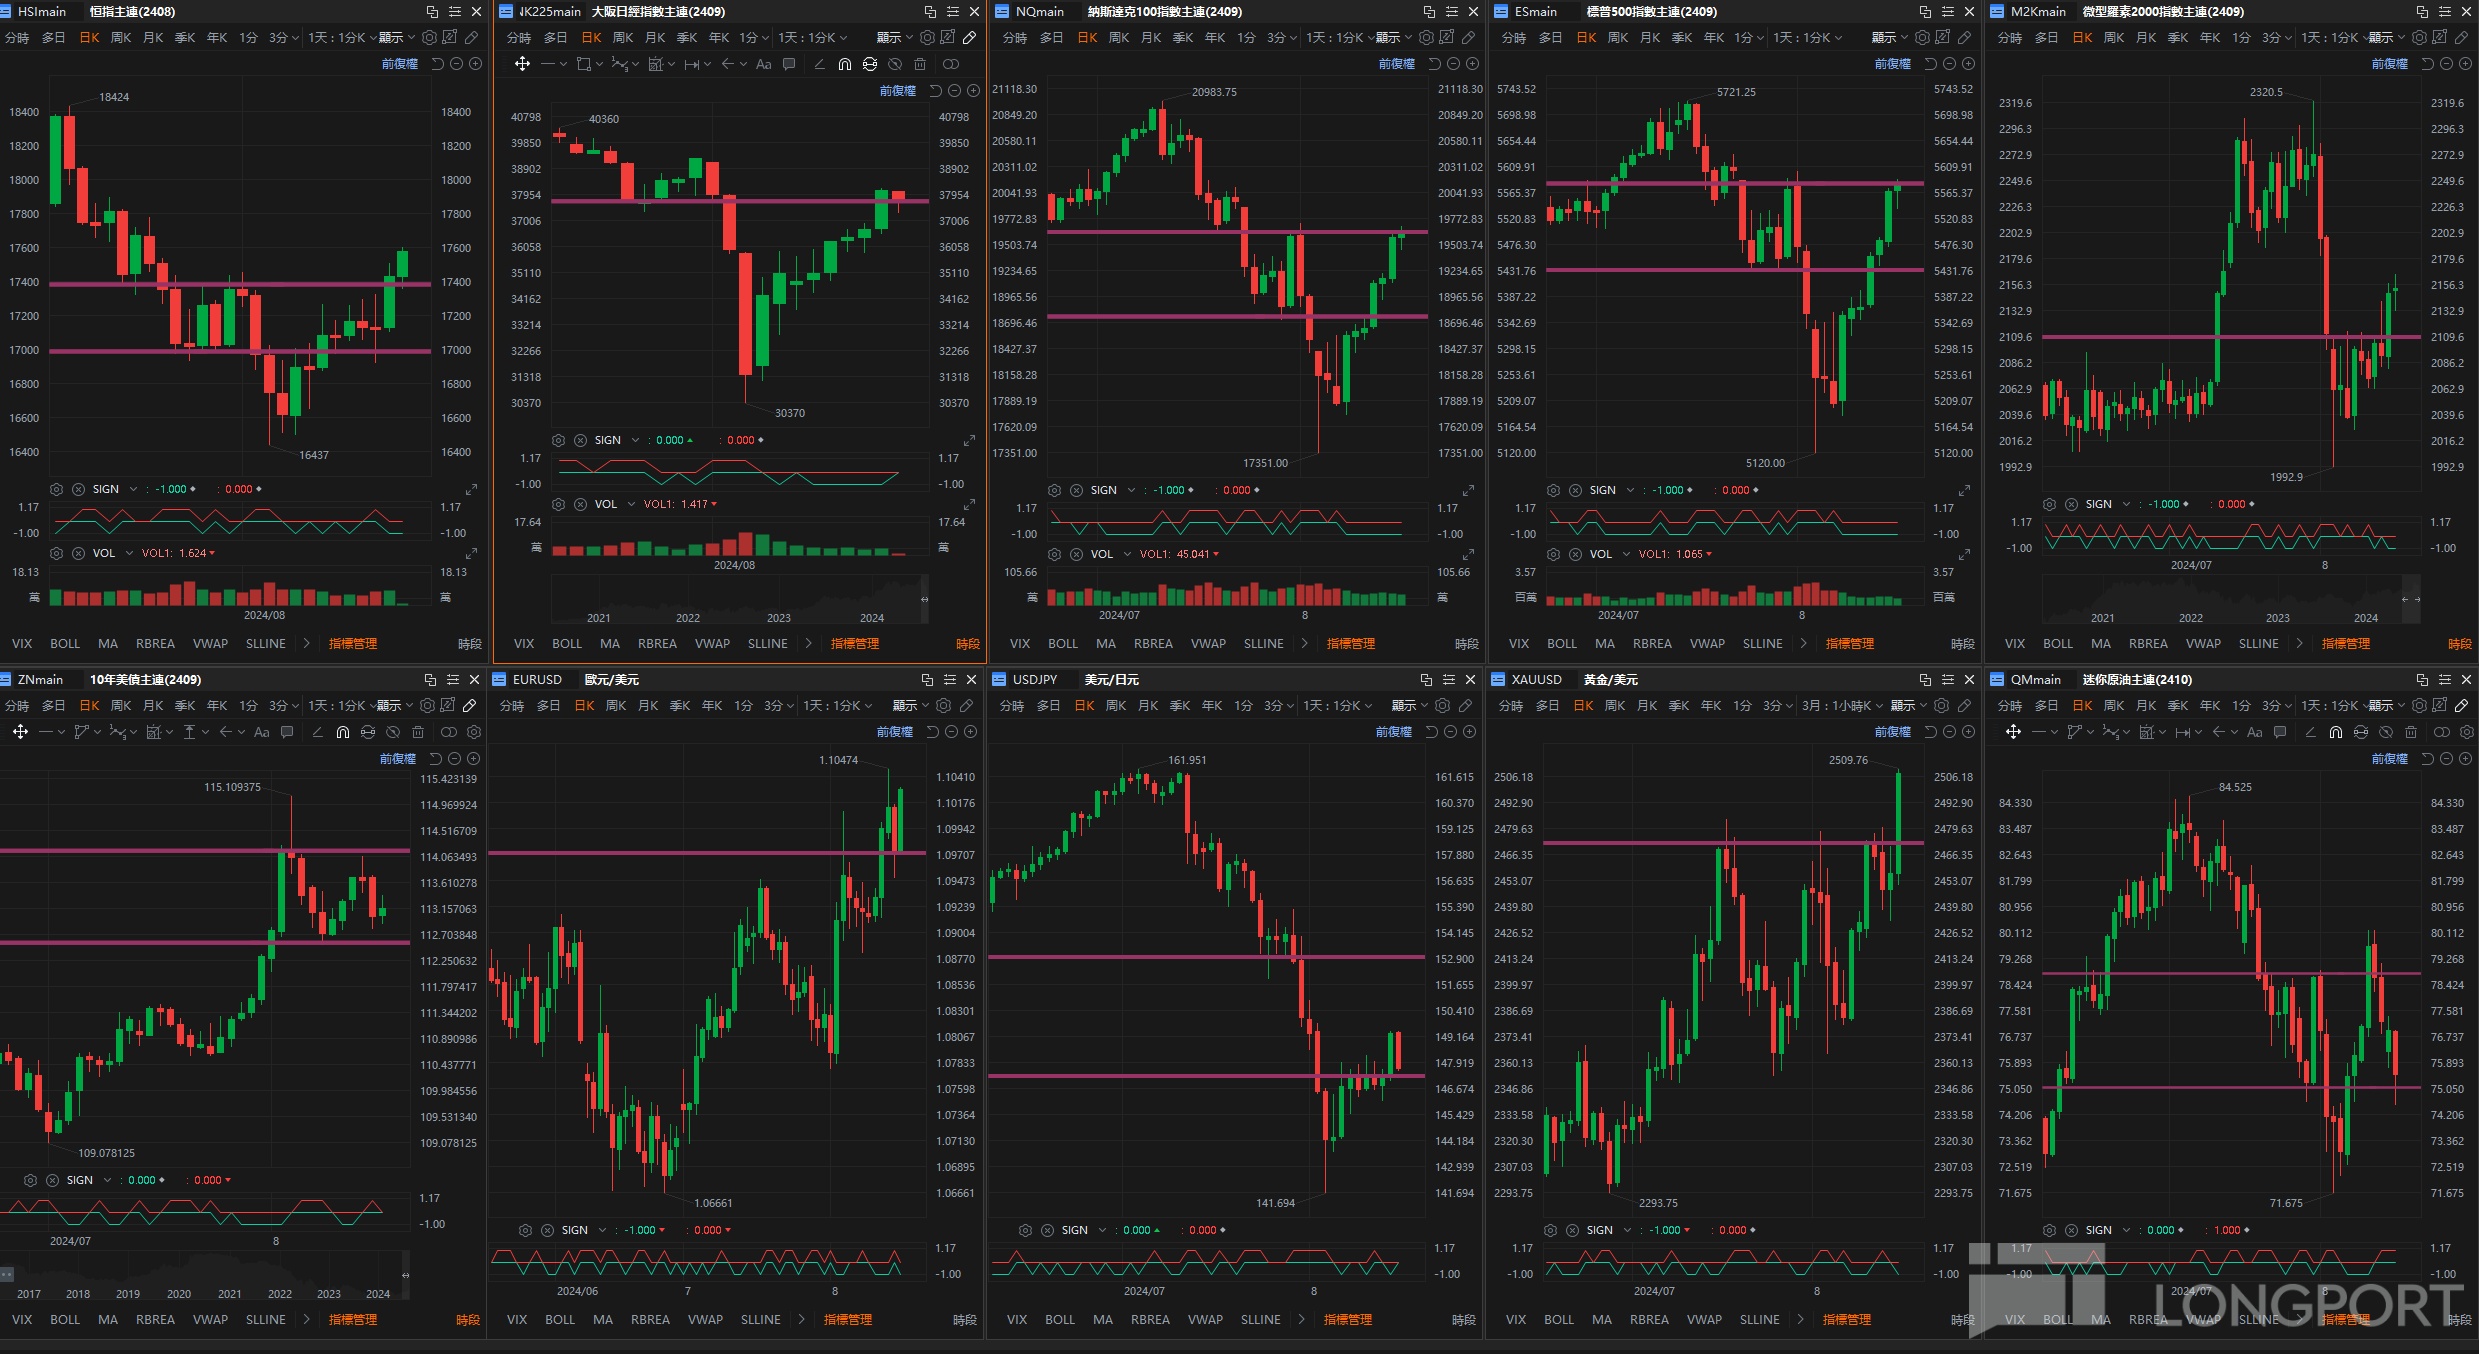
Hang Seng Index futures performed exceptionally well this week, successfully forming an incomplete inverse head-and-shoulders pattern. It broke through previous highs during Friday's night session, presenting an excellent time for long positions with favorable trends and positioning. We will actively engage in short-term long trades next week. In contrast, Nikkei futures resemble the movements of Nasdaq and S&P futures below, V-rebounding to previous support-turned-resistance levels. The trend has shifted to consolidation, with some short positions emerging.
Next Monday is crucial for Nikkei. If it starts to reverse downward, it will be a good opportunity to short, betting on a drop to the consolidation bottom.
◉ US Market
Nasdaq and S&P futures unexpectedly V-rebounded to previous resistance levels without forming a second leg. This movement smoothed the prior downtrend, but we still believe a pullback is more likely next week.
Although this may sound bearish, the reasoning differs from last week:
Last week, the trend was downward, and positioning reached resistance levels (18750/5435), prompting short opportunities.
This week, the trend has shifted to consolidation, but positioning has returned to a resistance zone (19585/5570). Thus, moderate short positions can be taken to capitalize on potential pullbacks, though the probability of breaking previous lows has significantly decreased. The Russell Index also broke through the resistance zone, strengthening its trend. US Treasury bonds show a second leg at the top, weakening the trend, with a chance to break the previous low of 112.7.
◉ EUR/USD
EUR/USD longs successfully proved themselves, breaking through a two-month high, clearly indicating a bullish trend.
However, a significant concern is that EUR/USD has failed to break through the 1.1 level over the past two years, forming a clear consolidation zone on the monthly chart.
Conversely, a confirmed breakout could extend a strong bullish wave.
◉ USD/JPY
USD/JPY's short-term trend has strengthened, breaking through last week's clear resistance level.
Actively consider long opportunities.
◉ Gold
Gold finally broke through again, and we mentioned its clear ascending triangle pattern in the Discord (DC) group. This is a high-probability, low-risk technical pattern for betting on breakouts.
This gold rally is expected to reach around 2560, and we will actively seek long opportunities next week.
◉ Crude Oil
Crude oil formed a daily inverse head-and-shoulders pattern from breaking previous highs to dropping to previous lows. The trend is slightly weak but well-positioned for longs. Wait for clearer reversal signals before entering, targeting previous highs.
More real-time signals will be updated in DC.
◉ Cryptocurrency
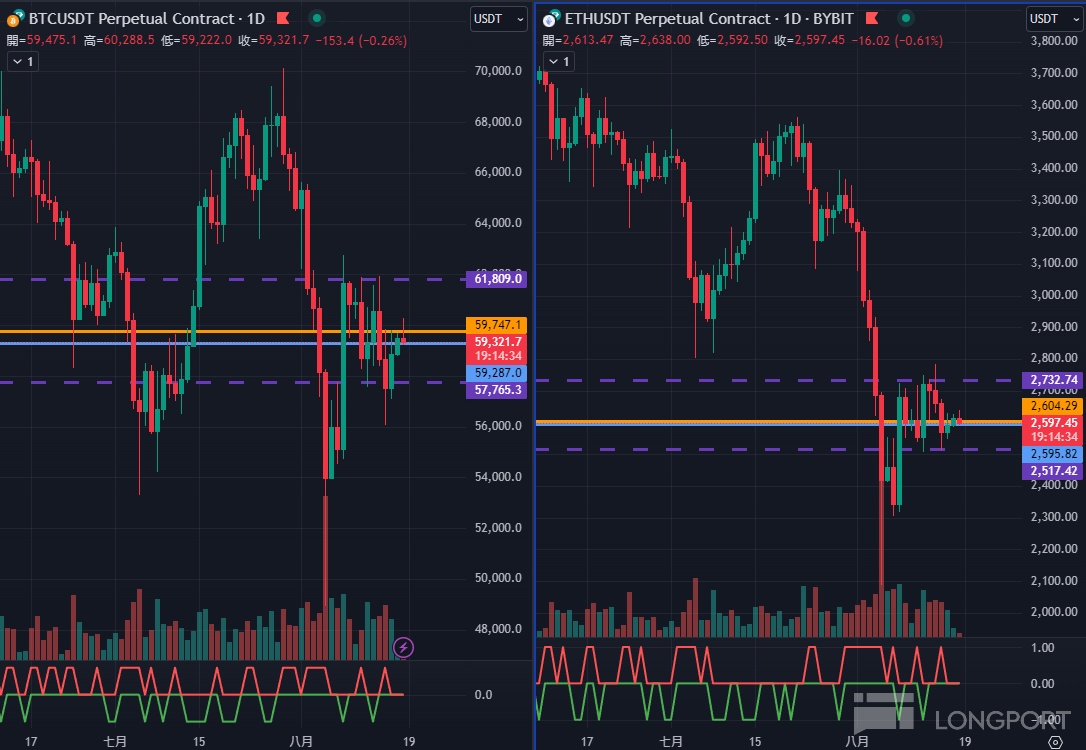
Bitcoin's trend has been relatively unclear over the past two weeks, fluctuating within the range of the previous large bullish candle. Such ambiguous movements are best left un-traded.
👍🏻👍🏻👍🏻 If this analysis helps you, feel free to like and share! 👍🏻👍🏻👍🏻
The copyright of this article belongs to the original author/organization.
The views expressed herein are solely those of the author and do not reflect the stance of the platform. The content is intended for investment reference purposes only and shall not be considered as investment advice. Please contact us if you have any questions or suggestions regarding the content services provided by the platform.
