

 Apple Diamond Holder
 Nasdaq Beater
Nio trend analysis

$NIO Inc(NIO.US)
Look at the chart first
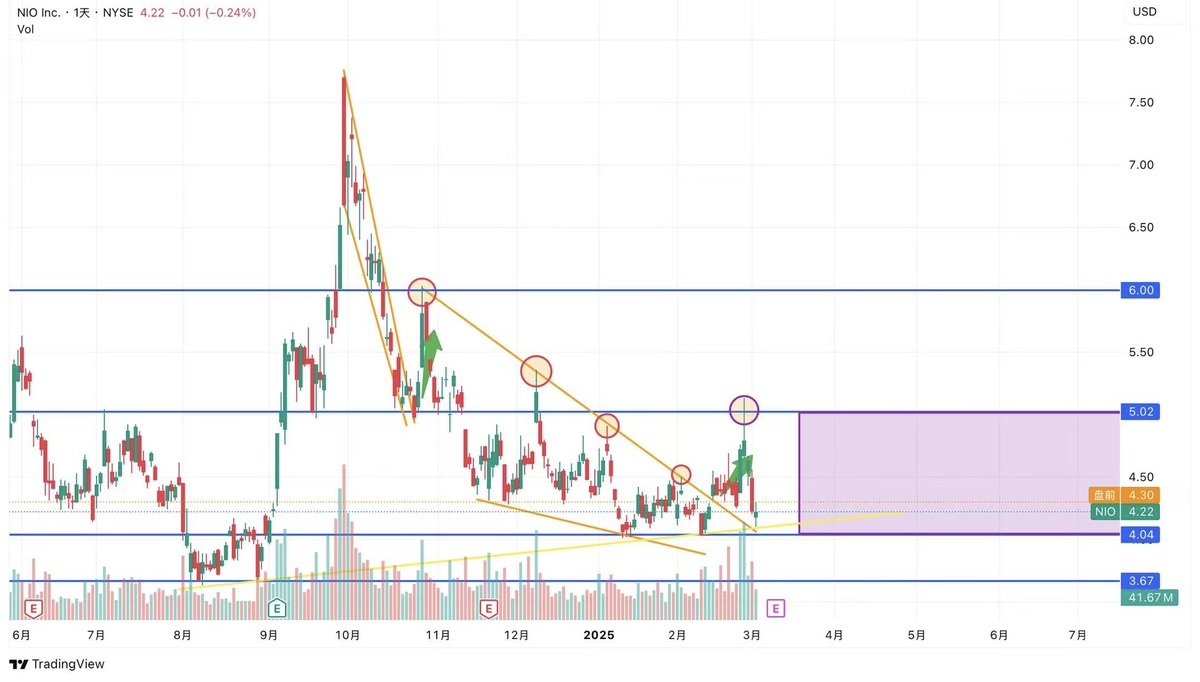
It's not hard to see that after two downtrends, there was a rebound (green arrows). Unfortunately, neither managed to break through. And it can be observed that near the downtrend line, there are long upper shadows (red circles). The latest rebound also failed to break through the resistance level and similarly had a long upper shadow (purple circle). However, at least it has moved out of the downtrend range, so the support at $4 is strong. The subsequent movement should be oscillating within the purple zone, and it's unlikely to go lower.
Personally, I think Nio needs a very strong positive catalyst, perhaps in sales or some other major factor, to possibly break through $5.
Operational advice for reference only: If you're bullish on Nio, you can engage in day trading within the $4-$5 range to reduce costs. Reduce positions when long upper shadows appear or when approaching $5, waiting for a major positive catalyst.
"This article is only for learning candlestick charts and does not constitute investment advice."
The copyright of this article belongs to the original author/organization.
The views expressed herein are solely those of the author and do not reflect the stance of the platform. The content is intended for investment reference purposes only and shall not be considered as investment advice. Please contact us if you have any questions or suggestions regarding the content services provided by the platform.
