

Hoarding $325 billion in cash! The Buffett Indicator hits 185%, indicating the U.S. stock market is in an extreme valuation bubble.

The U.S. stock market rebounded yesterday, and many friends in the circle are bullish tonight, but I personally have reservations. Trump's tariffs have a significant impact in the short to medium term, but in the long run, they are just a trigger. The real issue is the valuation regression after the U.S. stock bubble bursts.
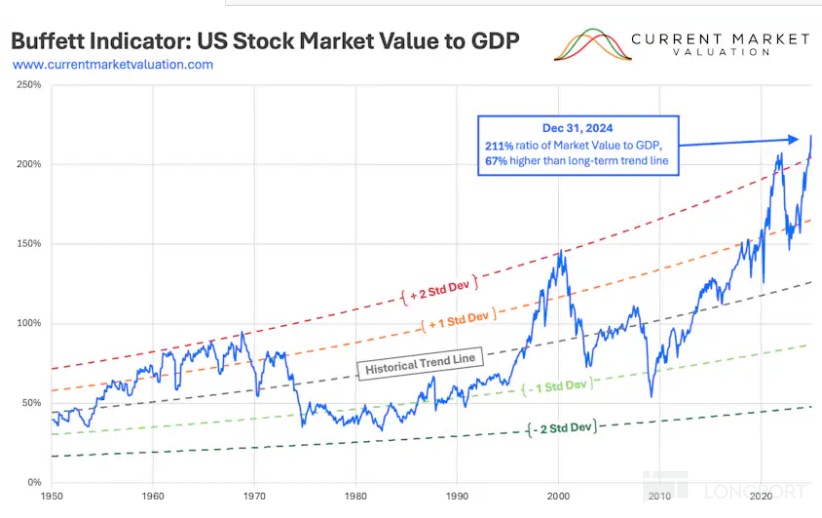
As of January 2025, Berkshire Hathaway's cash reserves have surged to $325 billion, exceeding the combined cash reserves of the top five tech giants, including Apple and Microsoft. This unusual move strongly resonates with the "red alert" signaled by the Buffett Indicator: The ratio of total U.S. stock market capitalization to GDP (Buffett Indicator) has reached 211%, 2.2 standard deviations above the historical trend line, entering the third extreme overvaluation zone after the "Nifty Fifty" bubble in 1968 and the dot-com bubble in 1999.
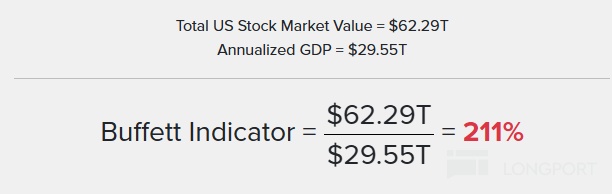
According to the latest data from yesterday, although the total market capitalization of the U.S. stock market has retreated slightly from the beginning of the year, it remains as high as $55.37 trillion. Assuming a rolling GDP of $30 trillion, the current Buffett Indicator stands at 185%, still at an extremely high level.
1. The Buffett Indicator: Measuring the Economy's "Height" with the Stock Market's "Weight"
The valuation metric defined by the "Oracle of Omaha" is very simple: Total U.S. stock market capitalization ÷ U.S. GDP. This ratio essentially measures the alignment between market capitalization and economic fundamentals—when the indicator is between 70%-100%, the market is in a reasonable range; exceeding 150% enters the "danger zone," and the current reading of 211% is 42% higher than the peak of the 2000 bubble (148%) and even surpasses the 2021 historical peak (190%).
From a mathematical perspective, the current indicator has breached the "+2 standard deviation" extreme zone (the historical trend line is 126%). According to statistical laws, this deviation means U.S. stock valuations have entered a "once-in-75-years extreme bubble zone," akin to a 1.7-meter-tall person weighing 200 kilograms, with bodily functions at risk of collapse at any moment.
2. Buffett's "Vote" with Action: The Logic Behind Record Cash Reserves
Berkshire's cash hoarding is no coincidence:
– Historical Warnings: In 1968, when U.S. stocks first breached "+2 standard deviations," Buffett liquidated his holdings and waited two years to buy the dip. In 1999, when the indicator reached extreme levels again, he held 50% cash, ultimately avoiding the 78% crash in tech stocks. Today, the $325 billion cash reserve is a silent rebuttal to the "indicator invalidity theory."
– Market Structure Distortion: The top 10 companies in the S&P 500 (dominated by tech giants) account for 30% of its market cap, with an average P/E ratio exceeding 30x, while the 10-year Treasury yield remains stable above 4.5%—this means the implied return on these stocks is now lower than risk-free bonds, violating Buffett's "never overpay" principle.
3. Three "Swords of Damocles" Over the Extremely Valued U.S. Market
1. The Physics of Mean Reversion
Historical data shows that when the Buffett Indicator exceeds 140%, U.S. stocks typically correct by 20%-30% over the next three years. If the indicator falls back to the 150% "danger line," it would require $18 trillion in market cap evaporation (equivalent to wiping out Japan's entire stock market). A return to the 126% trend line would mean a 40% drop—the average decline during the 1973, 2000, and 2008 bear markets.
2. The "Seesaw" Effect of Interest Rates and Valuations
The Fed's 5.5% high-interest rates continue to squeeze overvalued assets. Tech stocks are highly sensitive to rates; historically, every 1% rise in rates could slash Nasdaq's P/E by 10%-15%. The current Nasdaq P/E of 30x has already priced in five years of growth, and if rate cuts are delayed (the market expects them only by late 2025), valuation contraction pressure will intensify.
3. The Fragility of "Leader Myths"
The "get-rich-quick" stories of AI giants like NVIDIA are replaying history: In 2000, Nokia dominated the mobile market but collapsed due to rapid technological shifts. Today, NVIDIA's 88% market share and 179% FROIC mirror Intel's "monopoly myth." As Amazon and Google develop their own AI chips, this "single-pole dependence" could be the final straw that shatters market confidence.
4. Be Fearful When Others Are Greedy
Buffett's cash hoarding is essentially a hedge against "Mr. Market's" frenzy—when the indicator enters the "using a flamethrower to roast marshmallows" danger zone, liquidity preserves future options. The current U.S. equity risk premium is -1.5% (stock returns below bonds), a scenario seen only three times in 20 years, preceding the 2000 and 2007 peaks.
Investors should heed Buffett's advice: Be fearful when others are greedy. Facing extreme valuations, reducing exposure to high-PE tech stocks and shifting to defensive assets like short-term bonds and consumer staples may be closer to investing's essence than chasing the "AI bubble." After all, $325 billion in cash isn't about missing opportunities—it's about waiting for the golden moment when others make mistakes.
$Invesco QQQ Trust(QQQ.US) $iShares Core S&P 500(IVV.US) $NVIDIA(NVDA.US) $Tesla(TSLA.US) $iShares Semiconductor ETF(SOXX.US)
The copyright of this article belongs to the original author/organization.
The views expressed herein are solely those of the author and do not reflect the stance of the platform. The content is intended for investment reference purposes only and shall not be considered as investment advice. Please contact us if you have any questions or suggestions regarding the content services provided by the platform.
