

 Rate Of Return
 Total Assets
Deriving the theoretical equilibrium price range for gold based on total credit volume

The three most common anchors for the market gold price are: inflation (CPI), real interest rates, and short-term supply/demand / technical trends.
The above variables cannot explain "why the central price level has been rising over the long term."
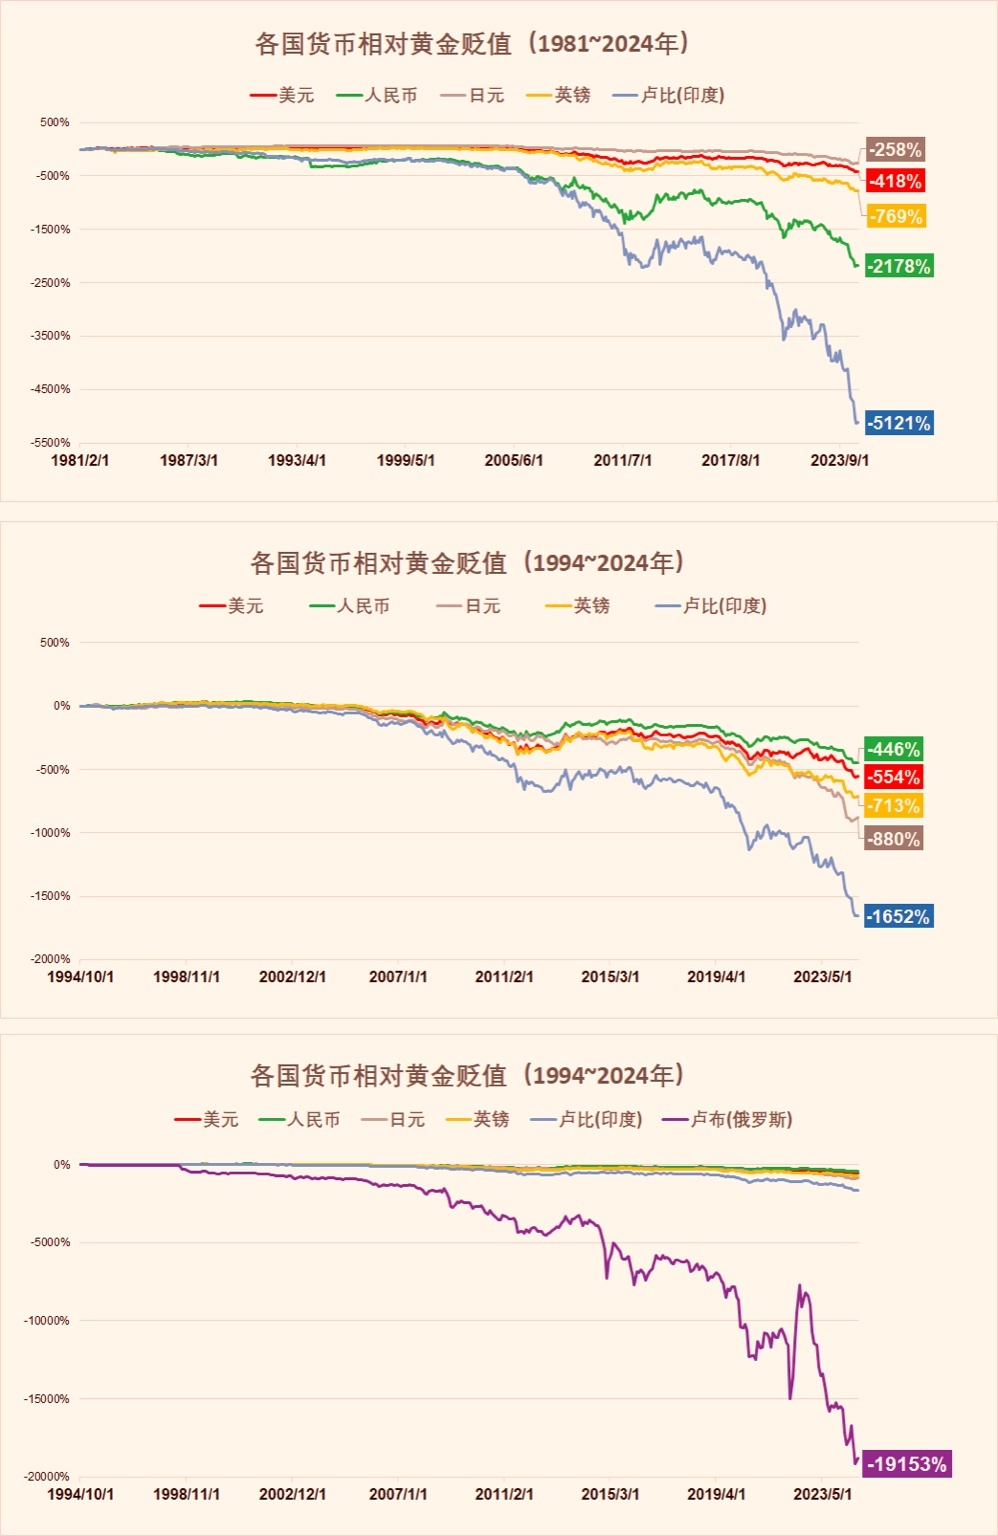
The object of gold pricing is a more fundamental logic: the total scale of fiat currency credit and its credibility.
① First Principles: How can gold derive the scale of credit?
Gold can serve as a credit backstop due to three irreplaceable attributes:
1. Supply rigidity: Extremely low annual increase, cannot be manipulated by policy tools.
2. Zero counterparty risk: It is not a liability of anyone.
3. Global consensus: Effective across systems and sovereignties over the long term.
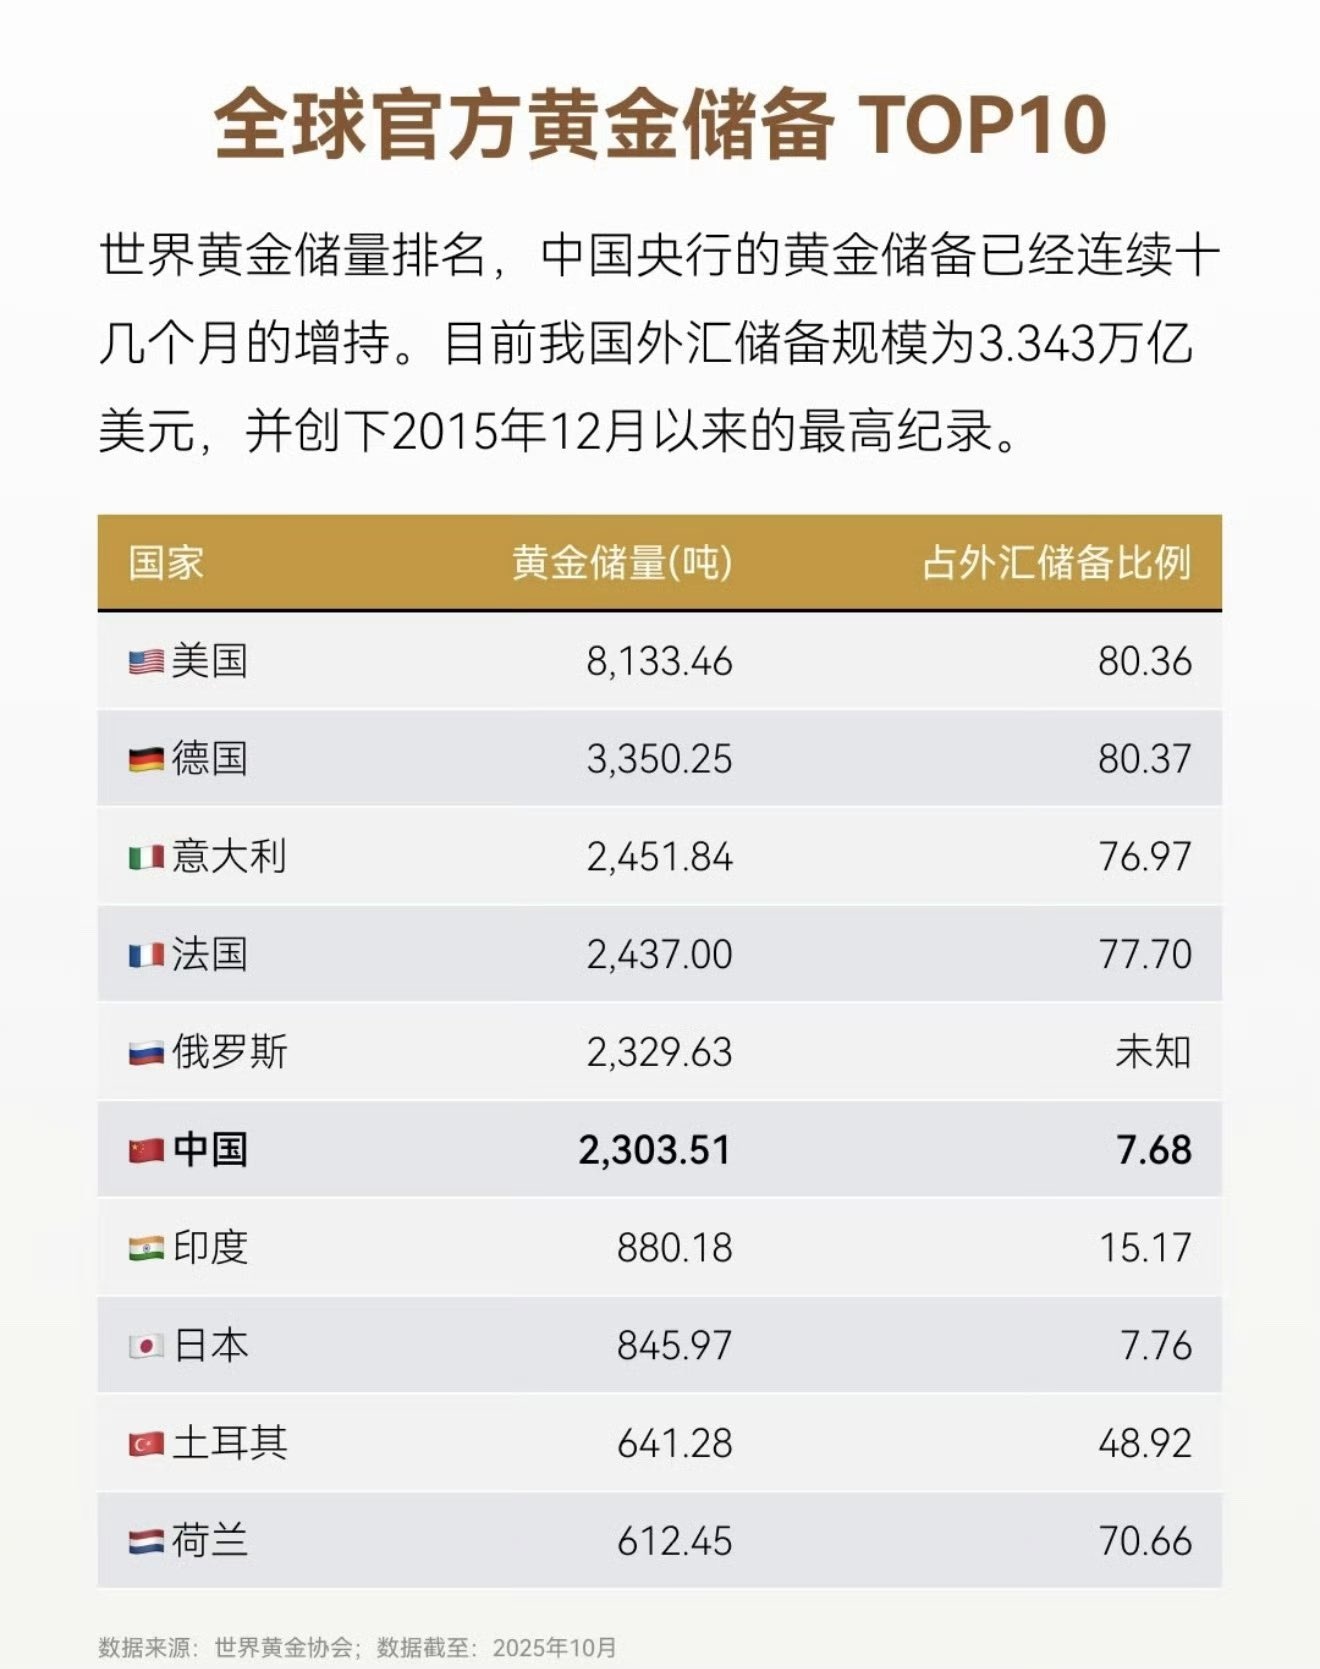
This determines its position within the system: Gold = the "unit of account" outside the fiat currency system.
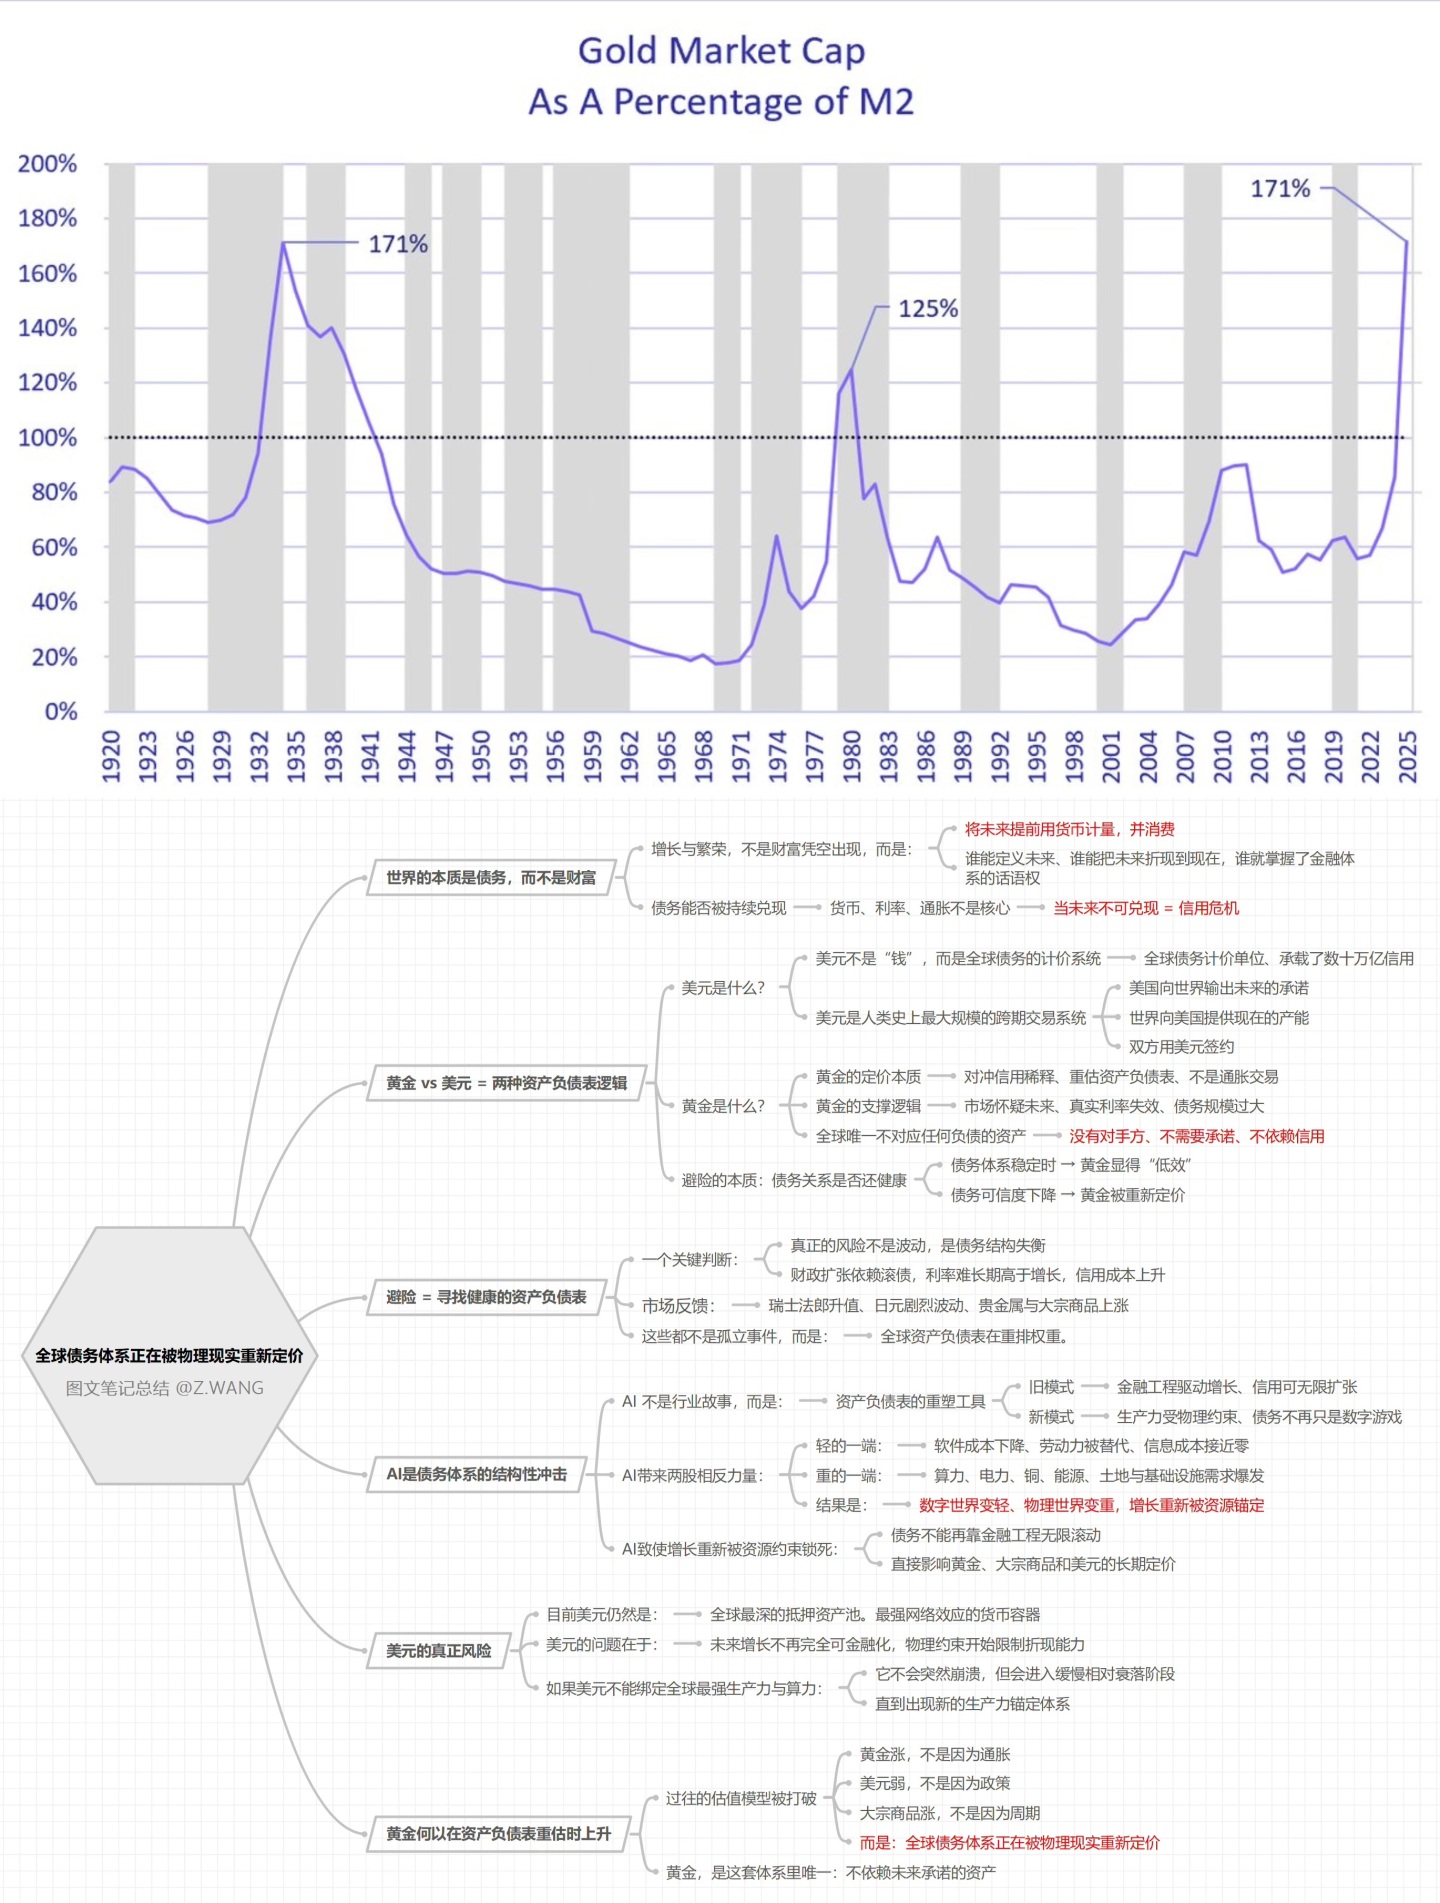
When the credit system expands, gold does not follow with "incremental expansion," so it can only absorb changes in credit scale through price revaluation.
② Key Perspective Shift: Why look at "stock" instead of "flow"?
Most macro analysis focuses on: annual debt scale, fiscal deficit, M2 growth rate.
But what gold truly hedges is not "annual data," but rather: the continuously accumulating and irreversible stock of credit:
· Fiat currency is a liability.
· National debt is the early realization of future taxes.
· The problem is not the "growth rate," but whether the "scale is still credible."
When the market begins to question "whether the stock of credit can be truly repaid," gold's pricing logic shifts from the interest rate anchor to the balance sheet anchor.
③ Deriving Gold's Equilibrium Range from "Total Credit"
If gold is to play the role of a "credit hedge anchor," how much must it be worth to carry the current scale of credit?
④ Two Most Common Effective Paths
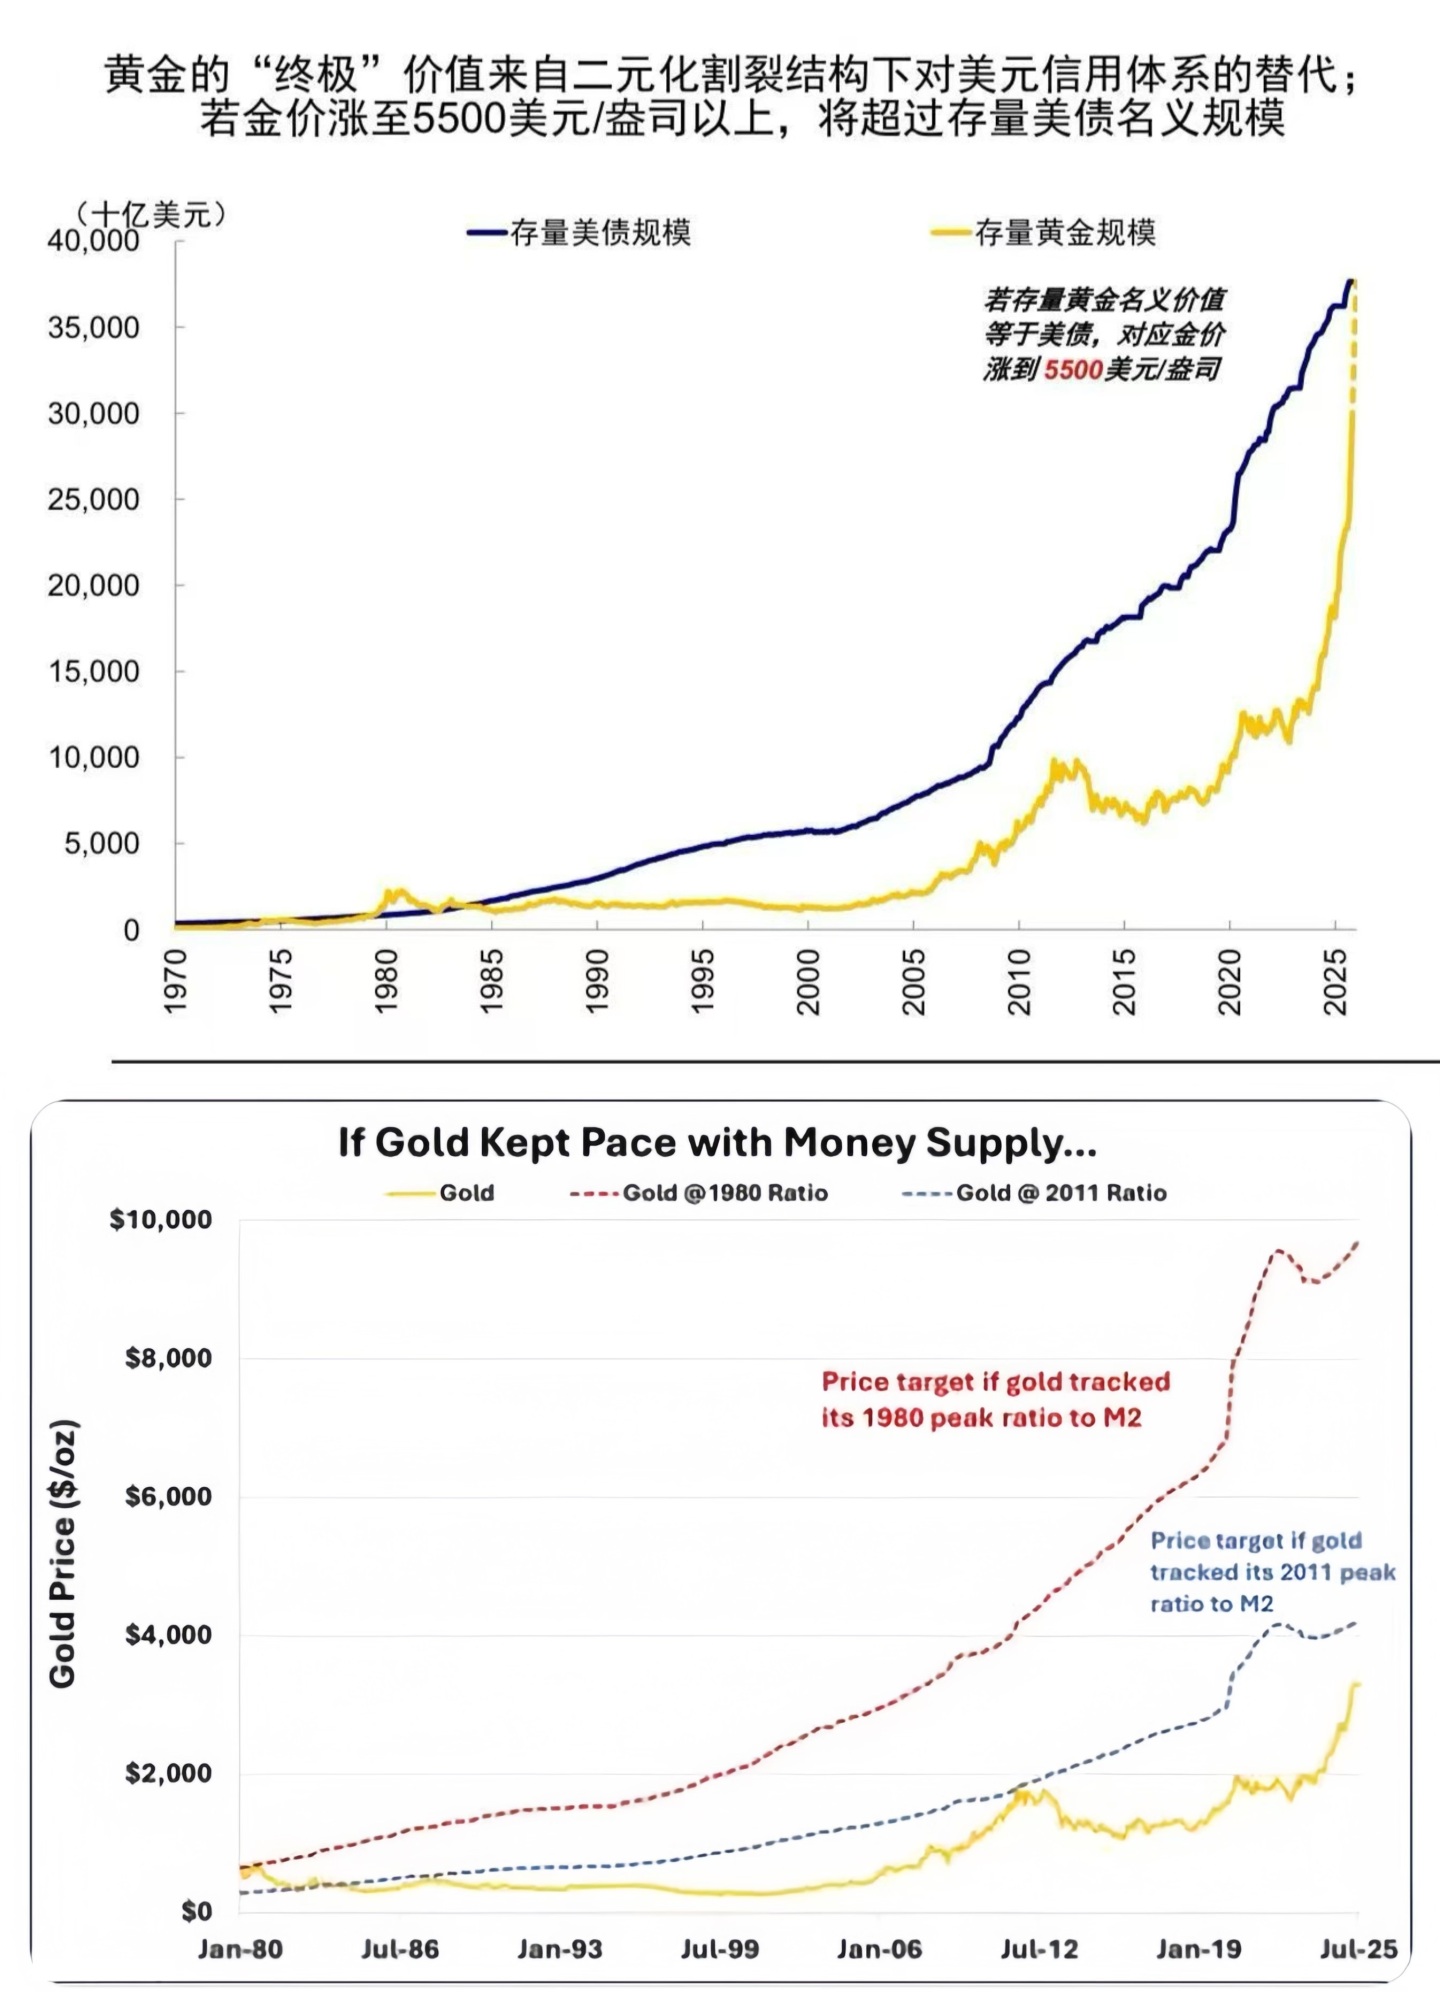
Path One: Gold vs. Stock of Sovereign Debt
· US debt / Sovereign debt scale → Total credit
· Global gold stock → "Anchor asset" outside the credit system
Assumption: "If the nominal value of gold ≈ stock of sovereign credit scale," a price range can be derived.
Under current data conditions, the structural equivalence point roughly falls at: approximately $5000–6000 / ounce.
Only at this range has gold completed the "full revaluation" of the existing credit stock.
Path Two: Gold vs. Money Supply (M2)
· M2 = Total broad credit money
· Observe the ratio of gold price to M2 at historical peaks of credit panic.
The results typically provide two reference anchors:
· 2011 ratio → $4000–4500
· 1980 ratio (extreme credit crisis) → $8000–10000
This is not a "target price," but rather the pricing range the market was historically willing to give gold in a "state of credit distrust."
⑤ Why Not a Single Target Price?
Gold is a typical: slow-moving variable × nonlinear × stepwise revaluation asset.
The result of deriving from total credit is essentially: a "long-term equilibrium range," not a trading point.
Gold's "theoretical equilibrium price range" is not determined by inflation, but by how much credit humanity has already issued and whether the market believes in that credit.
When credit expansion far outpaces real constraints, gold re-establishes itself as the "ultimate unit of account" through upward price movement.
$SPDR Gold Shares(GLD.US)
$MicroSectors™ Gold -3X Inverse Lvrgd ETN(DULL.US)
The copyright of this article belongs to the original author/organization.
The views expressed herein are solely those of the author and do not reflect the stance of the platform. The content is intended for investment reference purposes only and shall not be considered as investment advice. Please contact us if you have any questions or suggestions regarding the content services provided by the platform.
