





Dolphin Research

Dolphin Research

Thinking with soul, research with attitude

0Following5,567Followers

Original

D
Dolphin Research

Walmart (Trans): Raises FY guidance again; e-comm ex-ads near breakeven

Q3 sales grew 4.4% at constant FX, beating the top end of guidance. Full-year OP growth guidance was raised to 8%–8.6%.

However, diesel and transportation are adding over $2.0 bn in incremental costs this year, and implied Q4 OP growth is only 4%–6%. Meanwhile, the company is betting on long-term growth with a $120 annual membership bundle and Agentic Commerce.

图片 1,共 1 张
Conference MinutesWalmart
D
Dolphin Research

PDD Holdings (Trans): Opex ratio down 4ppts; mgmt cautions against extrapolation

Q3 revenue was RMB 108.3bn, flat YoY. The Non-GAAP opex ratio fell 400bps YoY to 28%.

However, management cautioned that a single-quarter expense ratio should not be extrapolated, and the RMB 100bn support program remains in the strategic investment phase. With overseas trade and tax rules shifting, they plan to step up local fulfillment and supply-chain capabilities.

图片 1,共 1 张
Conference MinutesPDD
D
Dolphin Research

Futu Holdings (Trans): Turnover eased; HK$34.5bn net inflows provided support

Q3 trading volume fell 23% QoQ. Client assets still recorded net inflows of HK$34.5bn, and wealth mgmt AUM rose 9% QoQ.

However, mainland clients continued to withdraw, with their revenue contribution down from 20% in Q1 to the low teens. The firm is betting on 23/5 trading access for U.S. stocks and expects its U.S. retail biz to break even next year.

图片 1,共 1 张
Conference MinutesFutu
D
Dolphin Research

Alibaba (Trans): New compute rules a drag; cloud growth seen at 30–45% next year

External cloud revenue growth accelerated for the 10th straight quarter to 64%. Cloud EBITDA margin rose to 14.5%.

However, new U.S. export curbs on compute capacity have cut next year's cloud revenue growth target to 30–45%. The long-term 20GW compute target may also be revised lower. The company is betting on T-Head's domestic chips to scale, and expects cloud growth to re-accelerate above 50% in 2028.

图片 1,共 1 张
Conference MinutesAlibaba
D
Dolphin Research

Walmart 3QFY27 First Take: On an absolute basis, results were solid with revenue up 5.2% and Adj. OP up 5.5%, above the prior +2%-4% guide. Full-year guidance was raised again.

That said, the broad price cuts since Jul. did not accelerate U.S. traffic, and the raised FY guide back-solves to below-consensus Q4 profit. For a stock trading at ~44x earnings, the mix of an earnings beat, flat traffic, and a soft Q4 guide is underwhelming, and shares were down ~1% pre-mkt. Specifically:

1) Walmart U.S.: Comps edged up with no traffic acceleration. Comps rose 2.9% (vs. ~2.8% est.), modestly above 2Q's 2.6%, but the mix was not ideal: transactions were +1.5%, flat vs. 2Q, while basket size improved from +1.1% to +1.4% and was the main driver.

In other words, price cuts mainly defended traffic rather than driving it.

E-comm was +23%, adding ~530bps to comps. Ads grew 37% (Walmart Connect ex VIZIO and Vibe +36%) and Marketplace was +49%, with the high-margin flywheel still spinning fast.

The company for the first time disclosed that GMV in general merchandise grew mid-single digits. That outpaced 1P general merchandise's low-single-digit growth, indicating a shift toward the 3P marketplace.

2) Sam's U.S.: Sales accelerated while profit fell. Comps (ex fuel) were +4.9%, up from 2Q's +4.4%, with transactions +5.1%, ticket -0.3%, and e-comm +30%.

However, operating profit fell 15.8% YoY, primarily due to the fee allocation from the new bundled 'Walmart+ and Sam's Plus' membership.

3) Walmart Intl.: Promo timing was a drag, China accelerated. Intl. revenue grew 3.3%, mainly hurt by Flipkart's Big Billion Days shifting from 3Q to 4Q, a ~500bps drag, leading Intl. e-comm to decline 2%.

By market, China grew 28.5%, accelerating from 2Q's 20.7%, with Sam's still the top growth engine. Walmex was +3.6% and Canada +6.2%, but both are in wage and price investment phases, pressuring profit.

4) GP & OP: GPM was 24.5%, up 28bps YoY; Walmart U.S. GPM expanded 50bps, driven by mix shift toward high-margin businesses such as ads and category mix benefits from lower drug prices. On opex, the Adj. opex ratio rose 34bps YoY, mainly due to higher depreciation from capex and increased self-insurance claims.

Walmart U.S. operating profit rose 9.0%, outpacing revenue growth.

5) Guide: FY raised, Q4 soft. FY outlook was lifted to revenue +4.9%-5.2% (prior 4.0%-5.0%) and Adj. OP +8.0%-8.6% (prior 7.0%-8.5%). However, back-solving implies Q4 Adj. EPS of ~$0.72-0.77, below the Street's prior ~$0.78.

Q4 also benefits from Flipkart's promo timing, making the guide look conservative. For more details, follow Dolphin Research's upcoming earnings review and call takeaways. $Walmart(WMT.US)

图片 1,共 1 张
D
Dolphin Research

1024 HK 3Q26 First Take: Q3 missed, with macro headwinds, e-com tax tightening, and short-drama cannibalization all weighing on results and making near-term ops tougher than expected. Meanwhile, the AI unit Kling did not disclose key metrics such as ARR this quarter.

Management may be in a listing-related quiet period, but the lack of disclosure fuels concern that ARR may be underwhelming. By our rough math, Q3 revenue likely rose only slightly QoQ, and this number should be a key focus on the call.

Dolphin Research believes that, versus short-term headline misses, what matters more is how management restores investors' mid-to-long-term confidence. $KUAISHOU-W(01024.HK)

In detail:

1) Ads slumped: Q3 ad revenue fell 11% YoY, worse than the guided -5%. Macro softness hurt, and with e-com ads at roughly half of the mix, incremental spend from short dramas, gaming, and AI apps was not enough to offset.

E-com tax enforcement remains in-cycle, and the platform’s mostly SME merchants took a bigger hit as compliance tightened. To sustain transaction activity, the platform had to deploy traffic incentives to subsidize merchants.

While some external ad categories still grew, overall time spent was eroded by rival short dramas. This showed up in Q3 as MAU could scale but DAU was flat, signaling ecosystem traffic pressure.

Dolphin Research expects these headwinds to persist into Q4, and given a tough base, ad revenue could decline further. A bottoming and recovery may not come until at least after Q1 next year.

2) Live streaming kept shrinking: Q3 declined 19% YoY. Beyond secular sunset dynamics, tighter compliance on guilds continued to weigh.

This mirrors live-stream trends at Tencent Music and others, i.e., a structurally shrinking business.

3) Kling revenue undisclosed: Q3 'other revenue' was RMB 6bn, roughly flat YoY (+1.5%). Assuming e-com declines high-single digits, back-solving suggests Kling’s Q3 revenue likely rose only about 5% QoQ.

The sharp growth slowdown was partly expected. Kling had no version update, while competitors rolled out back-to-back releases: Seedance 2.5 in Jul, Minimax H3 and Wan 3 in Aug; Seedance leans hardcore and Minimax offers strong value, both likely pressuring Kling’s run-rate.

The major iteration Kling 4.0 only rolled out fully in mid-Oct, so it did not lift Q3.

Industry testing suggests Kling 4.0 is in the same tier as Seedance 2.5. Kling is strong in realism, narrative, text, whiteboard, and pricing; Seedance leads in high-speed motion, ads, and A/V sync.

However, Kling appears more focused on pro film-making scenarios, while in ad use cases closer to monetization, its smaller motion range and weaker ambience hurt commercialization.

Kling’s latest funding closed in late Oct at a post-money valuation of $18bn, below the initially planned $20bn; both Tencent and Alibaba invested. Even assuming a rich 20x PS, the implied next-12-month revenue target would be close to $1bn.

But with our Q3 estimate at roughly RMB 900mn, even with Kling 4.0’s Oct contribution and sustaining ~10% QoQ growth, next year’s revenue would still be below $1bn. Unless overseas accelerates further or vertical penetration broadens, it is hard to argue there is no valuation downside risk.

4) Higher opex mainly from Kling: Sales expense fell YoY again, while R&D rose on Kling investment. G&A jumped mainly due to Kling staff SBC, likely tied to spin-off progress.

Core OP swung to a RMB 1bn loss, RMB 600mn worse than prior guidance, with ads as the primary drag.

5) Dolphin view: It is hard to call a bottom or its duration; trend-wise, an inflection seems unlikely before mid next year. For Kuaishou, which is tied to lower-tier markets and past the short-video dividend, the macro beta hit harder.

Kling was once the bright spot, but intensifying local model competition has diluted scarcity value. The short-drama boom cuts both ways: good for Kling’s use cases, but bad as archrival Hongguo aggressively siphons traffic, hurting Kuaishou’s core ecosystem.

We currently cannot value the business on a steady-state basis. As noted last quarter, we anchor on cash plus Kling equity: short-term net cash $11.5bn * 90% plus Kling valuation (2027E $6bn revenue * 15x P/S = $13.2bn) * 50% * 70% holdco discount = $15bn.

The current mkt cap is only $12.7bn, highlighting depressed asset pricing amid weak confidence. But beyond a quantitative anchor, what Kuaishou lacks more is investor conviction, which puts the onus on management’s strategy and resolve to chart a credible turn-around path.

Risk disclosure and disclaimer: 海豚研究免责声明及一般披露

图片 1,共 1 张
D
Dolphin Research

NetEase (Trans): 'Yihuan' slated for Jan 5 next yr; skins monetization is a long-term play.

Yanyun: Sixteen Voices surpassed 100 mn global players in Aug. World of Warcraft's new-server launch and annual-pass sales both set records.

However, online gaming revenue fell QoQ from RMB 24.5 bn to RMB 22.4 bn. Meanwhile, 'Yihuan' is slated for a global, cross-platform launch on Jan 5, 2027, with management signaling a cosmetics-led monetization strategy for long-term scale.

網易 NetEase
Conference MinutesNetEase
D
Dolphin Research

Kuaishou (Trans): Softer traffic; Q4 rev. and profit still under pressure

Following the launch of Kling 4.0, total billings trended higher, while Vanchin revenue rose nearly 90% QoQ. However, Q3 revenue fell to RMB 31.6bn and Adj. net profit was only RMB 790mn.

With softer traffic, Q4 revenue and profit will remain under pressure. Meanwhile, the company is shifting to flexible compute via leasing, tightening costs, and maintaining buybacks and dividends.

图片 1,共 1 张
Conference MinutesKuaishou
D
Dolphin Research

PDD 3Q26 First Take: a rare major beat. In short, ads accelerated, Temu dialed back spend, and profits snapped back.

Platform ad revenue growth rose to 12% YoY, with revenue near RMB 60 bn, a clear acceleration vs. +3.5% last quarter and 6% above the RMB 56.3 bn consensus. Adj. OP came in at RMB 32.6 bn, 17% above the RMB 27.8 bn estimate, with OPM at 30%, the highest in eight quarters.

On the cost side, GPM recovered to 58.2%, edging toward 60%. Marketing expense was RMB 25.3 bn (-17% YoY), RMB 6.4 bn below expectations; even G&A declined YoY.

Total revenue was RMB 108.3 bn, essentially flat YoY and 6% below the RMB 115.2 bn consensus. The shortfall mainly came from commissions, where Temu is a large contributor, coming in much lower than expected — in Europe, higher parcel-related charges led to a clear contraction in both parcel-related revenue and costs.

The pre-market rally is warranted. The stock was already de-rated, ad revenue — the high-quality piece — has accelerated to double digits, and Temu pulled back on spend. At roughly 6x annualized adj. net income, if the call confirms ads can sustain the faster pace, there is still upside for the shares. $PDD(PDD.US)

图片 1,共 1 张
D
Dolphin Research

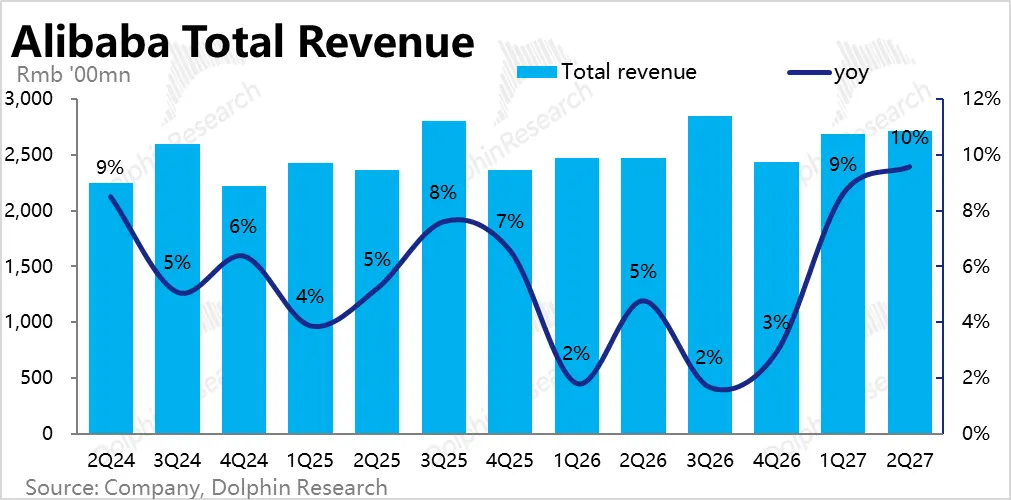
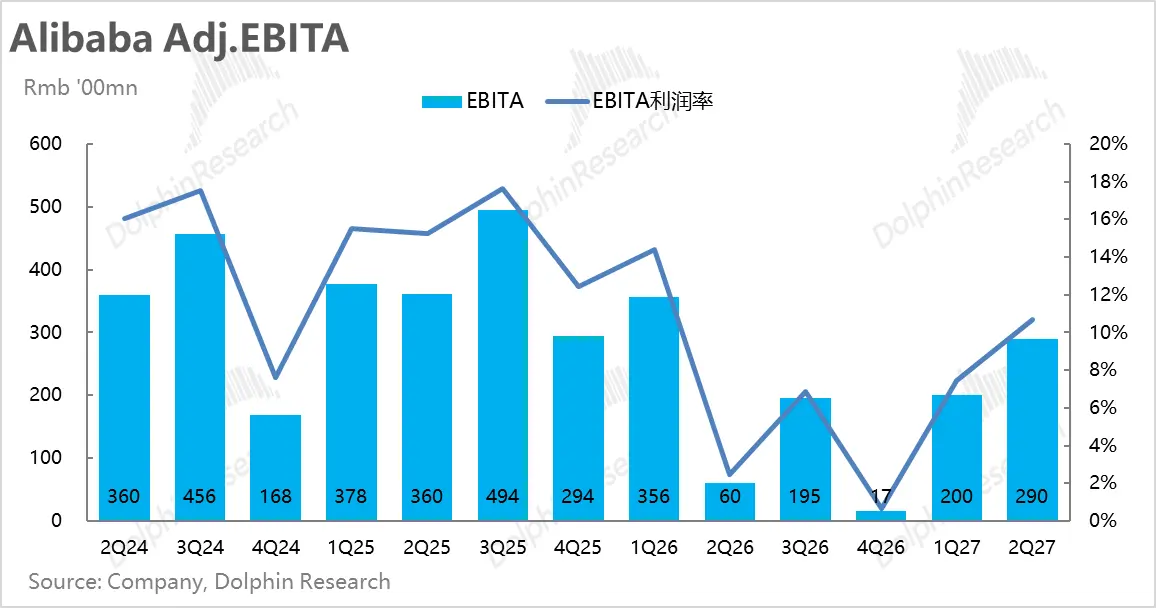
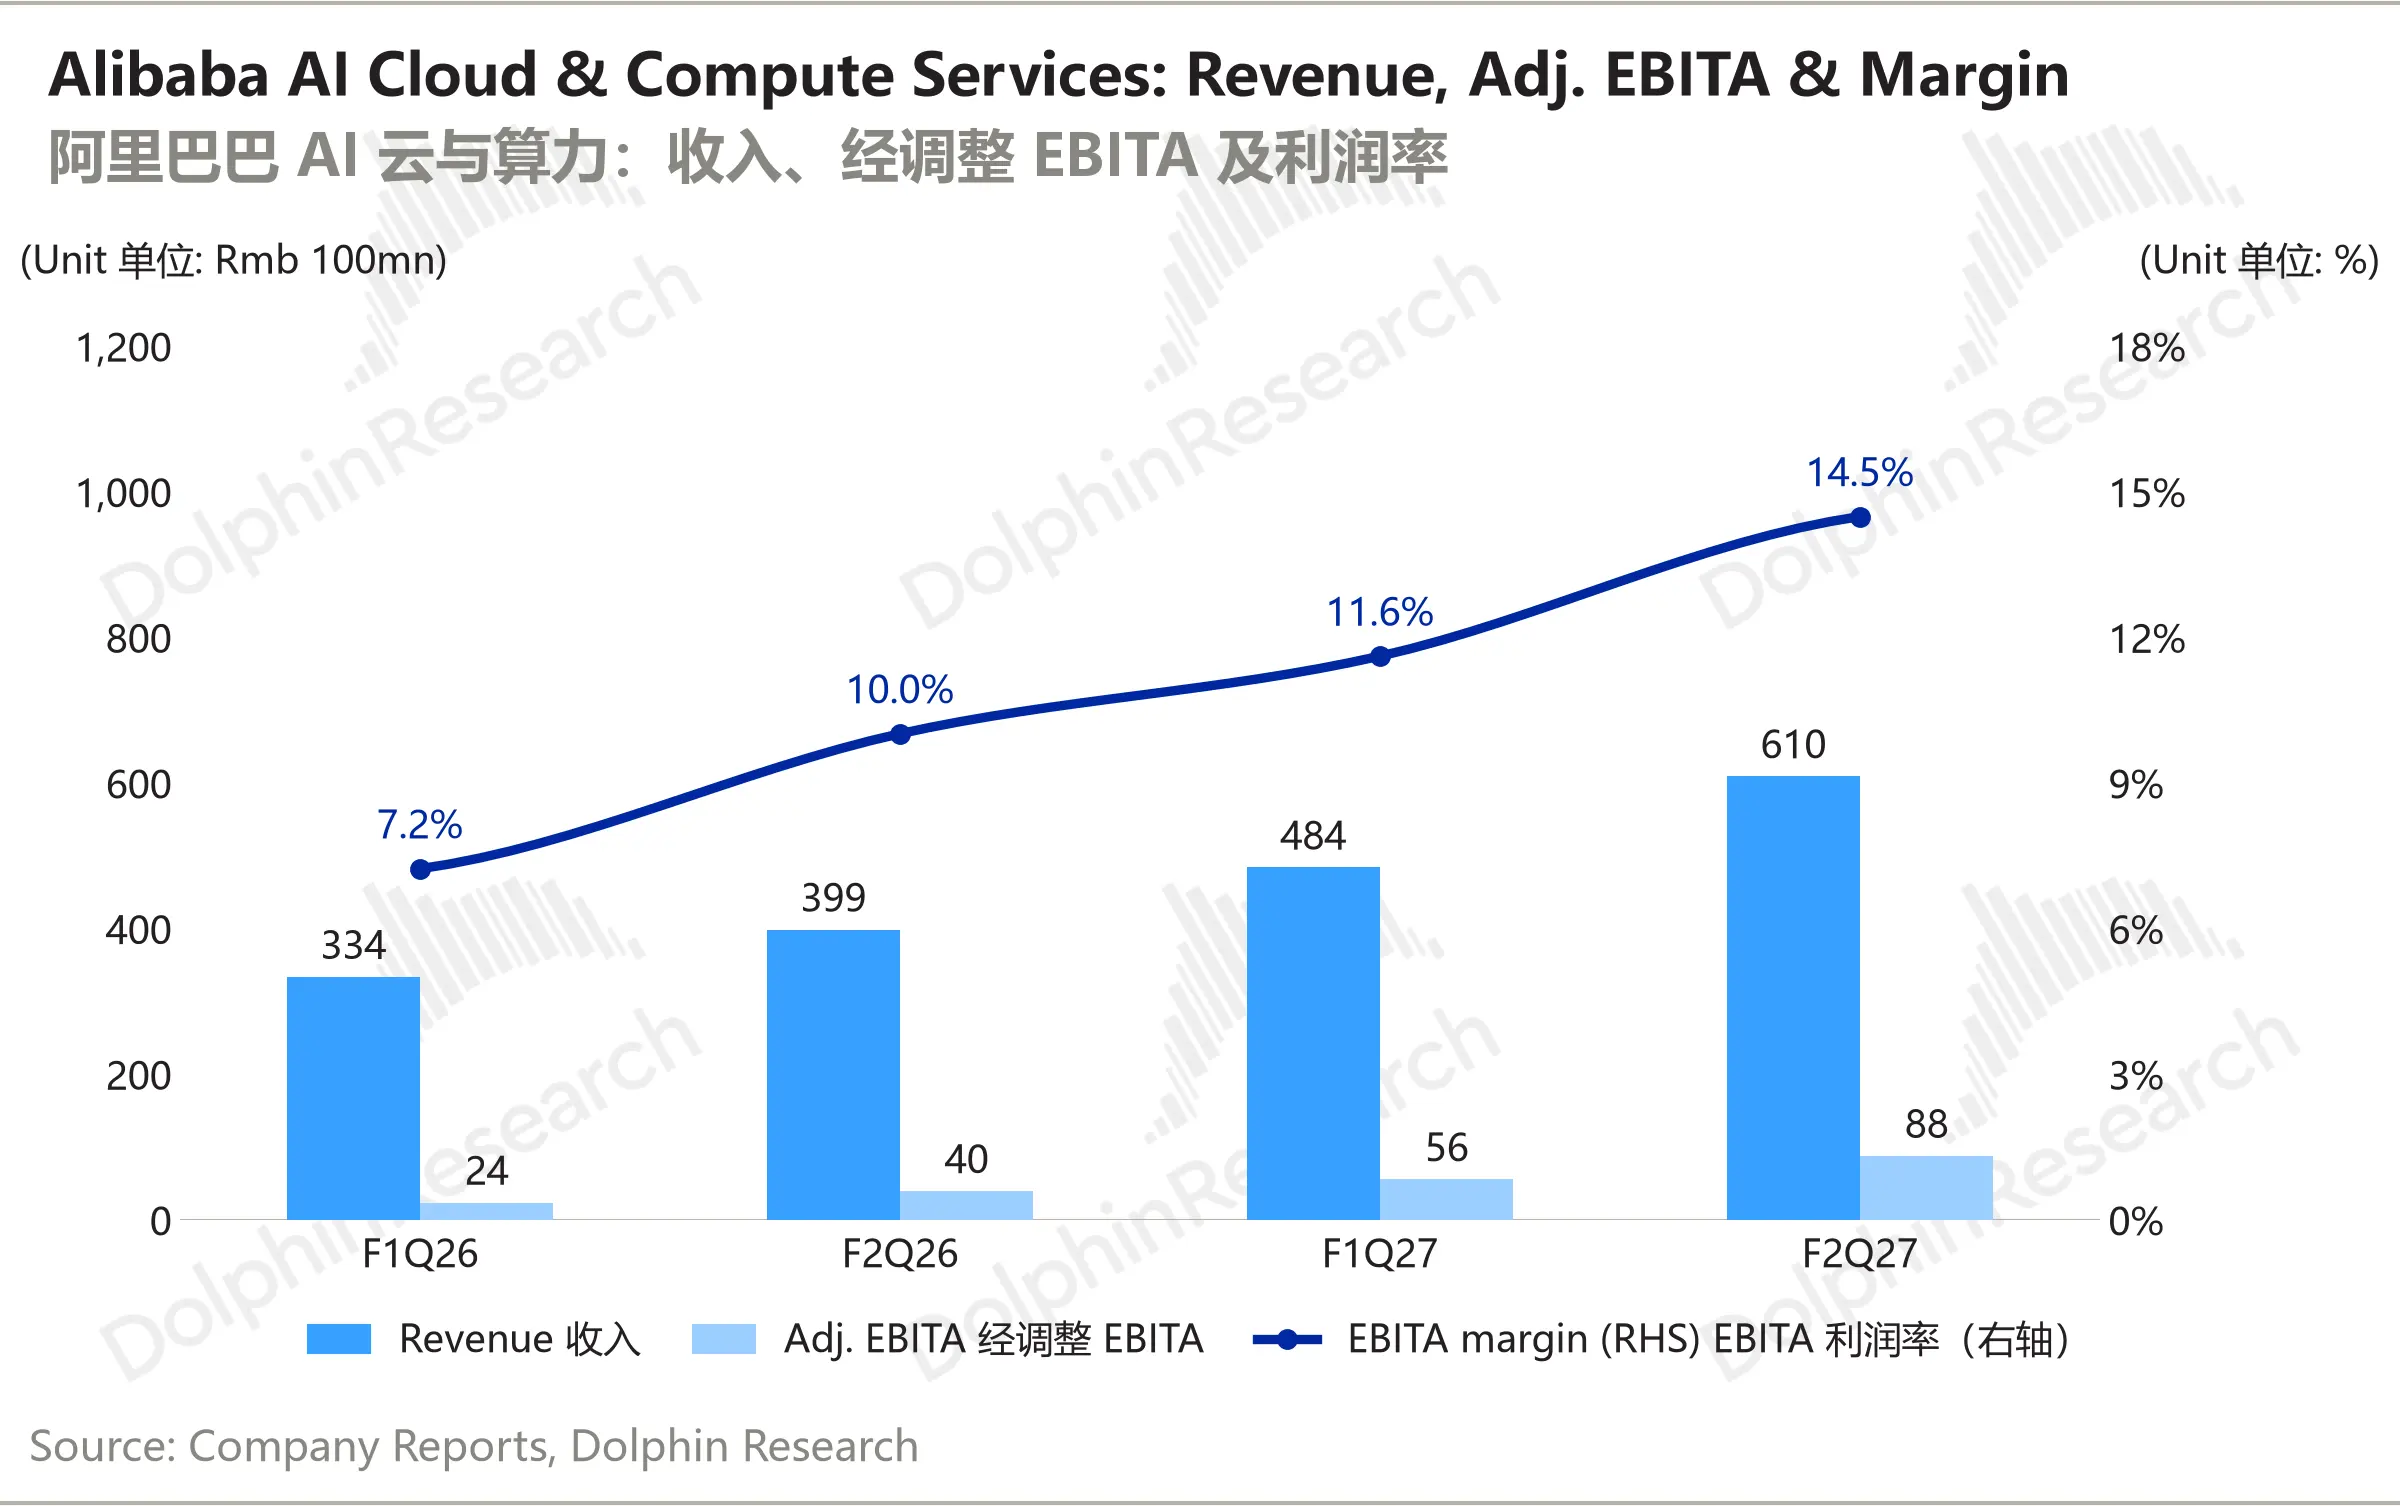
Alibaba 2QF27 First Take: Solid print, extending last quarter's playbook of steady e-com and aggressive AI. Group revenue was approx. RMB 271.5bn, +10% YoY and in line with consensus. Adj. EBITA was approx. RMB 32.6bn, up sharply YoY and QoQ and about 10% above latest bulge-bracket estimates, with no obvious weak spots.

AI Cloud growth accelerated as expected, with a clear margin uplift. The newly carved-out AI Labs & Apps saw faster revenue growth and narrower losses QoQ, while on e-com, CMR declines stabilized and food delivery loss reduction drove a profit rebound.

1) AI Cloud: Growth keeps accelerating; margins improved materially

AI Cloud and compute revenue was approx. RMB 61.0bn, +53% YoY, up from +45% last quarter and at the top end of the +50% to +53% range expected by major banks. EBITA margin rose to 14.5%, higher QoQ and well above the ~12.5% many expected. Both growth and profitability moved in the right direction.

Revenue from external customers grew even faster at +64% YoY vs. +45% last quarter. Growth at Alibaba Cloud and T-Head remains robust.

2) E-com: CMR declines stabilized; profitability rebounded materially

Nominal CMR fell approx. 5% YoY, still negative but stabilizing and in line with consensus. Excluding the revenue offset from the new merchant partnership program, CMR was approx. +1% YoY, similar to last quarter.

On the back of sizable YoY loss reduction in food delivery and stable profitability in domestic long-distance e-com, the commerce group delivered adj. EBITA of approx. RMB 38.9bn, more than doubling YoY and broadly in line with major banks. Intl commerce revenue declined 8% YoY, mainly due to EU customs reform impacting AliExpress.

While broader commerce was not flashy, growth has stabilized. Combined with post-loss-reduction profit recovery, the trajectory looks decent.

3) AI Labs & Apps: Revenue accelerated; losses narrowed QoQ

The new AI segment, covering foundation-model R&D and Qwen applications across 2B and 2C, generated approx. RMB 4.4bn in revenue, +51% YoY and faster than ~16% last quarter. Losses were approx. RMB 10.5bn, narrowing from ~RMB 13.9bn last quarter. Faster growth with smaller losses is a constructive trend.

4) Capex & Cash Flow: Investment remains high; FCF outflows narrowed

Capex was approx. RMB 50.5bn, +60% YoY, still elevated but down from ~RMB 67.7bn last quarter and below some pre-print estimates. Similarly, FCF outflow remained large at RMB 34.5bn but narrowed meaningfully QoQ.

High investment and the resulting cash pressure are the one clear blemish this quarter. That said, the sequential trend has improved.$BABA-W(09988.HK) , $Alibaba(BABA.US)

图片 1,共 1 张
D
Dolphin Research

NetEase 3Q26 First Take: Q3 results were weak and fell well short of expectations. The pipeline gap that Dolphin Research flagged last quarter was amplified as consumer sentiment deteriorated in H2 and short-form dramas likely siphoned user time. Evergreen titles alone could not carry the load.

This miss may trigger some downside and position clean-up, but we see potential buyers on weakness. We think there is support below current levels.

(1) A new product cycle is due in 2027, led by the highly anticipated Ananta. If the stock sells off materially on the print, we expect some funds to step in, though near mid-Jan launch investors should be mindful of a possible performance miss. Positioning risk rises into the go-live window.

(2) On the trading side, NetEase has been more resilient vs. China ADR peers near term. Some investors view it as an AI hedge, given modest AI spend and intact cash flows, rather than a pure bet on fundamentals.

1) Rare decline in game revenue, with only tepid deferred gains: Q3 game revenue turned negative YoY and badly missed. We also think Street expectations were too high, as Sea of Remnants already missed in Q2 and Q3 only had a semi-new casual edition of Fantasy Westward Journey mobile, so the pipeline gap pressure was bound to rise.

Low revenue was not a recognition timing issue, as deferred revenue grew just 4% QoQ. Implied bookings fell 8% YoY and rose 6% QoQ, marking the weakest 'summer peak season effect' for NetEase in nearly five years.

2) Games cooled, margins felt it immediately: With high-margin games soft, GPM dropped 200bps QoQ to 69%. Youdao and Cloud Music provided drag rather than lift. Opex fell 5% in absolute terms on lower S&M and G&A (fewer launches reduced marketing, and admin staff faced pay cuts), with opex ratio stable YoY and slightly higher QoQ.

3) Higher dividend, halted buybacks: Dividend per ADS was $0.585 (+22% QoQ). There was virtually no buyback in Q3, as NetEase typically runs elastic repurchases tied to market cap levels. Cash stood at RMB 175.2bn (Approx. $26.1bn) at quarter-end, with RMB 10.5bn operating cash inflow for the quarter, underscoring its cash-cow profile. $NTES(09999.HK) , $NetEase(NTES.US)

图片 1,共 1 张
D
Dolphin Research

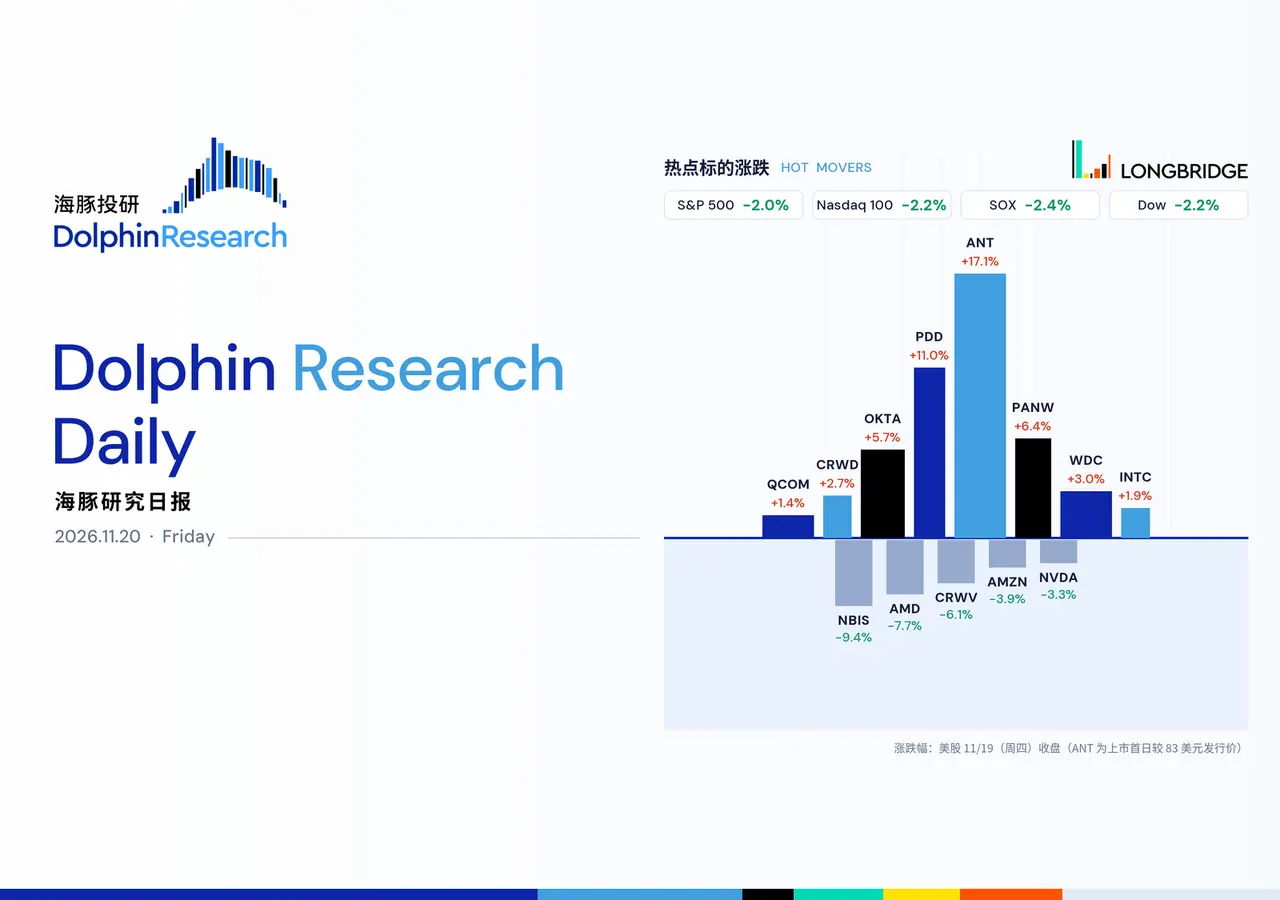
Anthropic Prices at $83 in Record IPO; INTC Joins MSFT's Advanced-Packaging Fast Track | Daily News Recap

1119 | Dolphin Research Focus: 🐬 Macro/Industry 1) The Fed's Oct. minutes indicate almost all participants still see the need for further tightening. Governor Waller said the Dec. meeting should consider a 50bps hike.

The implied probability of a Dec. hike climbed to about 90–95%. DXY rose to its highest since Apr 2025.

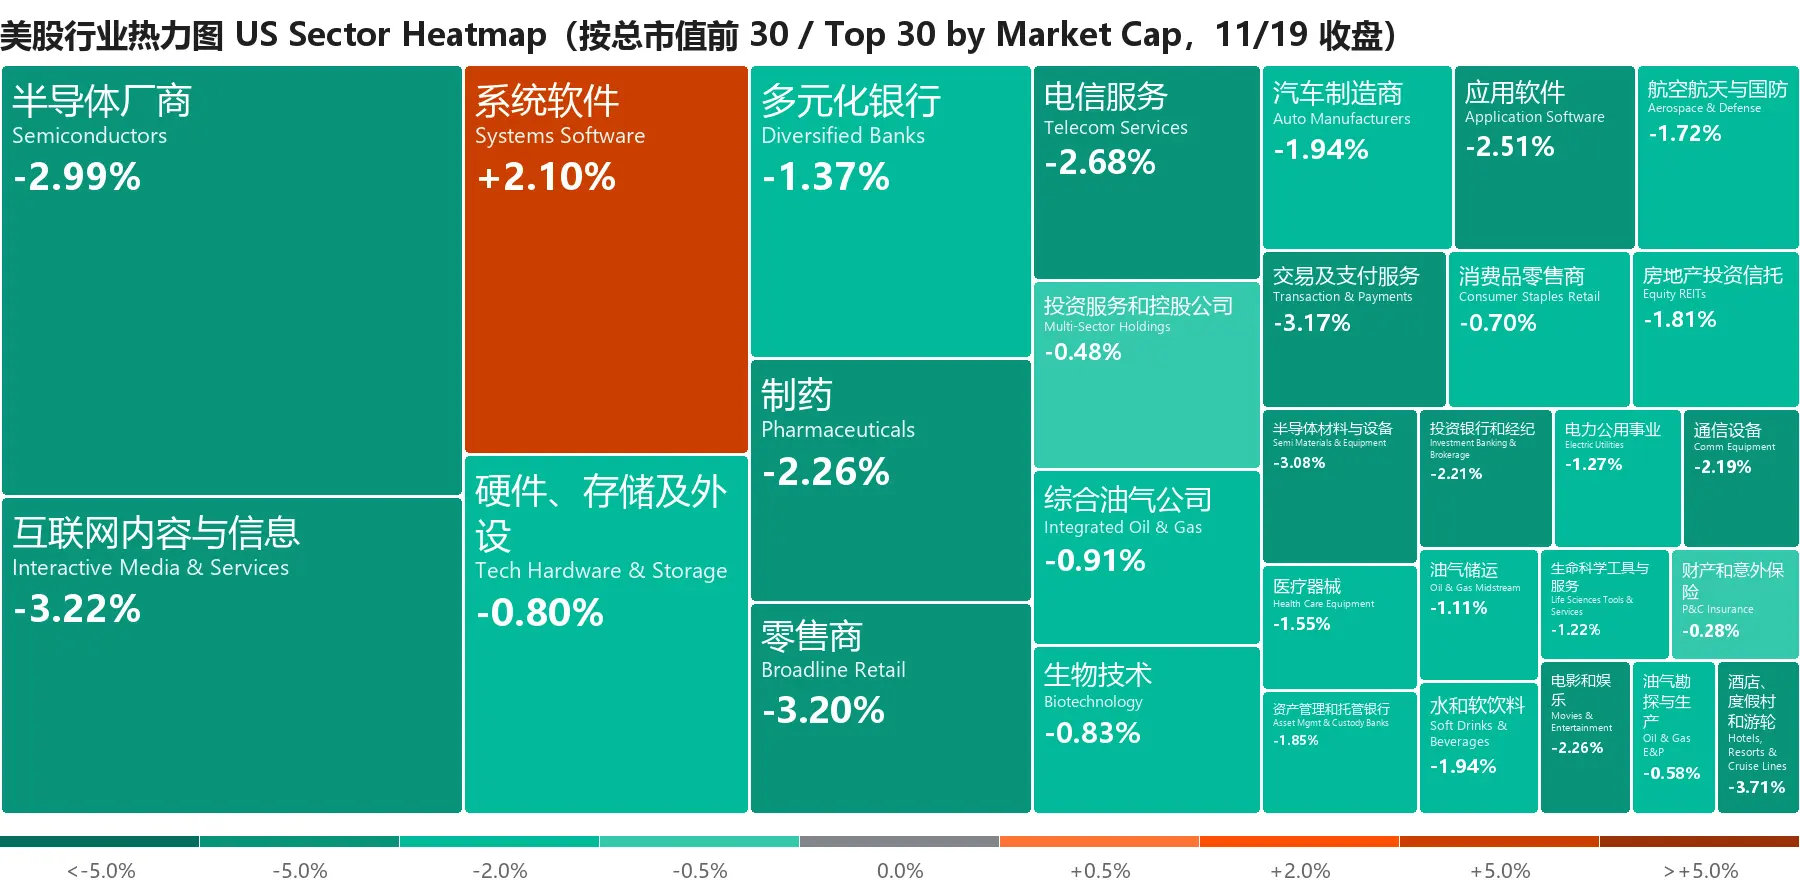
Gold fell 3.5% to $3,728, while LME copper dropped 5.7%. The S&P 500 fell for a fifth straight session and slipped below the 200-DMA. Tightening expectations, coupled with doubts over AI infrastructure demand, ...

图片 1,共 1 张
Today’s Key News Recap
D
Dolphin Research

The second driver of high GPM for optical module leaders sits downstream: customers like Nvidia, Google, and Amazon differ in speed grades, form factors, and architecture choices, resulting in a massive SKU count. Who can accommodate that breadth?

Customers are not just choosing a supplier; they want partners that co-define specs and deliver volume on schedule. Dolphin Research sees this as the second reason why leaders such as InnoLight and Eoptolink earn higher margins than pure assembly OEMs.

• Early engagement: Leaders typically co-develop the next, even the next-next generation during product introduction. Cost-down levers (e.g., replacing EML with silicon photonics) are kept in-house; when the new generation ramps and pricing is higher, they sell directly to end customers. Contract manufacturers only collect a manufacturing service fee and do not take design, inventory, or pricing risk.

• Scale capacity: With numerous SKUs layered on large-volume demand, vendors with scalable capacity are best placed to take the orders. This gives leaders a distinct scale advantage.

Vendors that co-define next-gen specs with customers and win qualification early can command a premium. That widens the gap vs. pure contract manufacturing.

图片 1,共 1 张
D
Dolphin Research

To make money, optical module makers must first secure supply. Laser chips and DSPs together account for roughly 50% of a module's value and are the most likely delivery choke points, which is a primary source of leaders' higher GPM. Dolphin Research outlines the key bottlenecks in this link.

• DSP: the bottleneck shared by all module makers. They have little in-house design capability and rely mainly on Marvell and Broadcom, which together control over 90% of the high-end DSP market.

3nm parts are likely to face shortages due to yield issues. No one is self-sufficient; what differs is who secures the larger allocation.

• Optical chips: constrained by substrate scarcity. InP substrate mass production has high barriers, with supply concentrated in Sumitomo Electric, JX Metals, and AXT in the U.S.

Even the leading laser-chip vendors must procure substrates externally. As a result, these high-value optical chips will be the core bottleneck for module makers.

In supply-constrained cycles, vendors with assured delivery gain share and pricing power, which is one source of superior margins.

Those with stronger supply-chain management and higher self-sufficiency in capacity enjoy more secure supply.

图片 1,共 1 张
D
Dolphin Research

Tencent 3Q26 First Take: Q3 piled pressure on shareholders — spent more, earned less.

vs. expectations, the delta sits on costs.

Beyond the print, investors will focus on how prepayments are handled amid limits on remote compute, the roadmap for deploying compute, and any changes to Capex targets.

Worth tuning into the call.

1) Two standout numbers: core operating profit fell 6% YoY.

Free cash flow was -RMB 70bn, likely the two figures that will jar investors most.

Given unprecedented AI capex, a profit air-pocket at traditionally asset-light Tencent is not a surprise.

But the shareholder base skews toward value investors and lower-risk insurers who track cash profits.

Until the unit economics of AI and cloud leasing show up in the P&L and cash flows, the story will be a hard sell.

Q3 recognized Capex came in at RMB 81.4bn, well above Street’s RMB 55–60bn.

Full-year now looks >RMB 220bn.

It includes ~RMB 86bn of compute prepayments; ex-prepayments, FCF was RMB 16.9bn, still below prior years.

2) Revenue miss mainly in Intl games; cloud and ads were solid.

Q3 revenue was RMB 207.3bn (+7.5% YoY), ~RMB 3bn below consensus, driven by softer Intl games and social network.

Ads rose 18%, aided by short-form drama (IAA often ~70%).

After the 'Green Bubble' mini-dramas launched via WeChat Mini Programs, traction has been strong.

Creator incentives were raised in Oct, drawing studios from Hongguo to Green Bubble; MAU has reached 150mn.

Cloud is reported within FinTech & Biz Services; standalone growth accelerated to 35%, at the top end of sell-side estimates.

Workbuddy DAU exceeded 10mn, up from 6.13mn in Sep with faster MoM momentum.

3) Margin pressure from IT and content costs.

Opex ratios were stable, so the variance comes from compute-related costs.

Drivers include higher server colocation and D&A, plus content costs (likely from consolidating Ximalaya long-audio rights and mini-drama distribution).

4) Buybacks constrained: Q3 repurchases totaled HKD 7bn at an Avg. price of HKD 443/share, taking 9M to HKD 30bn; full-year likely under HKD 50bn.

If compute spend cannot be deployed, shareholder returns could re-accelerate. $TENCENT(00700.HK) , $Tencent(TCEHY.US)

图片 1,共 1 张