
$QQQ seems to have fired the first shot after $Broadcom(AVGO.US)'s earnings report the day before yesterday, and then the market sentiment turned sour. During yesterday's session, the declines of many individual stocks were somewhat contained, but $Broadcom(AVGO.US), which ignited the fuse, still fell by 12.59%.
This decline is probably not something that can be resolved by a one-day pullback; at least $Broadcom(AVGO.US) hasn't shown any signs of stopping the decline yet.
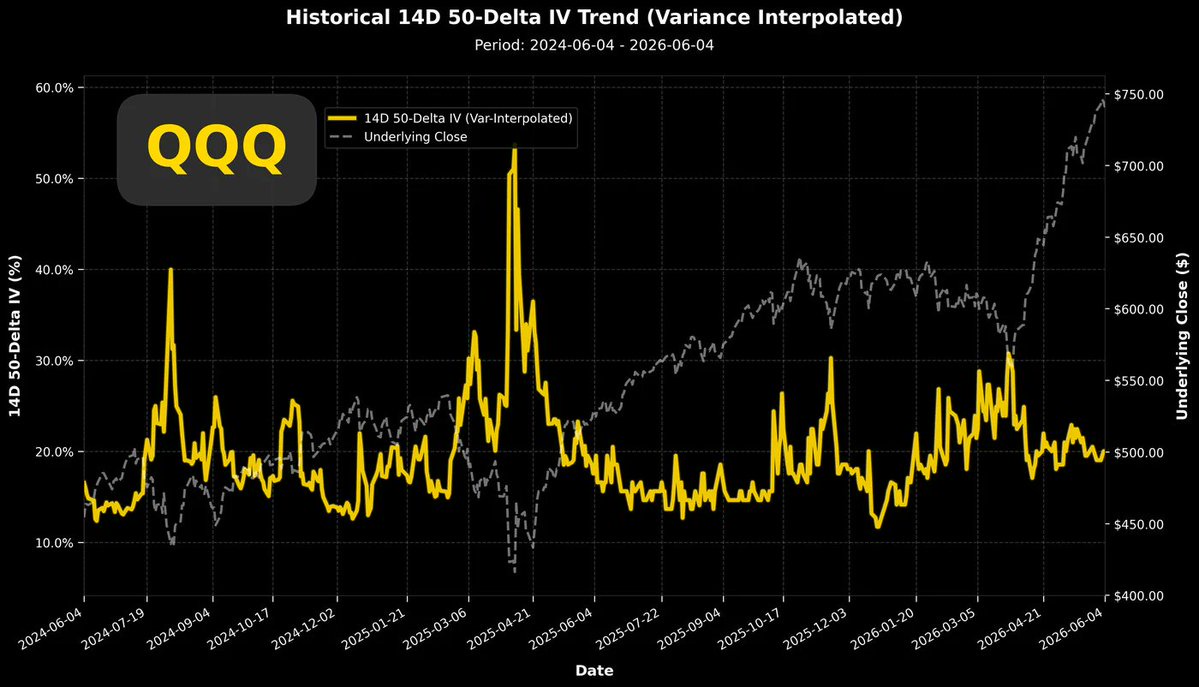
If we look at the trading data of the broader market ($QQQ). The top-left chart shows the overall implied volatility over the past two years, which is currently in a neither-here-nor-there position. Whether it's going back to the low point at the beginning of the year or the high point in April, we can always deduce some ideas. Unfortunately, the current volatility is at a moderate 20% level.
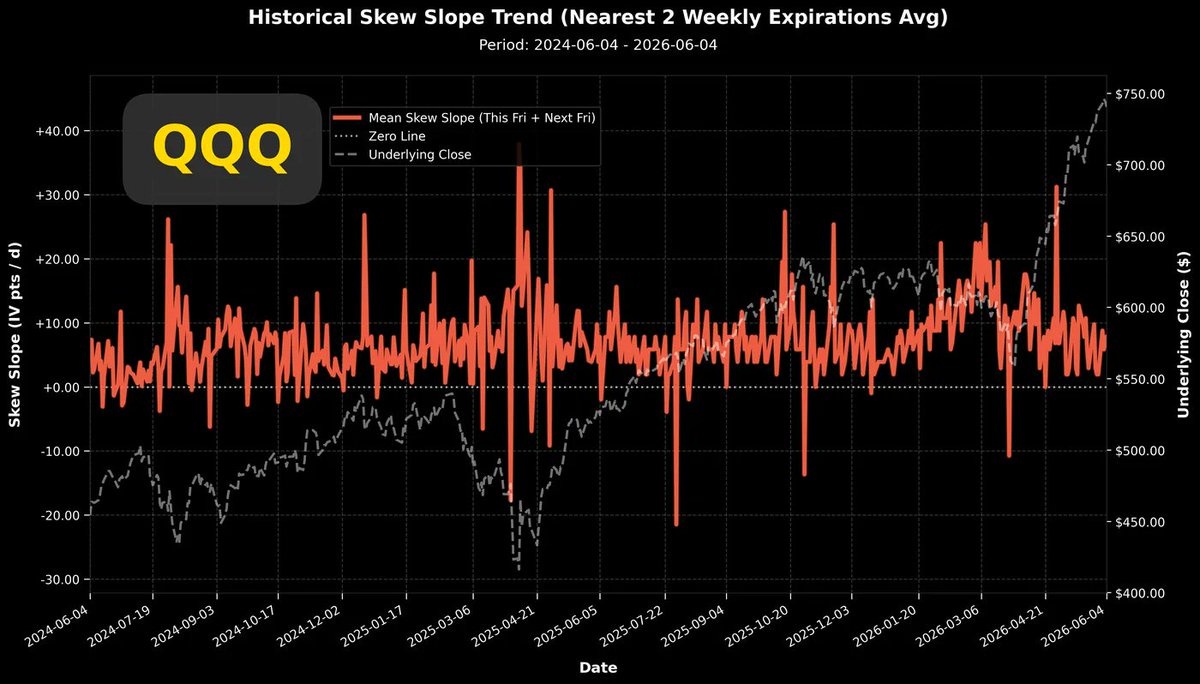
The top-right chart shows the implied volatility over the past two years. The current volatility spread is also very close to past benchmark values, and like most sectors, it is dominated by the volatility of put options.
Quite pessimistic. According to the two charts above, if we are currently in a downtrend, we can say with certainty that we are still in the early stages, and there is still some distance to go before reaching near the bottom.
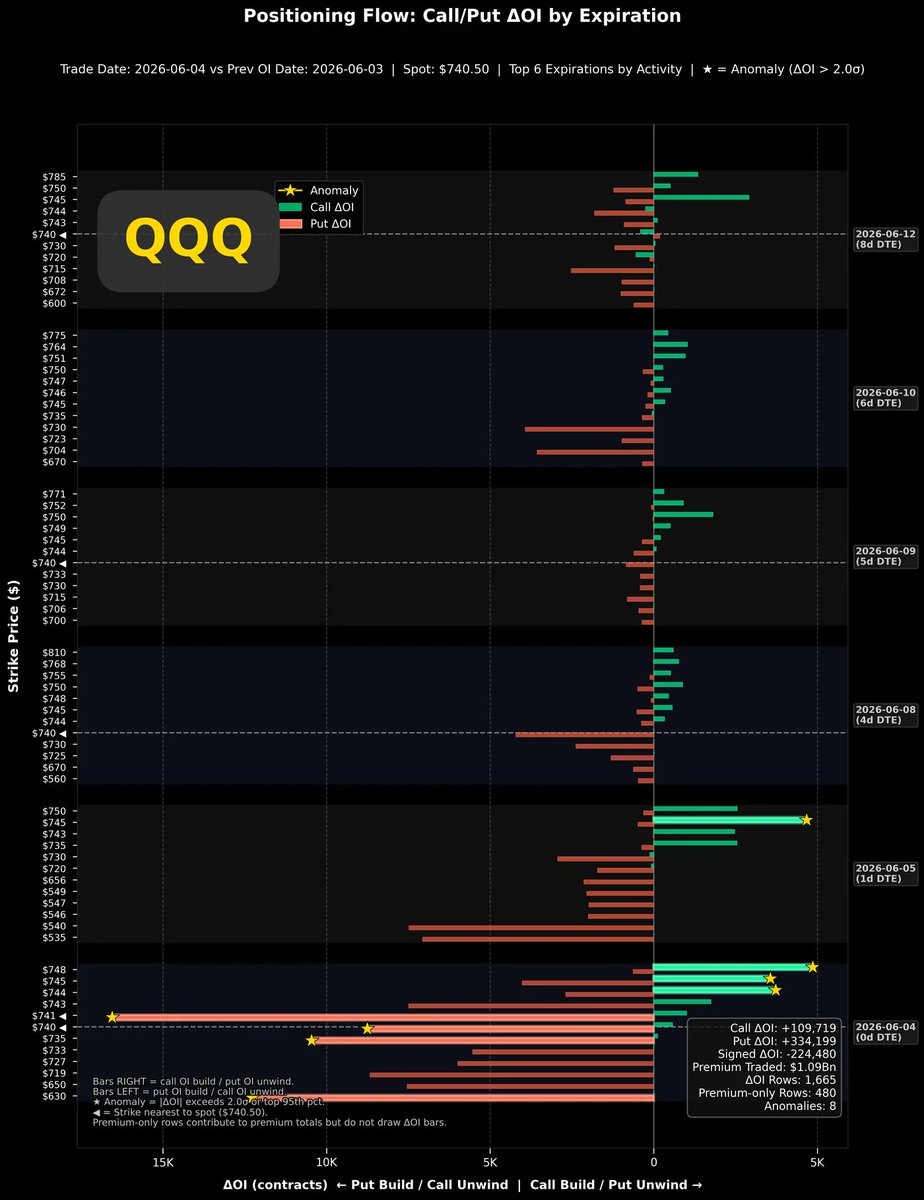
The bottom-left chart is the intraday position change chart. This chart is even more sensitive, showing active put option opening. But this is not necessarily bullish or bearish, because despite such obvious new put option positions, the volatility spread hasn't shown a significant jump (whether up or down).
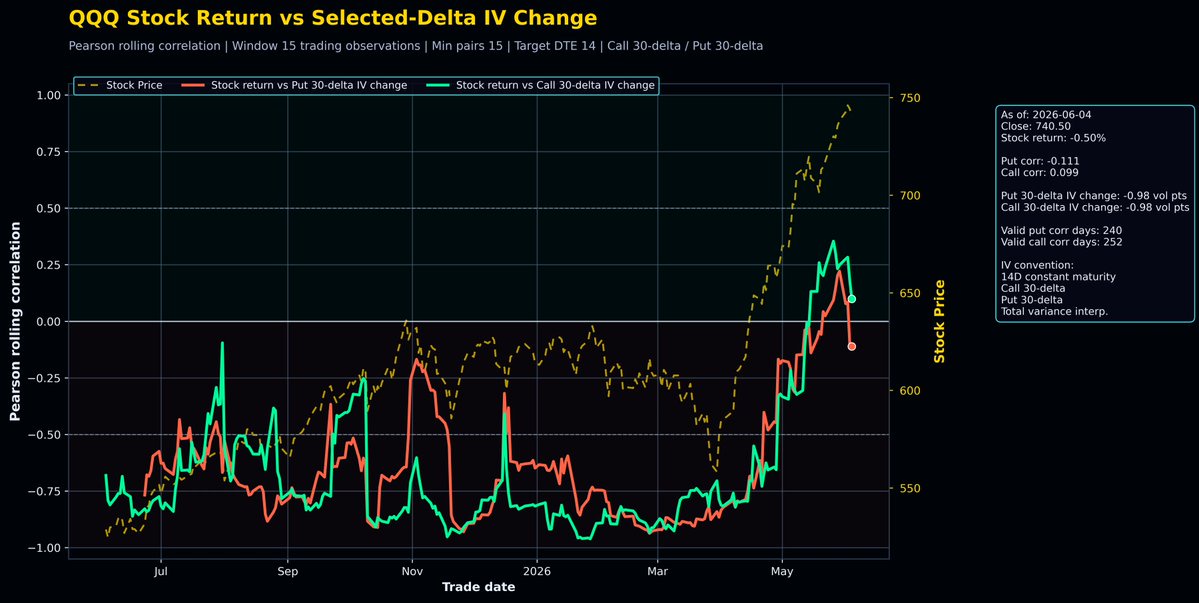
The bottom-right chart shows an even worse characteristic.
How bad is it?
In the trading of the past year, the QQQ ETF has never had a positive correlation coefficient. In the past year, it was only in the last month that the stock price return and volatility showed a positive correlation for the first time.
The bottom of a stock price is more often associated with a highly strong negative correlation, while the top of a stock price is prone to trading overheating.
When the stock price rises and the call option volatility also continues to rise, this is a behavior of chasing prices to buy Calls. When the stock price falls slightly, the volatility of Calls also falls in sync. The bullish sentiment is shallow; it follows rises and flees from falls. This synchronized, sensitive state is the primary condition for incubating a significant downtrend.
Conclusion: Everyone, be careful! There are no signals of a price bottom, and some signals indicate that the main decline phase has not yet appeared.
The copyright of this article belongs to the original author/organization.
The views expressed herein are solely those of the author and do not reflect the stance of the platform. The content is intended for investment reference purposes only and shall not be considered as investment advice. Please contact us if you have any questions or suggestions regarding the content services provided by the platform.
