

 BABA Diamond Holder
 BABA Return Rate
$Gold.com(GOLD.US)
🏆 [Weekly] Gold Watch: Can Bulls Hold the $3,945 Line?
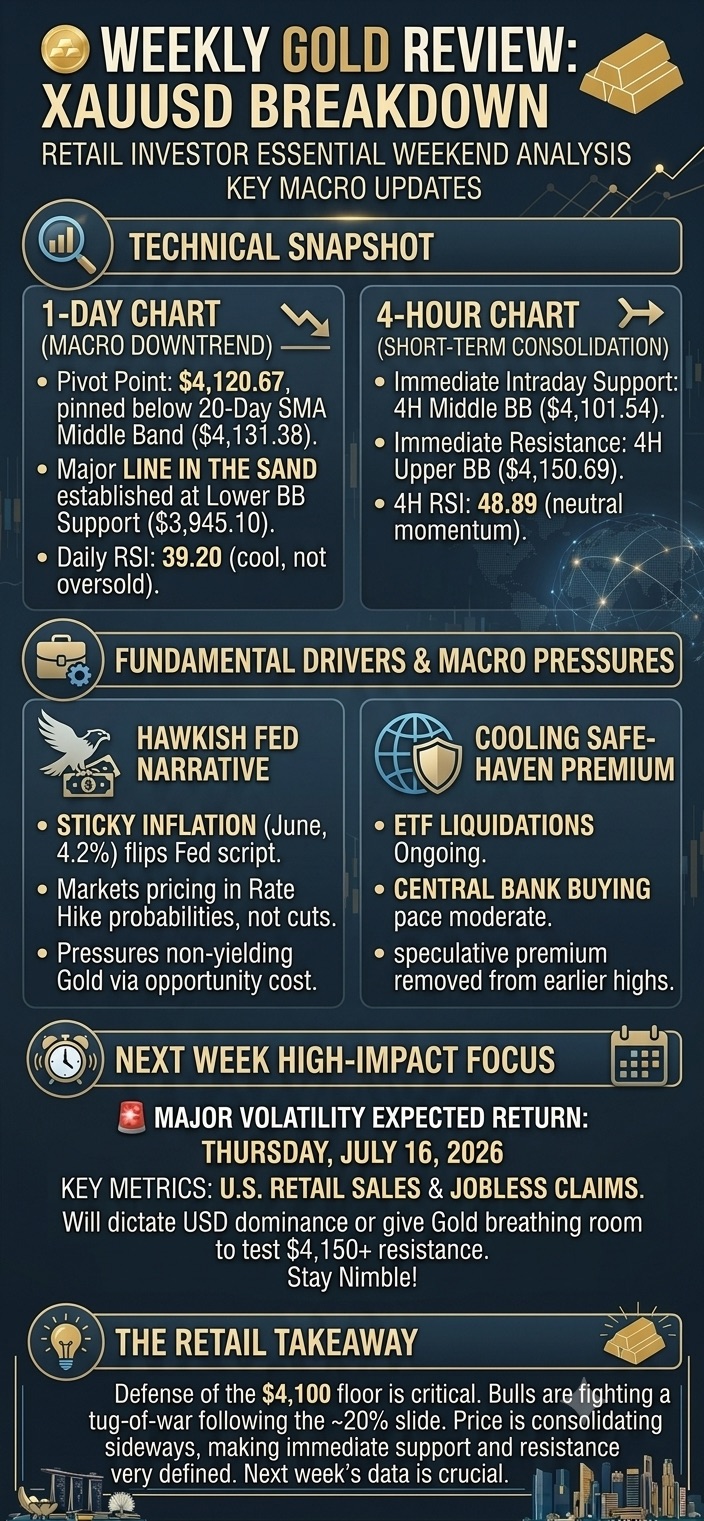
Gold (XAUUSD) is locked in a tight battle to steady itself, after falling 20% from its January peak. Below is your clear weekend breakdown of technical levels and market forces.
🔷Technical Snapshots
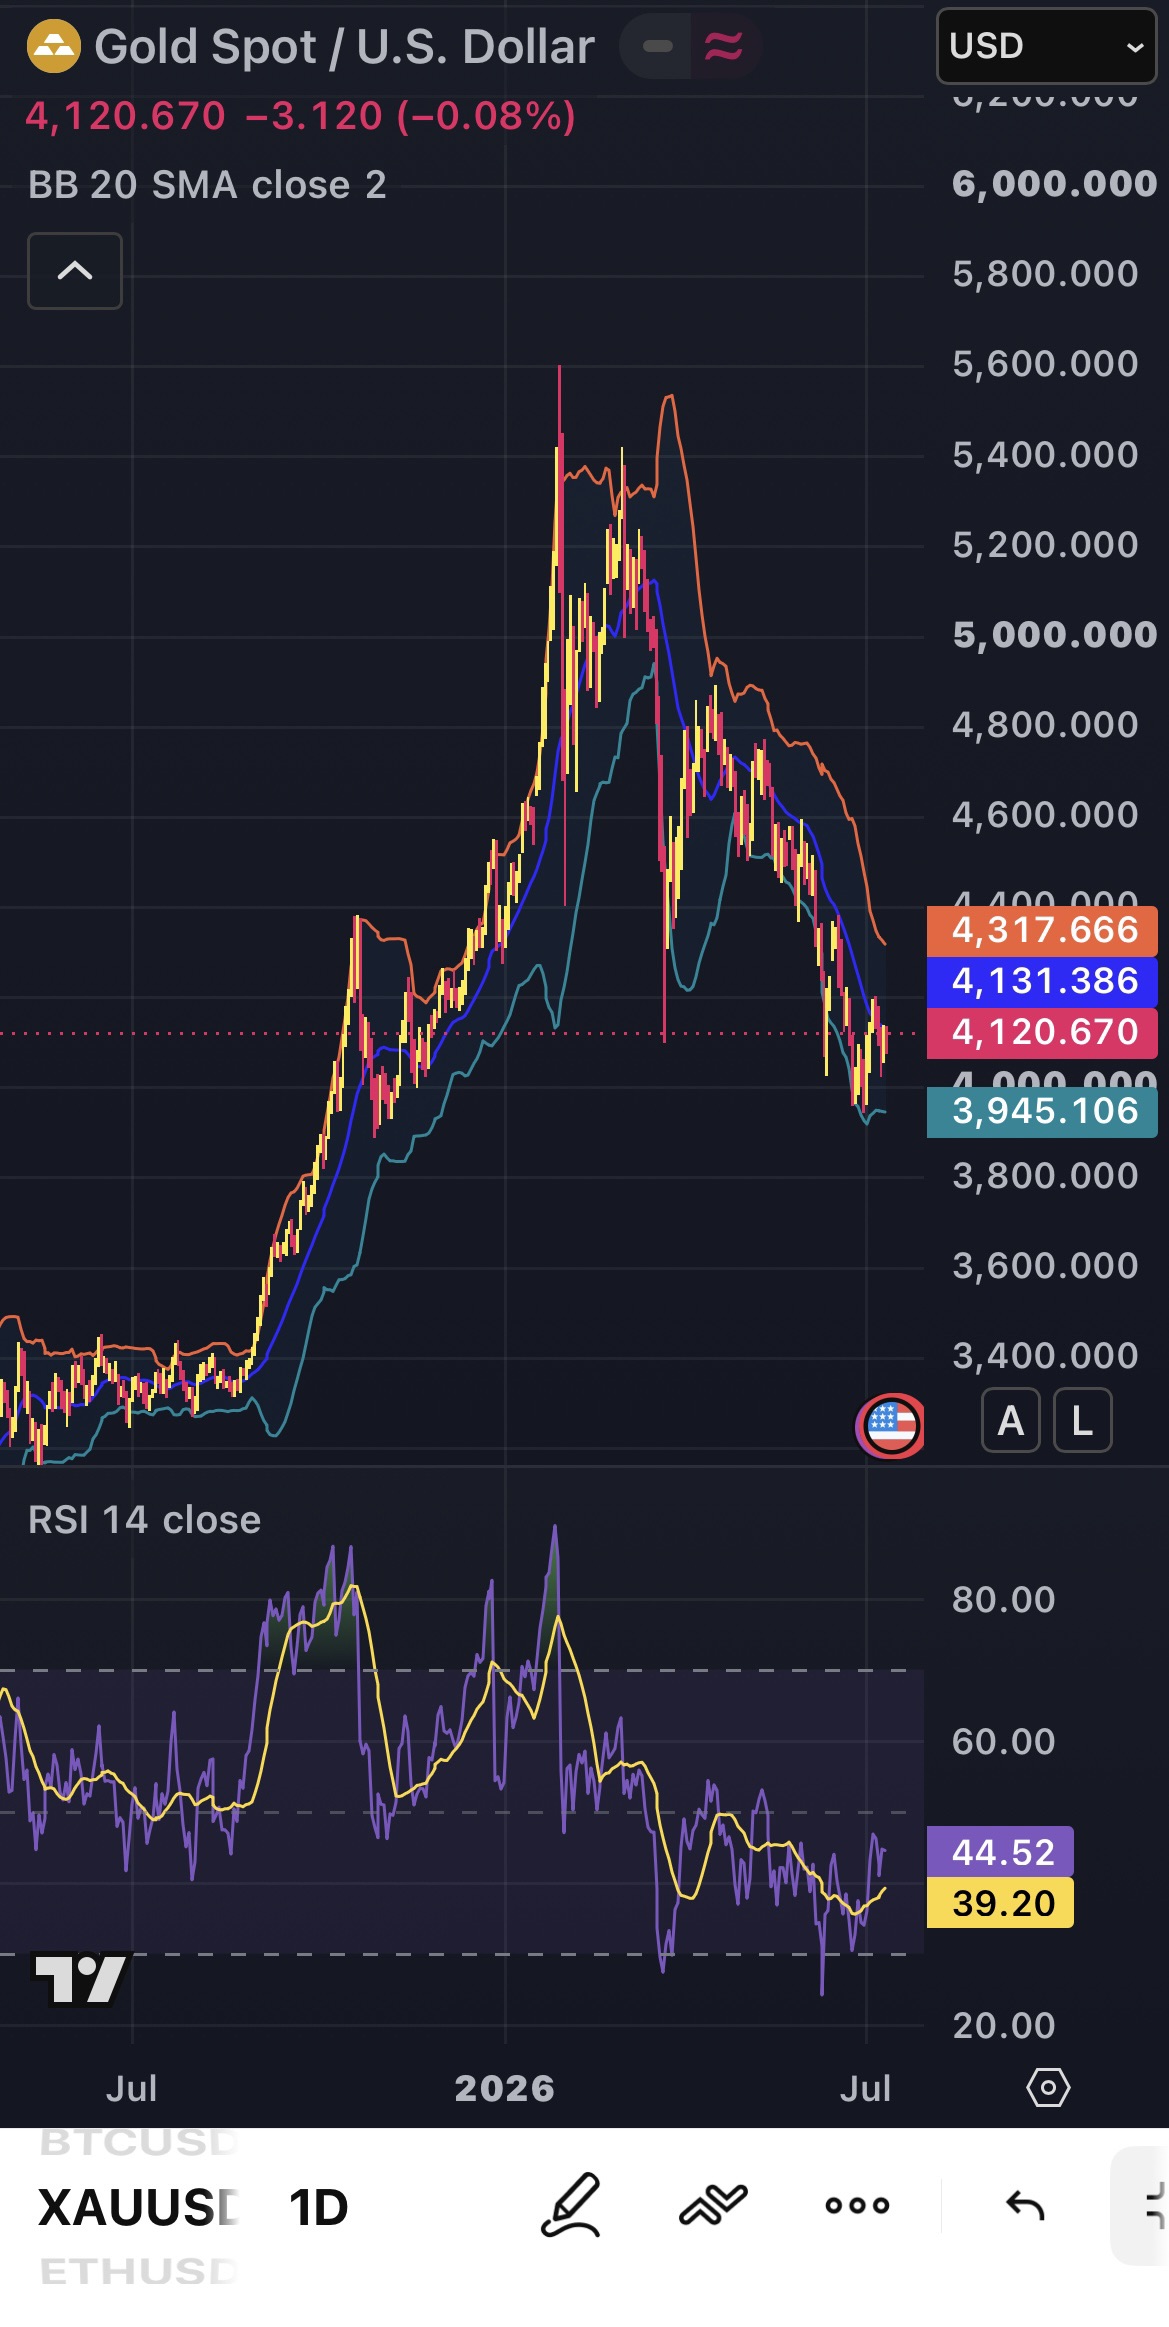
🟢 Daily Chart
• Gold is in a clear downtrend overall, currently trading around $4,120.67
• Stuck below the 20-day moving average ($4,131.38) – bears still have the upper hand for now
• Critical support sits at $3,945.10 (lower Bollinger Band) which has held strong.
• Daily RSI at 39.20: no longer oversold, but not yet showing strength
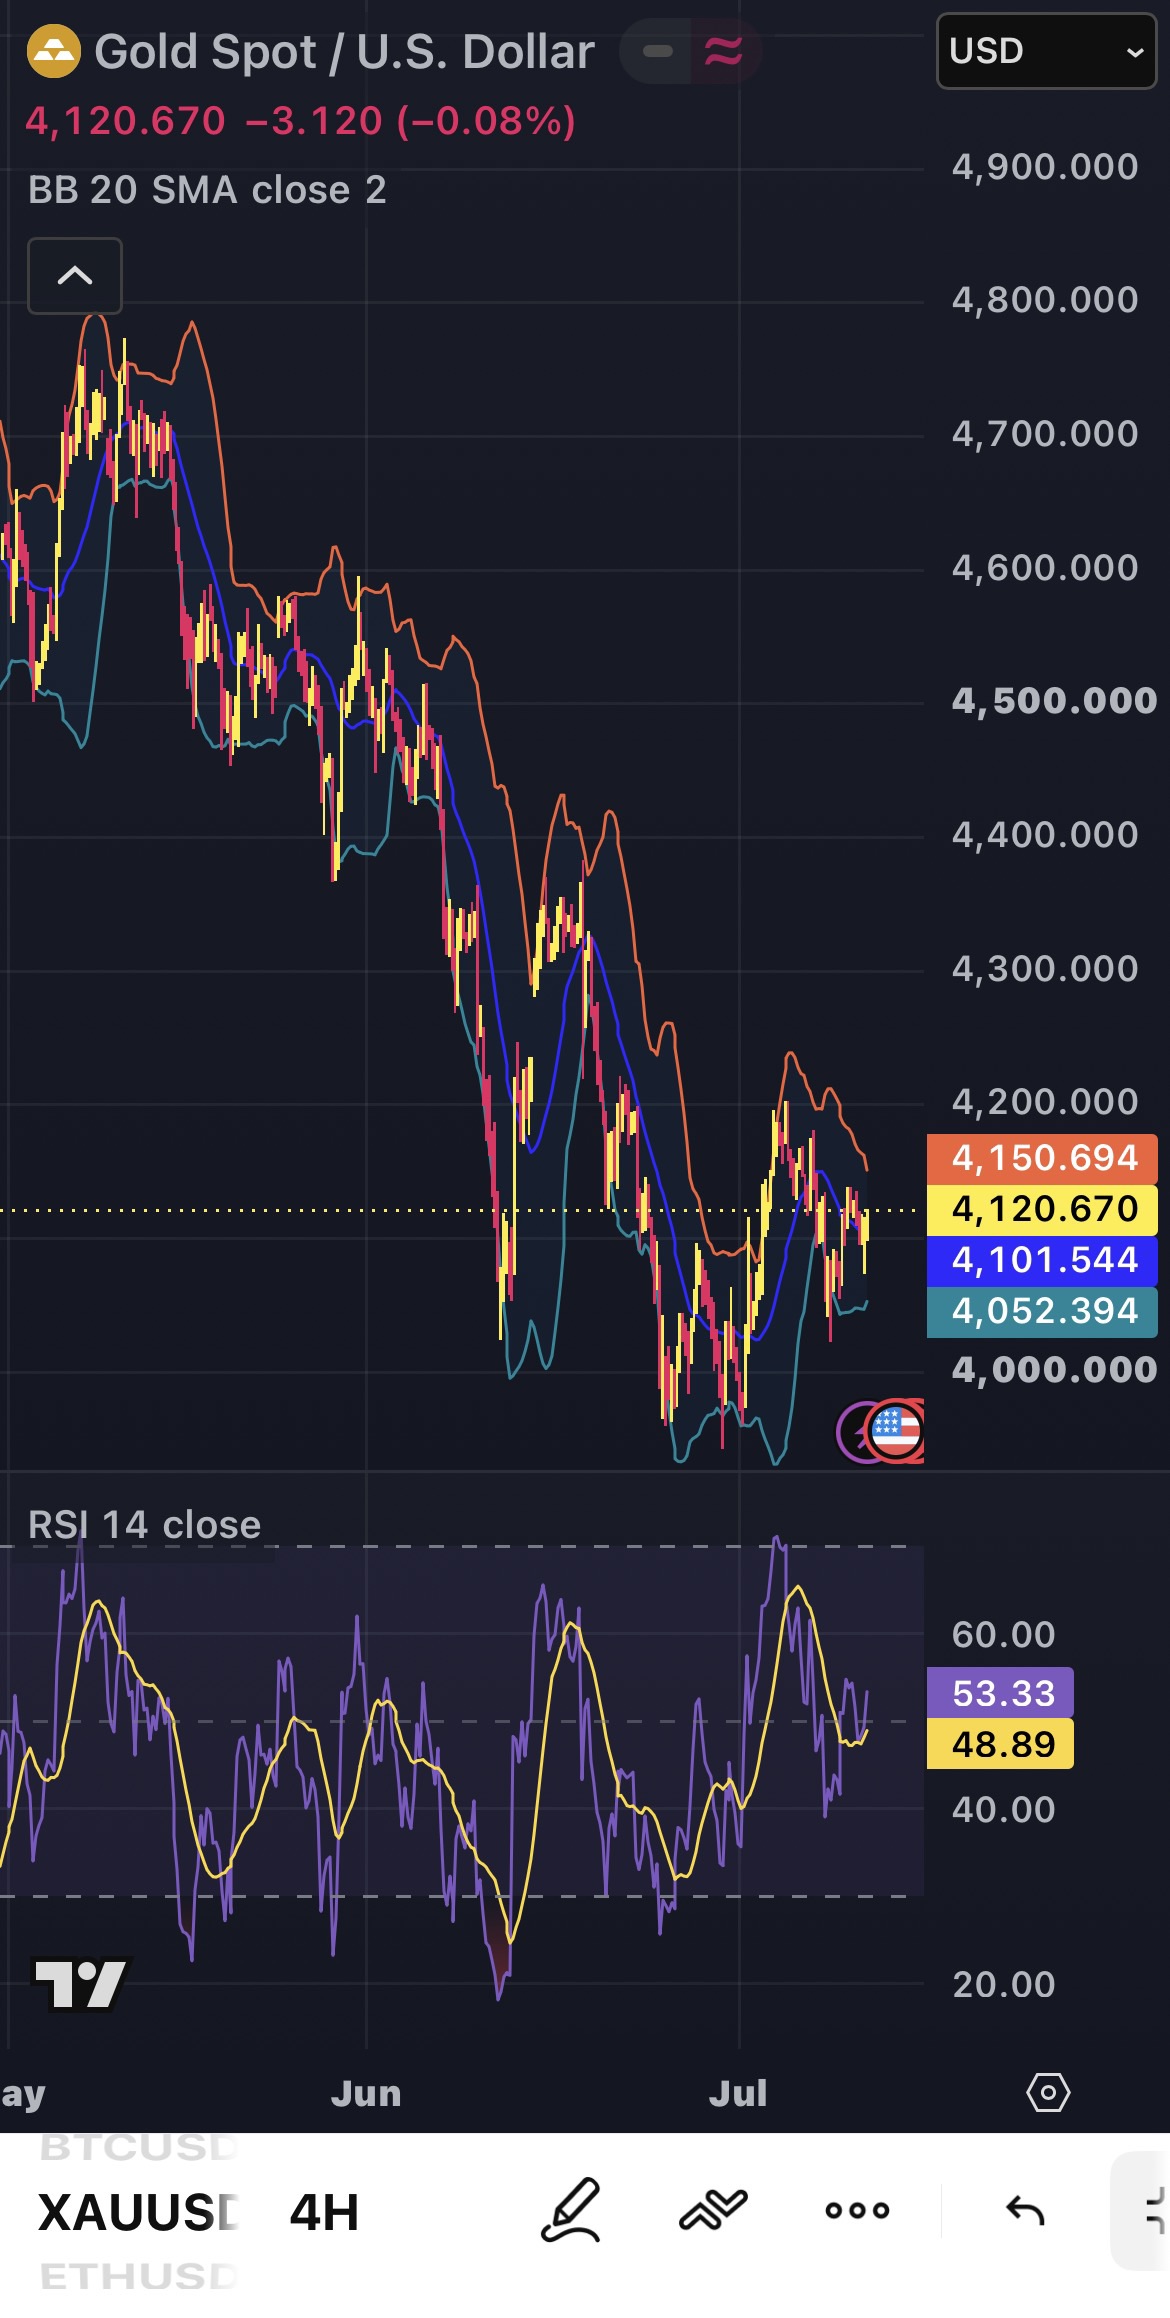
🟢 4-Hour Chart
• Short-term price is moving sideways, with no clear push up or down
• $4,101.54 (4-hour mid band) now acts as immediate support
• Next resistance to beat: $4,150.69 (upper Bollinger Band)
• 4-hour RSI = 48.89: neutral momentum ahead of the new trading week
🔷 What’s Moving Gold Right Now
• Hawkish Fed shift: June inflation hit 4.2% – driven by energy costs. The current markets now expect rate hikes, not cuts. Higher rates make non-interest-bearing gold less attractive.
• Fading safe-haven demand: Gold ETFs are seeing outflows and central bank purchases have slowed – removing the extra “fear premium” that boosted prices earlier this year.
🔷 Key Date To Watch Next Week
Thursday, 16 July 2026 – US Retail Sales and Jobless Claims data will be released.
These numbers will decide if the US dollar keeps rallying or if gold gets room to challenge the $4,150 resistance. Keep your positions flexible!
Not financial advice. Do your own DD😁
The copyright of this article belongs to the original author/organization.
The views expressed herein are solely those of the author and do not reflect the stance of the platform. The content is intended for investment reference purposes only and shall not be considered as investment advice. Please contact us if you have any questions or suggestions regarding the content services provided by the platform.
