

 Likes Received
 Posts
Posts$ORCL Missed the Recovery Opportunity? (06/30)

Tesla, MicroStrategy, RKLB, PLTR.....some stocks that have fallen deeply all saw significant price rebounds yesterday (06/29). Why is Oracle lagging behind? We continue to monitor Oracle, as it stands in the position of an AI service infrastructure provider and has taken on high financial leverage. This is a candidate stock that can fall sharply but also rise particularly sharply.
Recent related information:
1. Oracle ($Oracle(ORCL.US)) plummeted over 19% last week, marking its largest weekly drop in 25 years, with RSI falling to 29.3 (oversold zone) and a clear bearish alignment.
2. Its largest customer, OpenAI, accounts for nearly half of the order backlog. OpenAI's PO has been delayed to 2027, raising doubts about its payment capability.
3. Competition among Chinese models (e.g., Zhipu) is fierce, with usage costs significantly decreasing, potentially leading clients to reduce spending. The outlook for AI infrastructure builders is unfavorable.
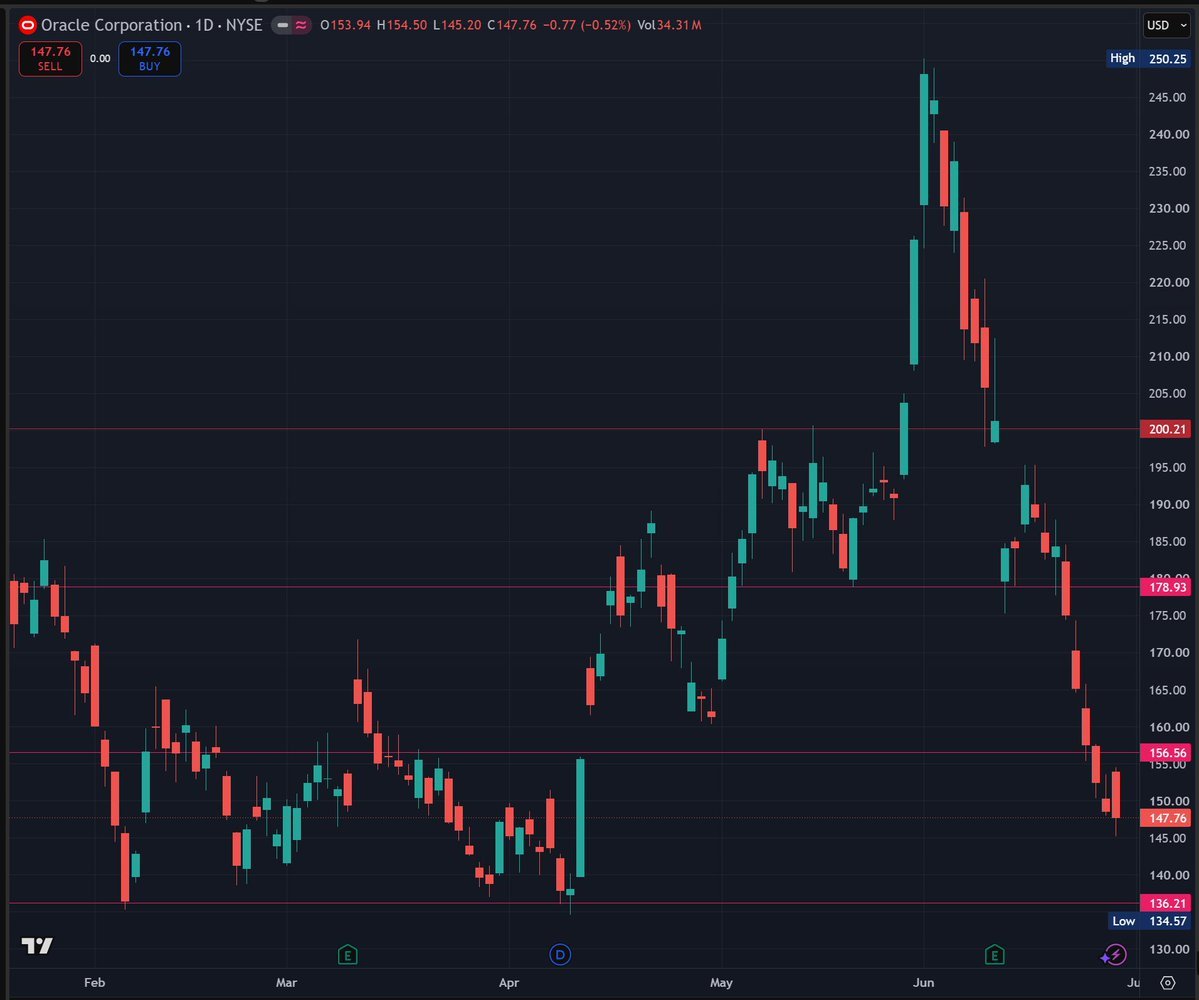
On Monday (06/29), many individual stocks that had fallen deeply recently coincidentally rebounded. However, Oracle's stock price still closed down -0.52%. Looking closely at the daily K-chart above, the stock price had risen at one point yesterday but ended slightly down, leaving a lower shadow.
My judgment on the K-chart remains unchanged. Once the stock price officially breaks below $156, it enters a boxed oscillation range between $156 and $136. There's a high chance of testing the key support level at $136.
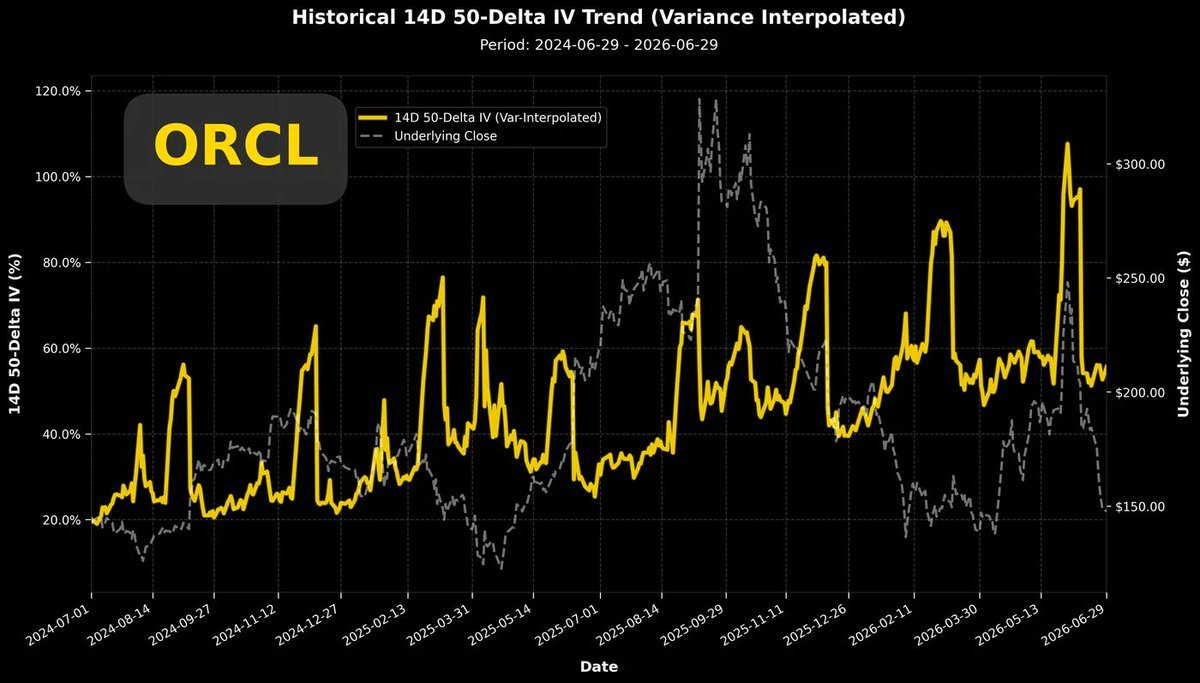
The above chart shows the implied volatility over the past two years. This chart reveals that the volatility benchmark dropped relatively low after the earnings report, and the oscillation amplitude of volatility itself is surprisingly small.
I particularly like going long when both stock price and volatility are low. As long as the timing aligns with the earnings report effect, there's an opportunity to gain returns from both the stock price and volatility. Oracle's next earnings report will be in early September, so we still have a few weeks to observe and wait for an opportunity.
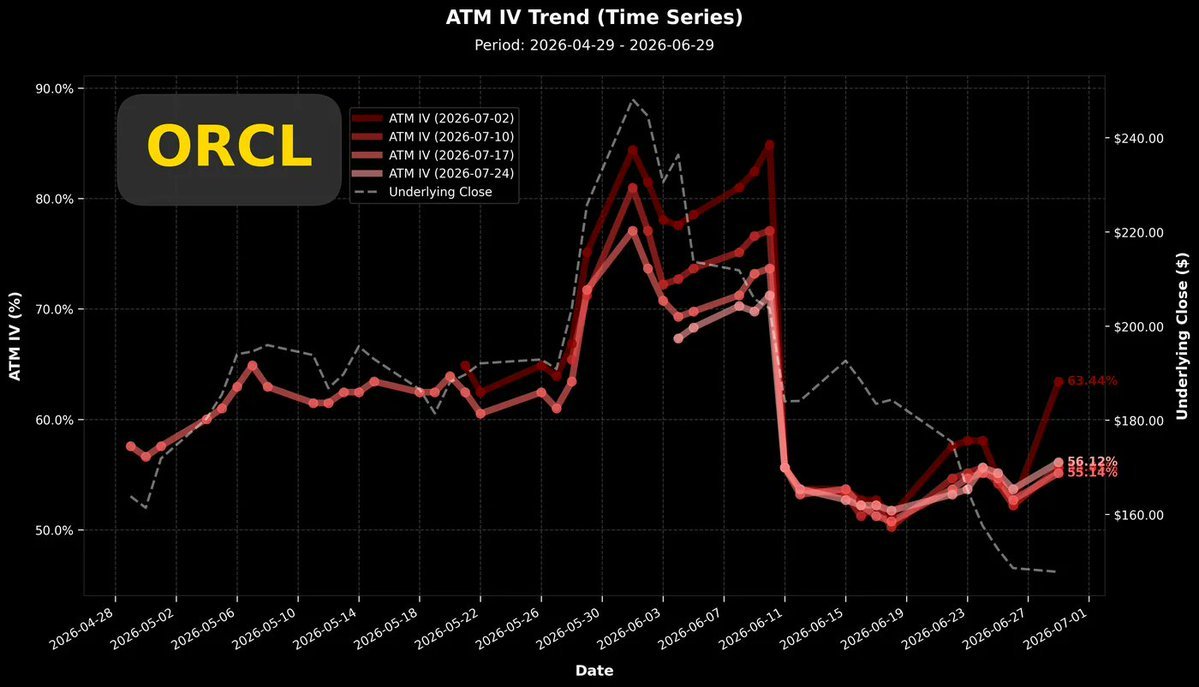
A close look at the volatility difference for upcoming option expiries shows that yesterday's stock price fluctuation (from rising to falling) caused option volatility to rise.
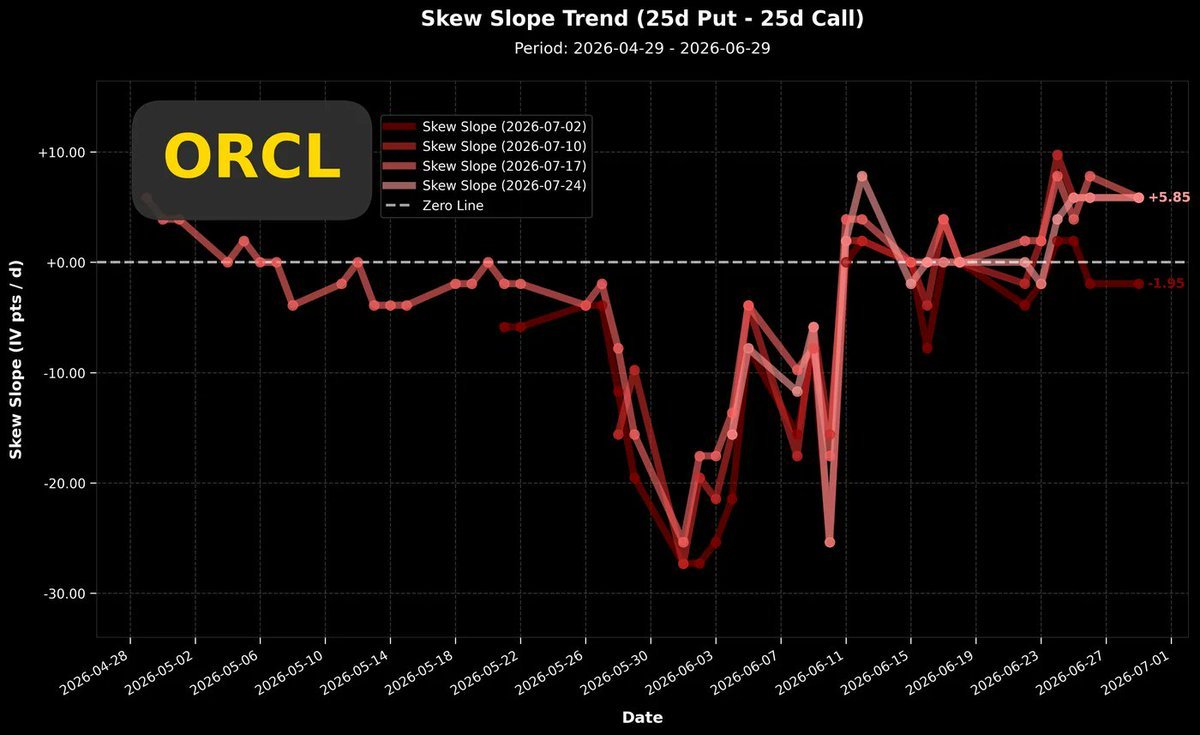
The chart above shows the recent trend of the volatility difference for $Oracle(ORCL.US). Except for the options expiring this Friday, which are slightly negative, the volatility differences for other slightly longer-term options have already turned positive, fully recovering from the extreme bullish enthusiasm seen in early June.
Currently, the mainstream option trading for Oracle involves slightly chasing prices to buy put options. Yesterday's stock price disturbance did not form a direction in the volatility difference, which remained flat.
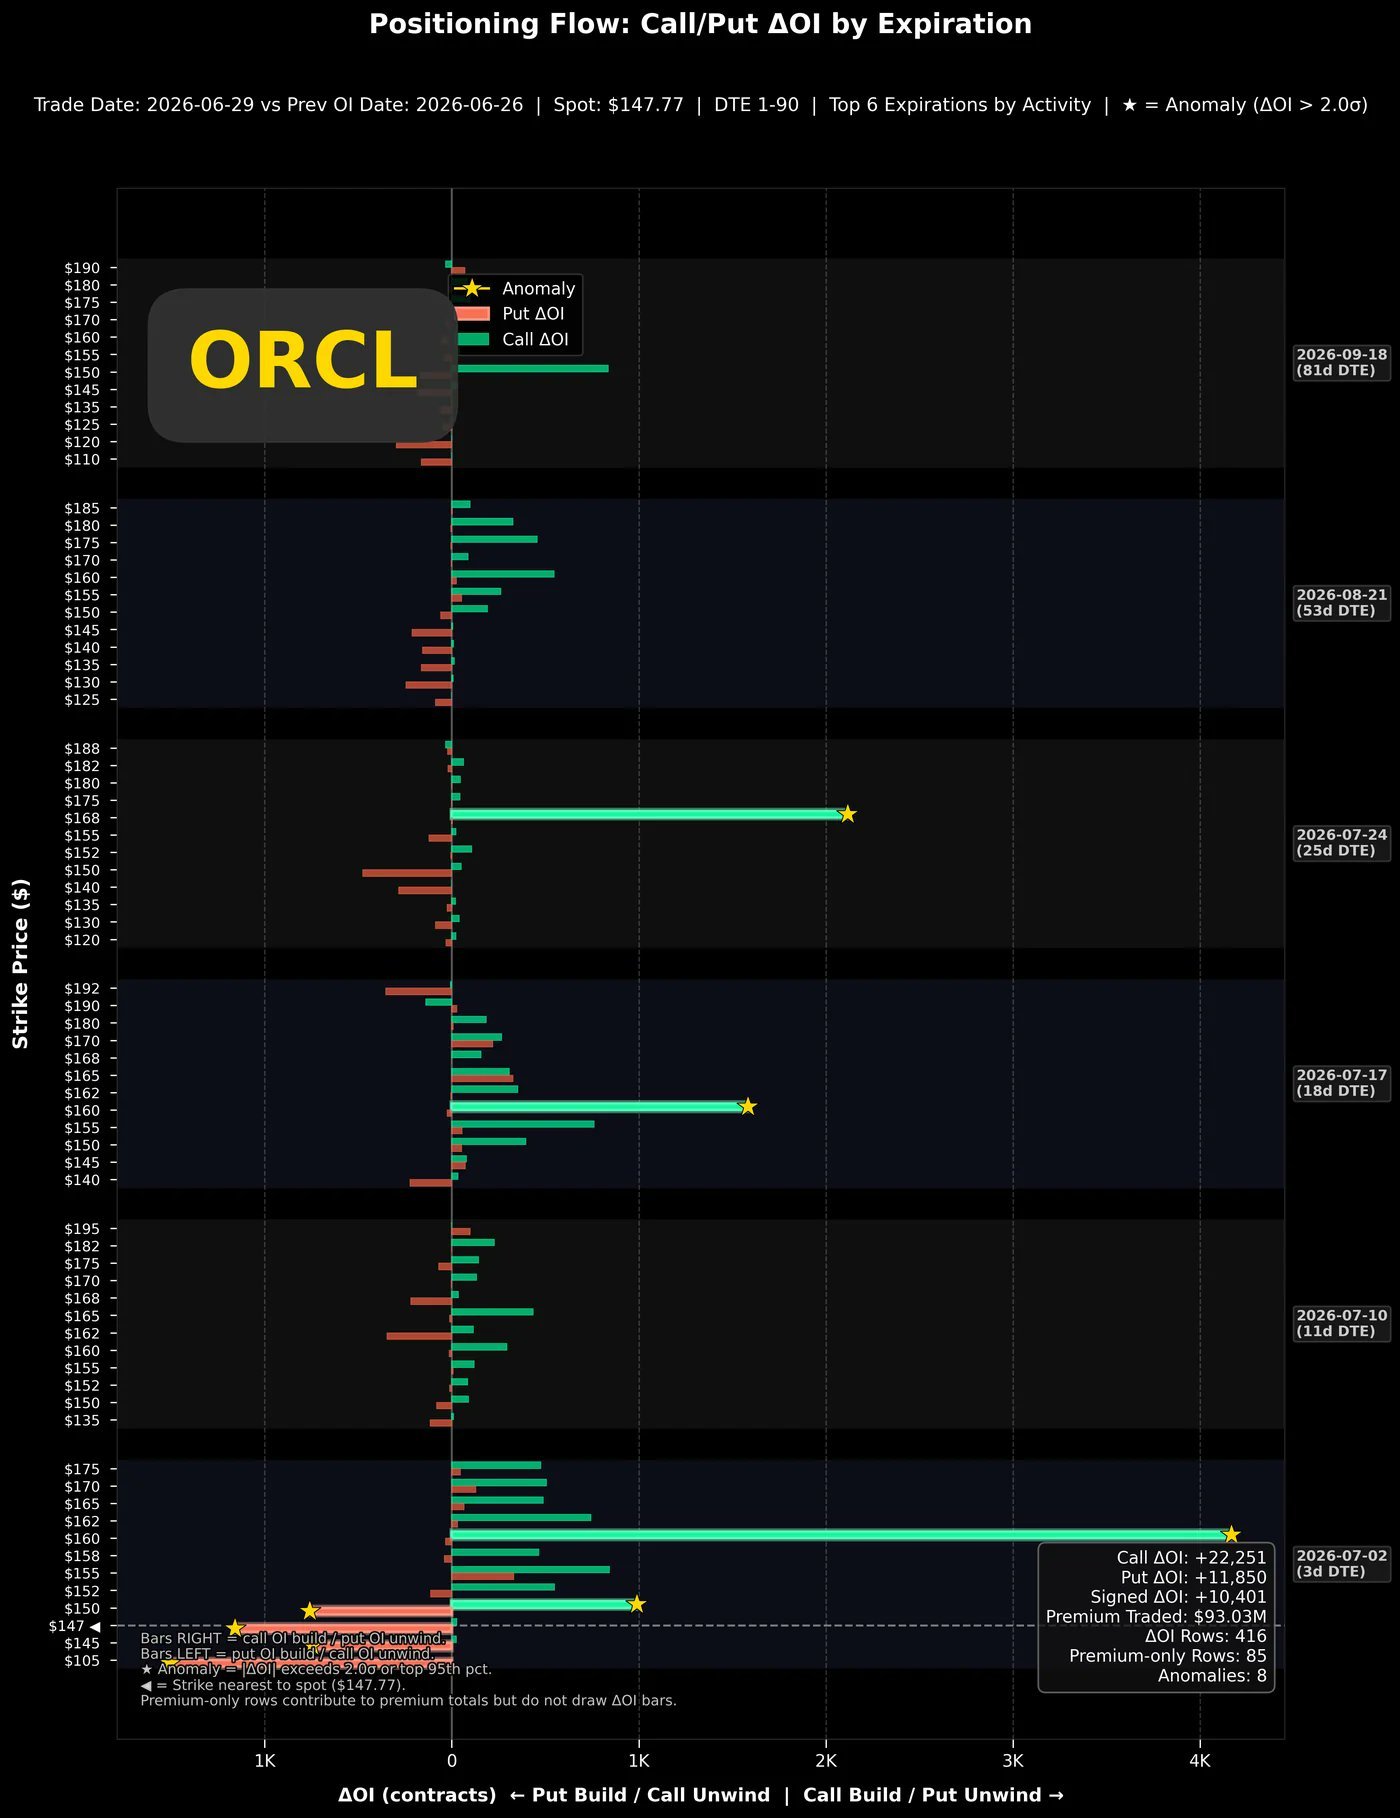
In yesterday's trading, the change in option positions still showed that the scale of new long positions far exceeded that of new short positions. There were more new long positions, but the volatility difference remained flat, indicating that many of these new positions were constituted by sellers.
Selling covered calls to generate cash inflow for the held shares during a price decline is a basic operation. However, I advise everyone to consider volatility carefully if they plan to do this. If volatility is at relatively low levels, it's better to forgo such cash income.
After all, it's an unchanging principle that a deeply fallen stock price will inevitably rebound. Our close observation and analysis have not yet revealed an optimal entry point, but this doesn't mean the stock price won't suddenly experience a deep-fall rebound. Once such a trend occurs, leading to the forced sale of long-held shares due to covered calls, the loss outweighs the gain.
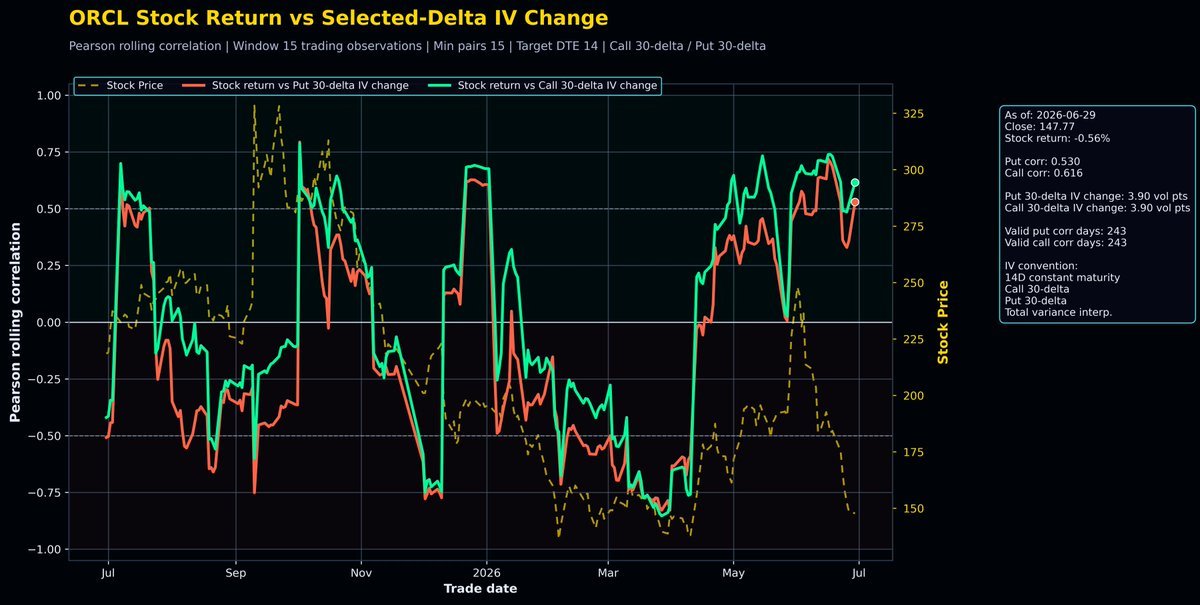
The chart above shows the correlation coefficient analysis between $Oracle(ORCL.US)'s stock price return and volatility. Oracle's stock price has already fallen so much, having just experienced its worst weekly performance, yet the volatility correlation coefficient remains strongly positive.
This means that as the stock price falls, interest in buying options decreases accordingly, but when the stock rises, option buying surges back, and the green line is even higher than the red line.
As soon as the stock price shows any reversal, the chasing buying of call options surpasses that of put options. This is not a good sign for a falling stock price, indicating that bulls could return at any time. Once the stock price rebounds slightly, bullish pressure will immediately increase.
This correlation coefficient chart is very disappointing to me. It means Oracle's buying point will have to wait; it won't appear in the short term.
Summary: The stock price broke below the key support level ($156), failed to keep up when the broader market saw a significant rebound, and there's still some distance to the lower support at $136. The volatility difference is mainly in the middle range, and the correlation coefficient is strongly positive. These signals are all quite far from a buy signal. I strongly recommend continuing to wait and see.
The copyright of this article belongs to the original author/organization.
The views expressed herein are solely those of the author and do not reflect the stance of the platform. The content is intended for investment reference purposes only and shall not be considered as investment advice. Please contact us if you have any questions or suggestions regarding the content services provided by the platform.
