

 Likes Received
 Posts
PostsIs 12.15 a critical support level for $NOK? (06/30)

Friends who have been following the stock price of $Nokia Oyj(NOK.US) likely experienced a roller coaster ride on (06/29). The stock price plunged deeply at one point, touching a key support level, but ultimately recovered all intraday losses, leaving a long lower shadow. It closed up 0.15%.
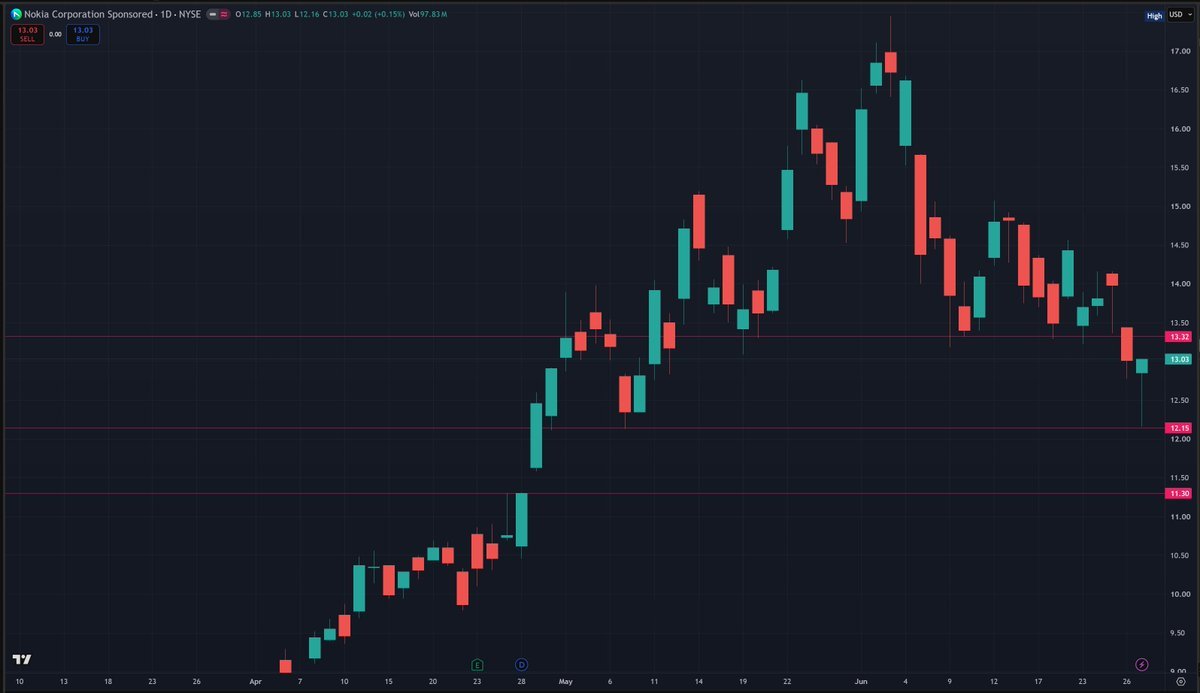
Our next analysis focuses on whether the consolidation of $Nokia Oyj(NOK.US)'s stock price is sufficient? Has it already washed out the long positions?
To answer whether the stock price consolidation is adequate, we need to analyze option data. Below is the two-year volatility:
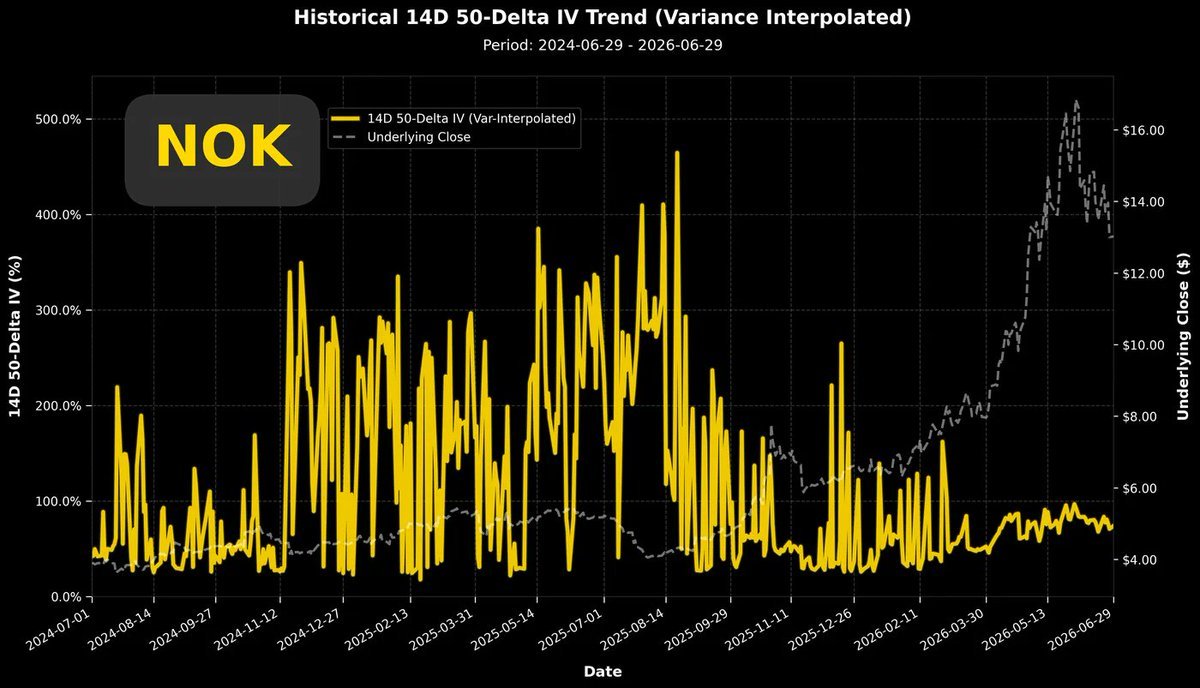
From the two-year volatility trend, it can be confirmed that volatility has shifted from an upward trend to sideways consolidation. Whether a top is forming and a downward reversal is occurring cannot yet be determined.
However, the next earnings date is expected to be 07/23. Under the influence of the earnings effect, I don't believe volatility will reverse downward in the near term. Therefore, if you are also watching volatility, I think this moment should be the low point for volatility in the coming weeks.
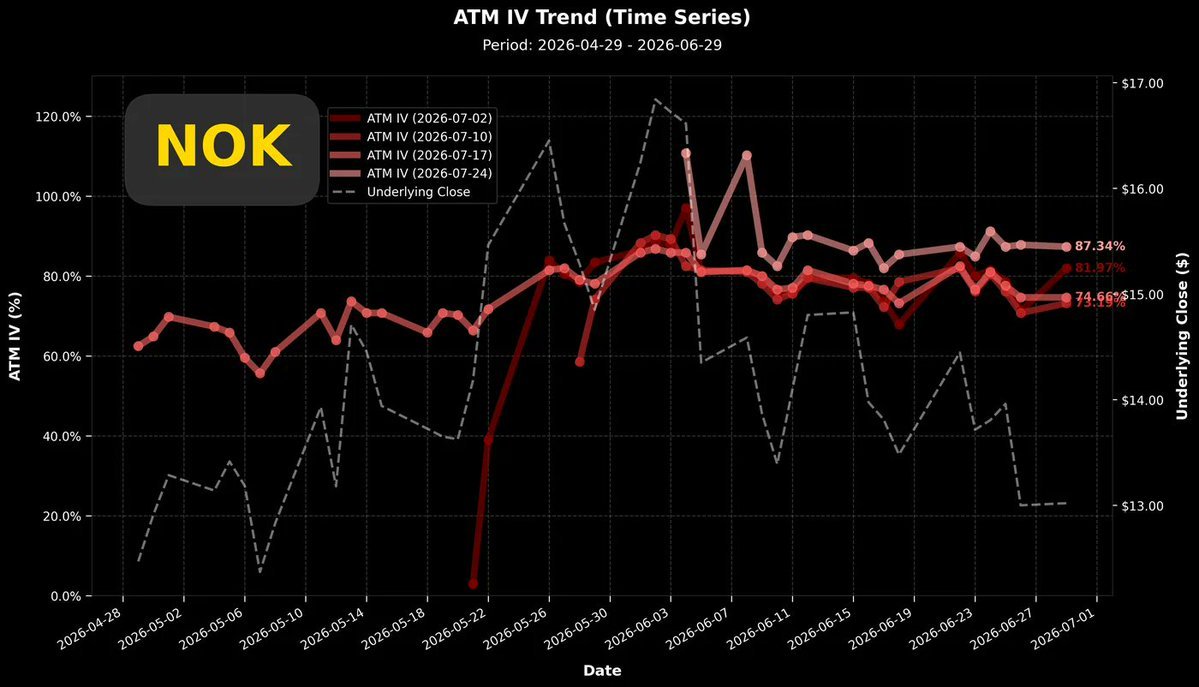
The above chart shows recent volatility trends. This chart clearly shows the current volatility has moved sideways, with little oscillation. Interestingly, the option volatility for the earnings week (07/24) has not yet shown an upward trend. I judge that the current level (87.34%) is the low point for earnings week option volatility.
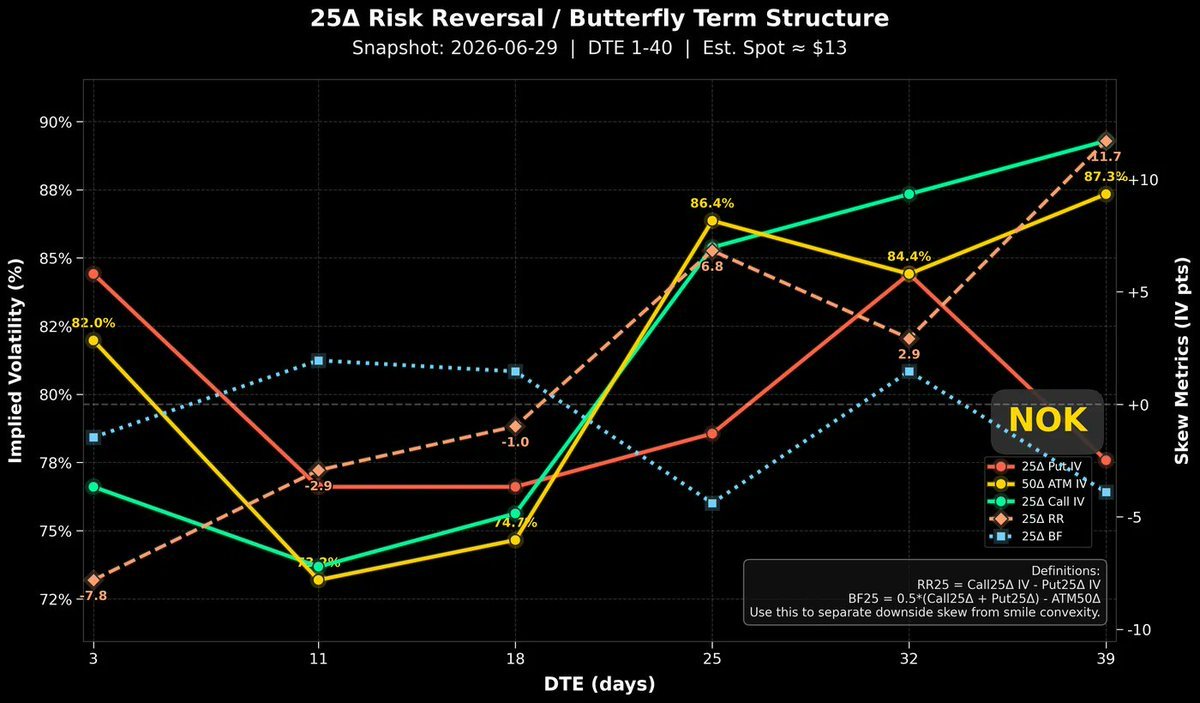
The above chart shows the volatility trend for all options within the next 39 days. The pink dotted line (25RR) in the chart is the arithmetic difference between call and put volatilities. You can see this pink dotted line rising from the bottom left to the top right.
For options expiring within 18 days, put volatility is higher. However, for options three weeks and above (including the earnings week), call volatility is higher, and the difference between the two continues to widen. A bullish sentiment still exists, but it has retreated to longer-dated options.
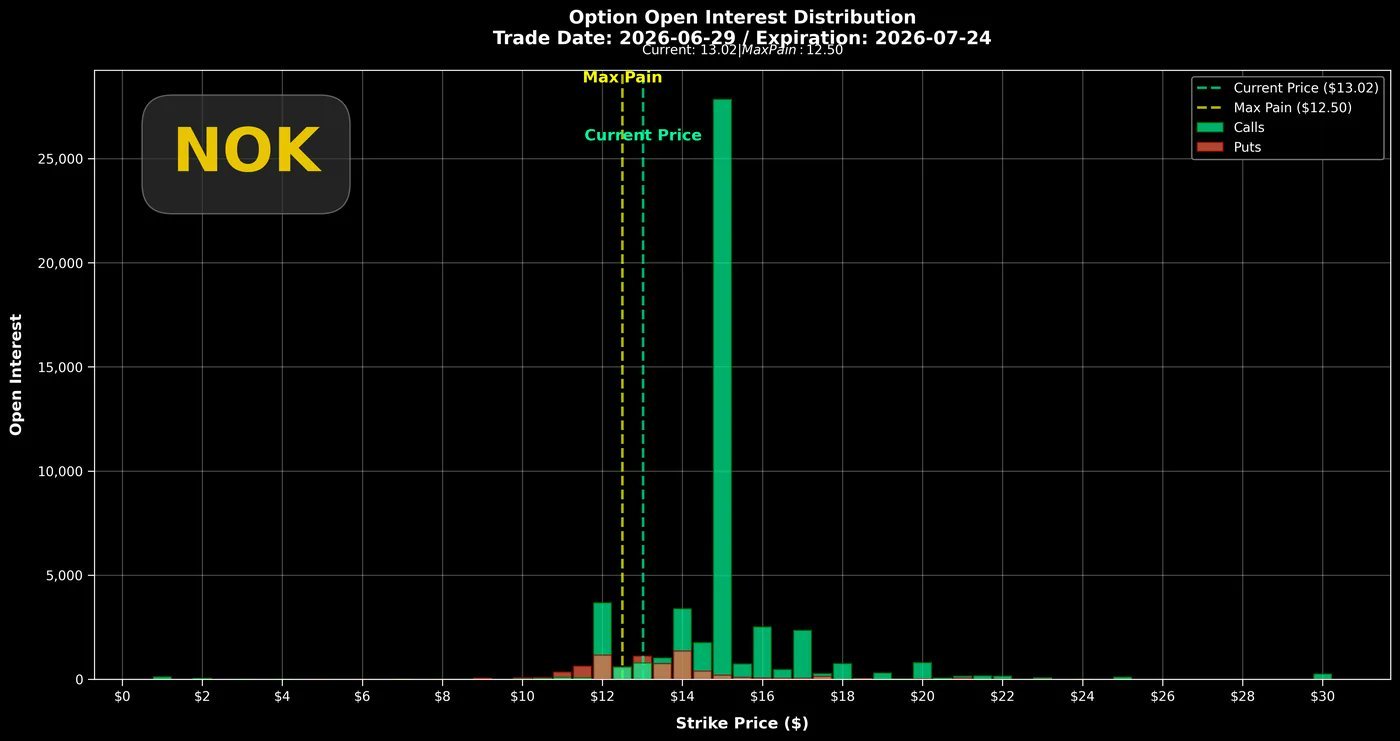
The above chart shows the position distribution for options expiring in the earnings week. This chart shows almost no put option positions. The vertical scale is entirely determined by call options, with the cumulative volume of $15 strike call options reaching as high as 27,000 contracts. In the short term, this will be a peak that the stock price will find difficult to surpass.
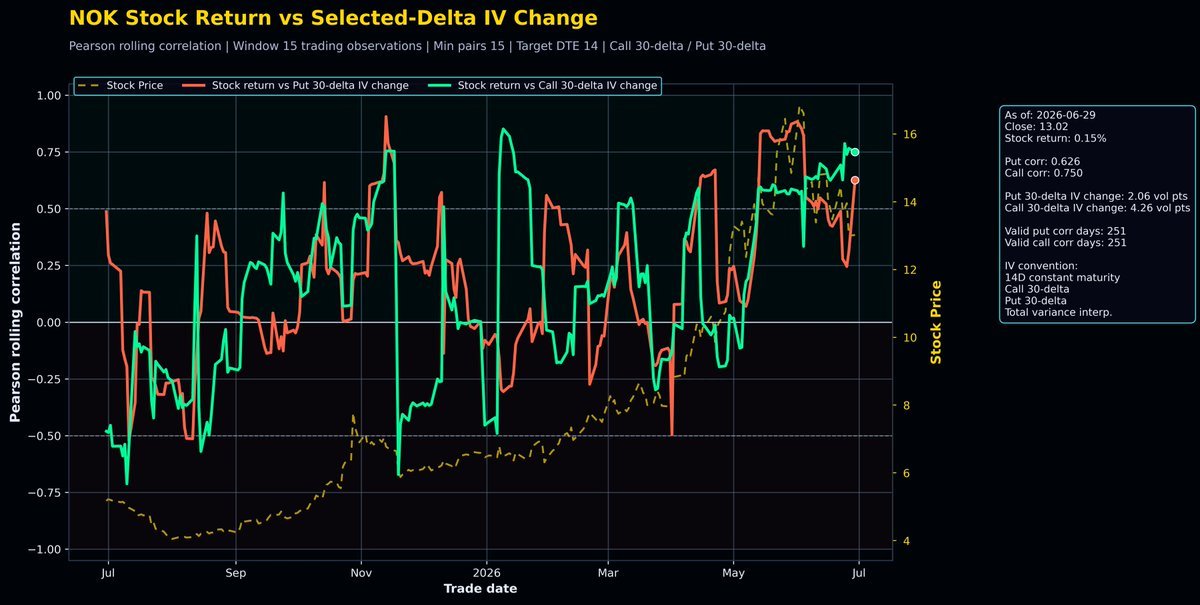
In the above chart, the correlation coefficient between stock returns and volatility is still positive. Moreover, just during yesterday's stock price oscillation, even the correlation coefficient for put options was pulled up.
This chart is the main reason I haven't established a long position in $Nokia Oyj(NOK.US) yet.
Even a brief touch of -0.5, similar to April this year. If that could happen recently, combined with the 07/23 earnings date, it would form an ideal entry point for a long position.
Summary: The stock price touched a key level and immediately rebounded, leaving a long lower shadow. This is a very positive reaction.
The next earnings report is on 07/23, so this moment should be the low point for volatility. Unfortunately, there is a massive accumulation of $15 strike call options, and the correlation coefficient remains strongly positive. The timing for going long is brewing, but not yet here.
The copyright of this article belongs to the original author/organization.
The views expressed herein are solely those of the author and do not reflect the stance of the platform. The content is intended for investment reference purposes only and shall not be considered as investment advice. Please contact us if you have any questions or suggestions regarding the content services provided by the platform.
