

 Likes Received
 Posts
Posts$NVDA head and shoulders pattern, how should it be viewed from an options trading perspective

After Nvidia's stock price broke below the neckline, it experienced a small rebound for two days, but now it has fallen again and is standing on the neckline I drew. Whether the stock price will close above or below the neckline next Monday and Tuesday will likely provide a clear answer.
Recent news about Nvidia:
1. Hon Hai (Foxconn) sales exceeded expectations (multiple posts discussed on 7/5): As a major assembly partner for NVIDIA servers, Hon Hai's latest quarterly/monthly sales exceeding expectations is seen as a tangible indicator of continued strong AI demand.
2. NVIDIA completed the largest-ever $25 billion corporate bond issuance (oversubscribed by about 3.4 times), refinancing in a low-interest-rate environment to optimize its balance sheet.
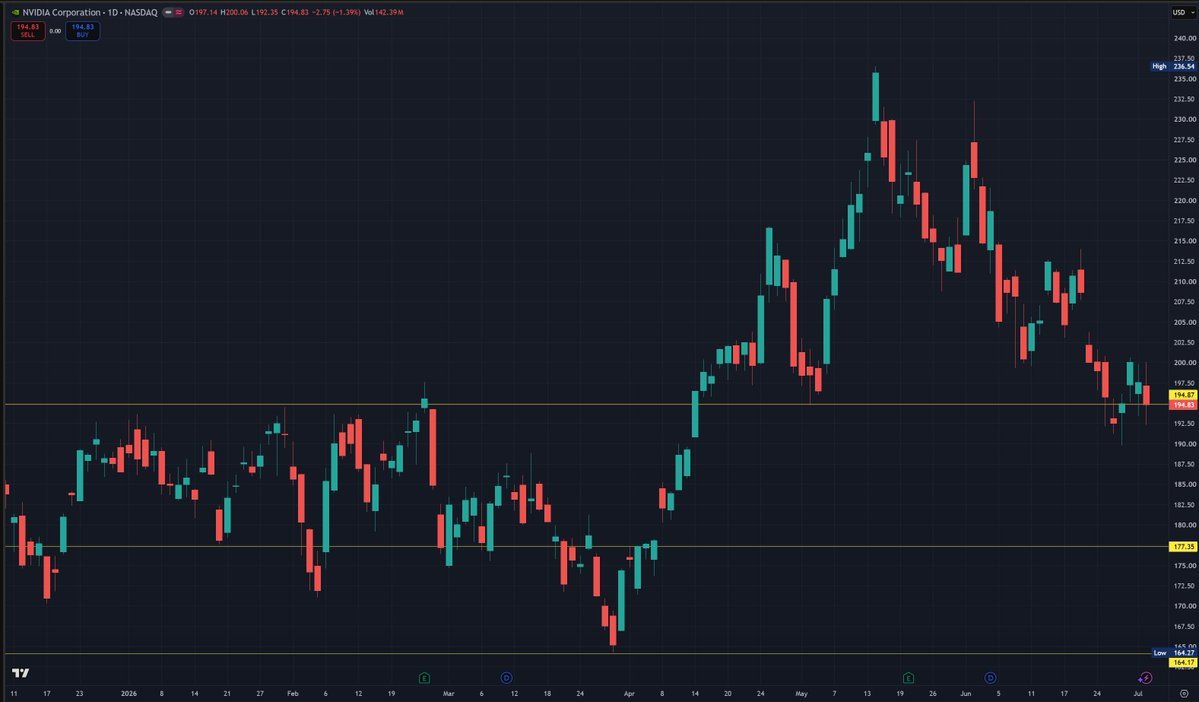
The last time I wrote an analysis on Nvidia was on 06/27, right after it had just broken below the neckline (194.8). Looking at Nvidia again a few days later, the stock had a small rebound but has now fallen back to the neckline. This pattern is quite unfavorable, clearly resembling a head-and-shoulders structure.
In early June, a right shoulder higher than the left shoulder appeared, making it seem like the stock price was about to continue rising. Unexpectedly, it then went from one low to another, lower still. Calling it a "falling wedge" is a bit of a stretch, as a standard "falling wedge" shouldn't have a left shoulder.
Currently, the stock price is right on the neckline. In tomorrow and the day after's trading, if the price falls below the neckline again, it will further confirm entry into the 177~194 consolidation range.
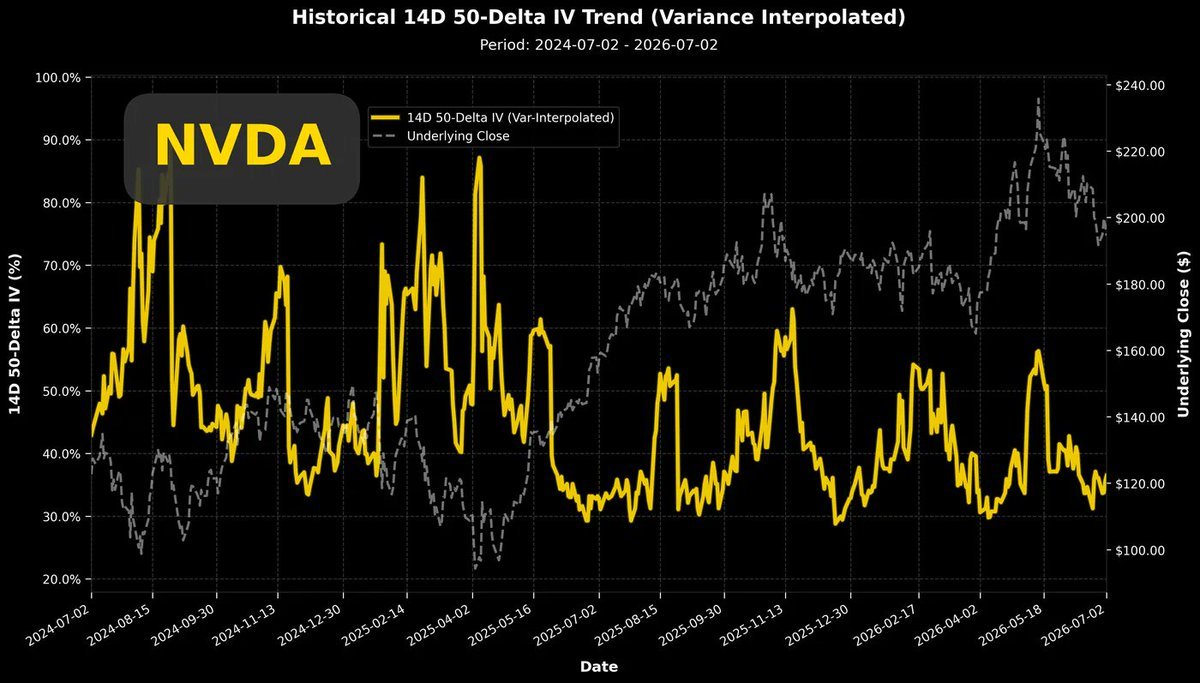
When Nvidia's stock price recently fell, volatility once touched the year's low (~30%). If we only look at this data point, we can conclude that the best buying point for bulls hasn't arrived yet. If the stock price can continue to consolidate weakly, declining slowly, and eventually cause panic among market participants, volatility should rise again to recent highs (like in mid-February this year).
Volatility first hits the bottom, trading becomes quiet, and continued stock price decline triggers volatility to rise again during the final leg down, which would also be a buying point for bulls to build positions.
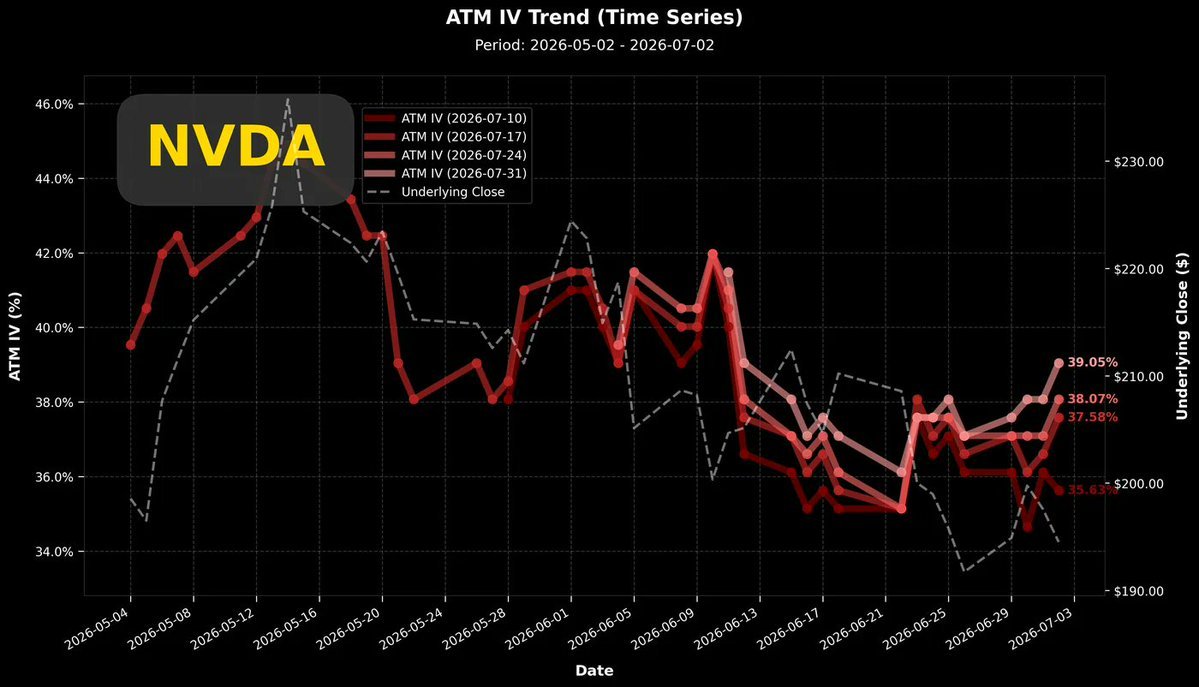
The chart above shows recent volatility trends. With the small rebound over the last two trading days, volatility also saw a slight uptick. Now, with the stock down slightly and standing on the neckline again, unless the stock price rebounds strongly, I estimate volatility will continue to decline in the coming days.
Extremely low volatility, combined with the earnings season schedule, using the earnings effect which will inevitably push volatility higher, can also create a good timing for bulls to build positions.
The chart above shows the two-year implied volatility spread. This chart shows the spread is still in an oscillating upward trend.
However, the upward slope shows signs of becoming increasingly flat. We hope the volatility spread can reach +20pts, which would be a buy signal for a local stock price bottom.
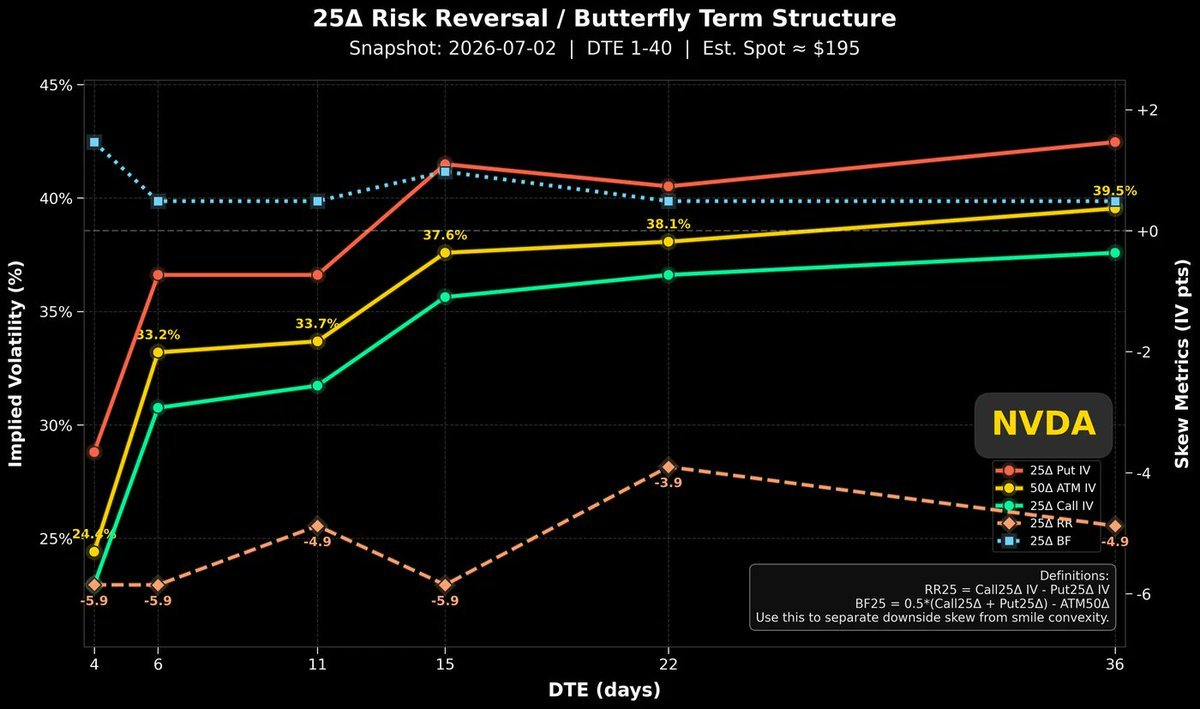
The chart above shows the volatility for all options within the next 36 days. The volatility of every put option is greater than that of call options.
Even with constant good news from the AI industry, market participants looking ahead over the next month or so are still mainly chasing put options to hedge against stock price declines.
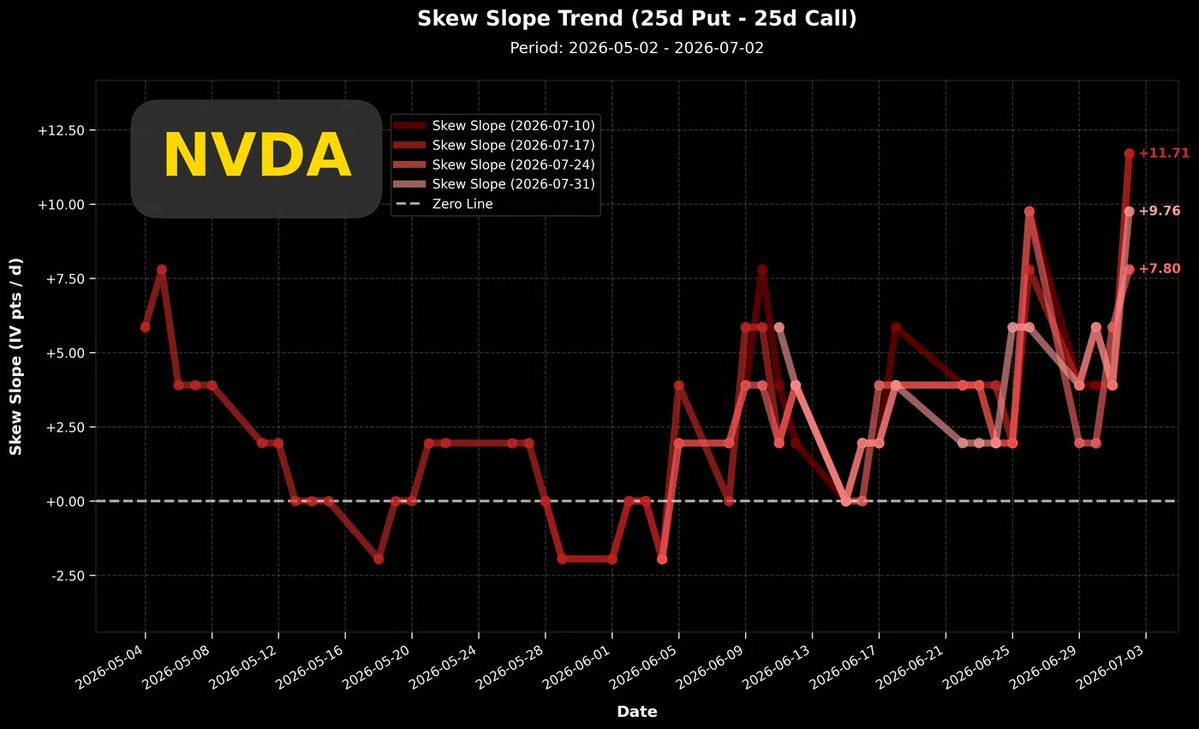
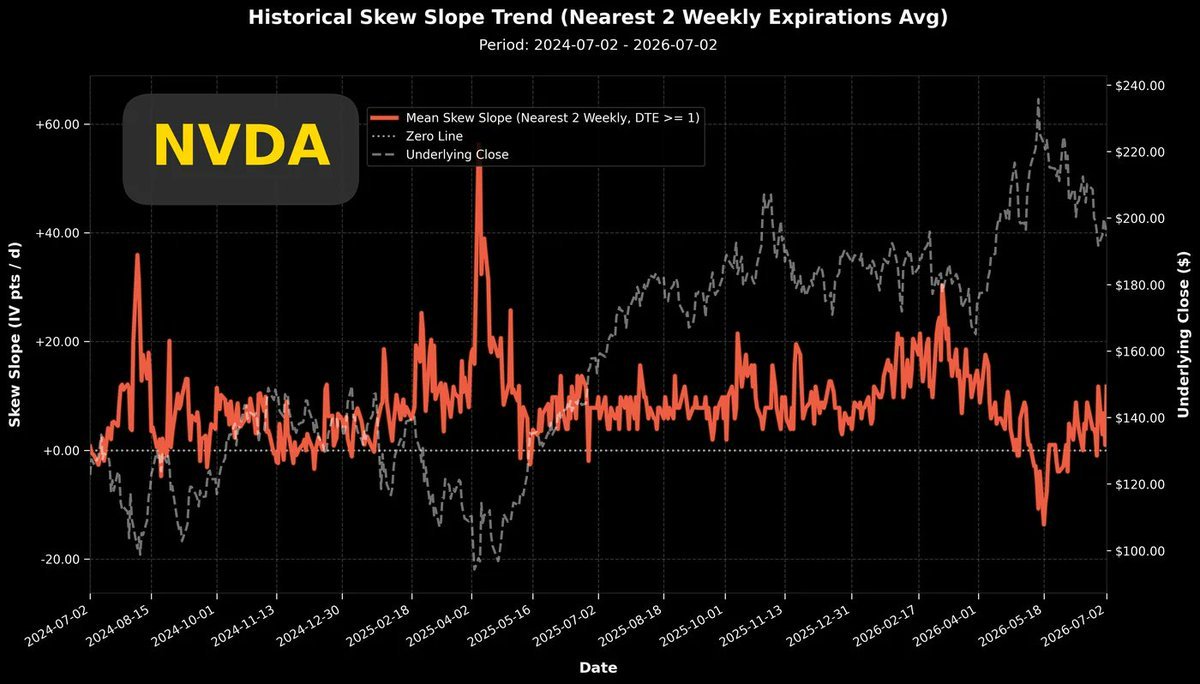
The chart above shows the recent volatility spread. This chart clearly shows everyone's chase for put options. The skew slope is becoming increasingly positive. Strictly speaking, since early June, Nvidia's options trading has shown a gradually warming trend in put option buying.
This upward trend has continued until the last few trading days, with expanded oscillations but still maintaining the basic upward pattern. For bulls wanting to build positions, this is a good sign, but they must still continue to wait.
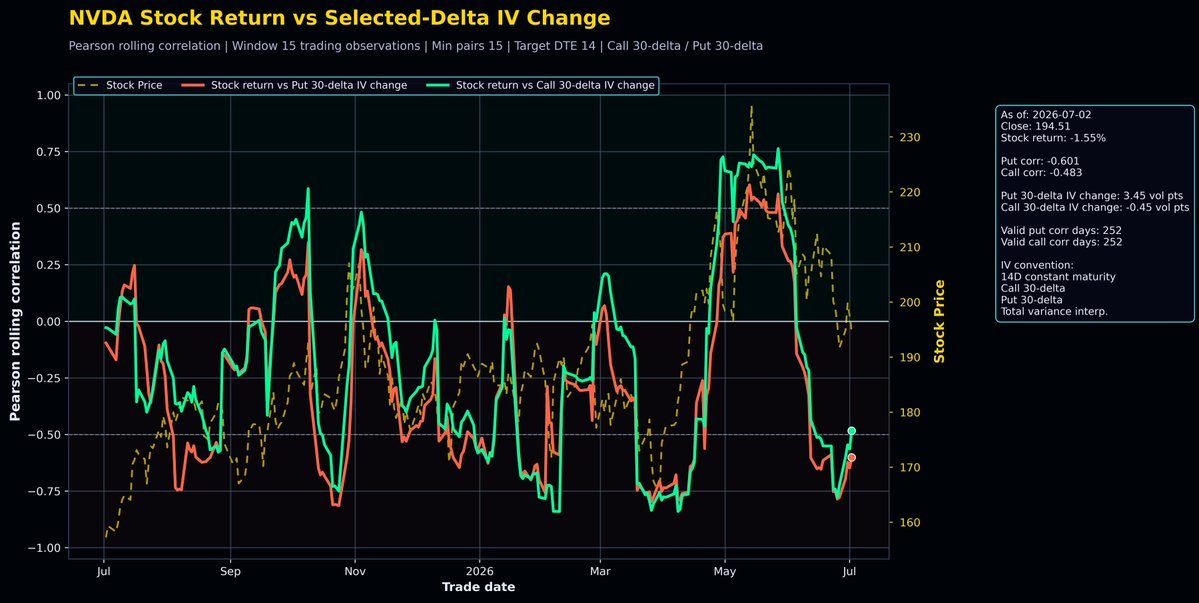
The chart above shows the correlation coefficient between stock returns and volatility. The correlation coefficient likely indicates the stock price bottom is nearby. It would be more ideal if it could maintain a state of -0.75 for a period like in April this year,
but the stock price rebound over the last two trading days seems to have pushed the correlation coefficient higher. If the stock price continues to consolidate over the next week, it might create an opportunity for the correlation coefficient to stay at -0.75. The correlation coefficient is already showing a positive signal; it would be more ideal if it could repeatedly touch the strong negative correlation of -0.75.
Summary: Looking at a full year of stock price data, the current stock price is not a relative low point. The volatility spread is not positive enough, while the correlation coefficient is performing quite positively, having already touched -0.75. Before this Wednesday, the stock price will give a clear answer on whether it will hold the neckline.
The copyright of this article belongs to the original author/organization.
The views expressed herein are solely those of the author and do not reflect the stance of the platform. The content is intended for investment reference purposes only and shall not be considered as investment advice. Please contact us if you have any questions or suggestions regarding the content services provided by the platform.
