

 Likes Received
 Posts
PostsHas NOK fallen enough?

@三思又三思 This time I should be able to answer you. $Nokia Oyj(NOK.US) has been declining at a steady pace recently, and the range of price fluctuations has been continuously narrowing, just like the persistently declining volatility.
During Nokia's stock price rise, option volatility rose simultaneously. After the stock price formed a top, volatility began a slow decline. Now that volatility is rising again, does it signal that the stock price decline has reached a saturation point?
Relevant information about Nokia:
1. Latest WSJ report: Nokia is transforming to supply AI data center optical network infrastructure, with its North American optical network market share significantly increasing from 6.3% in 2024 to 27.3% in 2025.
2. Nokia has been selected as the sole supplier for the comprehensive modernization of Orange Belgium's transport network, integrating fixed and mobile networks into a single system (supporting 1G–400G+).
3. Next earnings date: 7/23 (Thursday, pre-market release of Q2 and first-half earnings)
The stock price has fallen 19% over the past 15 trading days. Moreover, it has maintained a stable declining rate with narrow fluctuations. This declining wave has remained very linear so far, lasting over three weeks without changing its pattern. Projecting with this linear speed, it will fall below $11.3 this Friday.
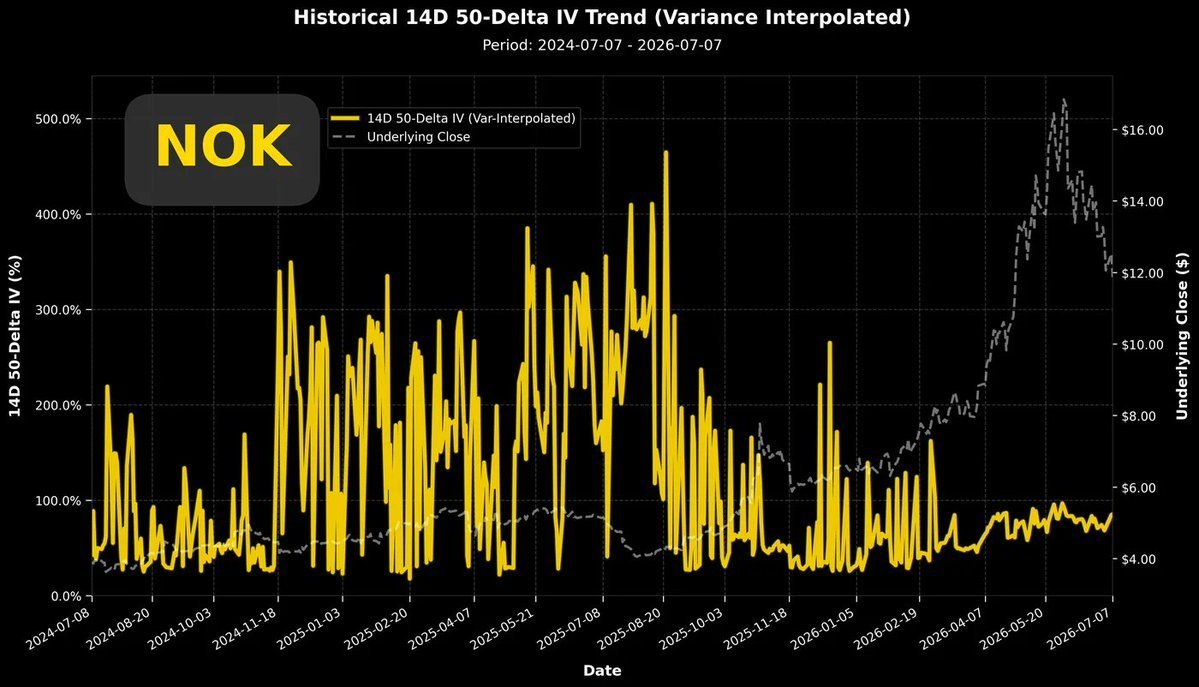
The above chart shows the implied volatility trend over the past two years. Finally, in this chart, we see a long-awaited rise in volatility.
In earlier analysis, I pointed out that if volatility continues to decline, for a company with Nokia's stock characteristics, it is a precursor to a continued stock price decline. Conversely, you can also see that during the stock price rise, volatility continued to rise.
Later, we indeed saw volatility continue to decline, and the stock price also languished. Now, we have finally seen a relatively significant rise in volatility (IV).
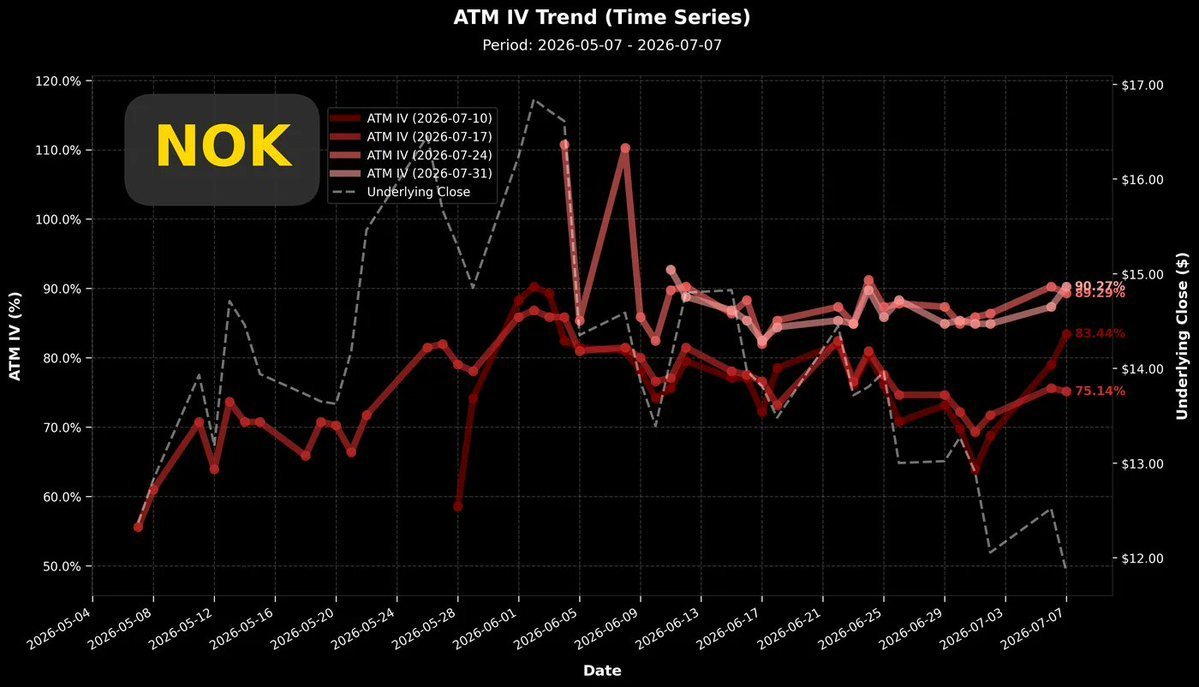
The above chart shows the recent volatility trend. We can more clearly observe that, whether for near-term or weeks later, the volatility of all options is showing an upward trend, with the rise in near-term option volatility being quite substantial.
Has the stock price fallen to a point that market participants can no longer tolerate? We can observe the main attitude of capital from the volatility spread.
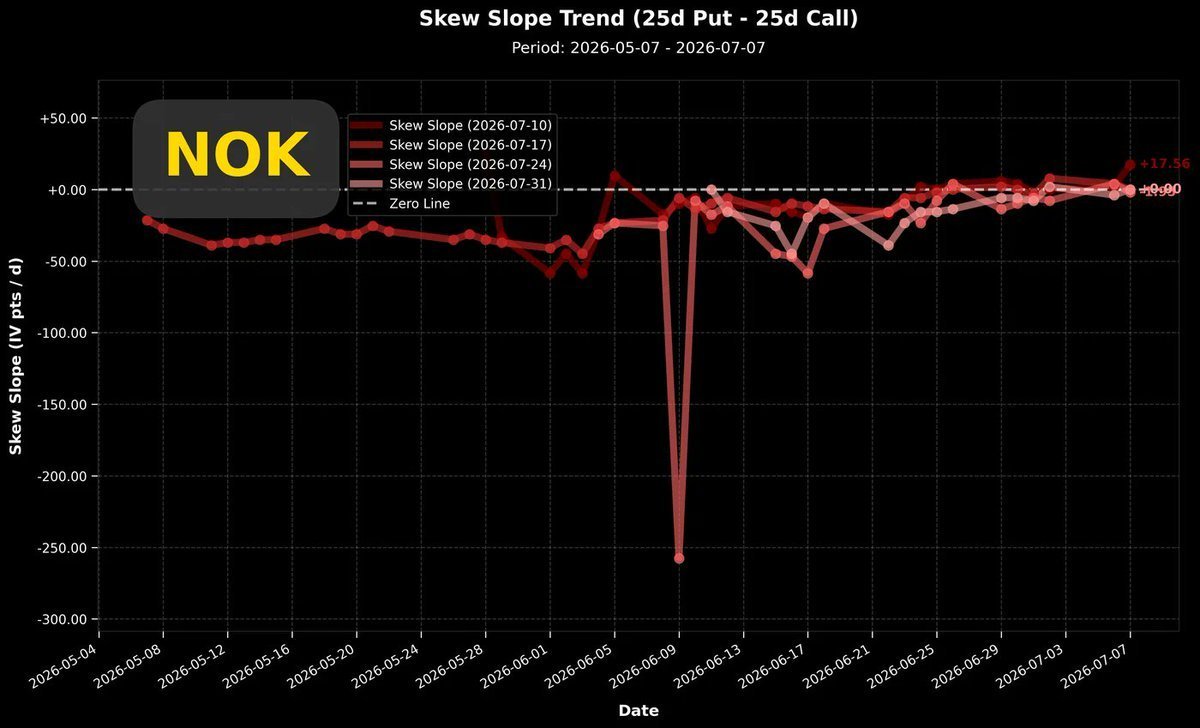
The above chart shows the recent Put-Call volatility spread trend for $Nokia Oyj(NOK.US).
In this chart, we can clearly see that the volatility spread for near-term options has risen significantly. You might think the increase is small, but upon closer look, the volatility spread has reached +17, which is a very large value.
For a typical stock, it only happens about two or three times a year that the volatility spread can reach +17. Even for more moderate stocks, the option volatility spread may not touch this level for several years.
This is a good sign. Because after a stock falls to a considerable depth, if volatility rises instead, and it is led by put options, this is a direct signal of pessimism, despair, or even panic among market participants.
After the panic comes the dawn.
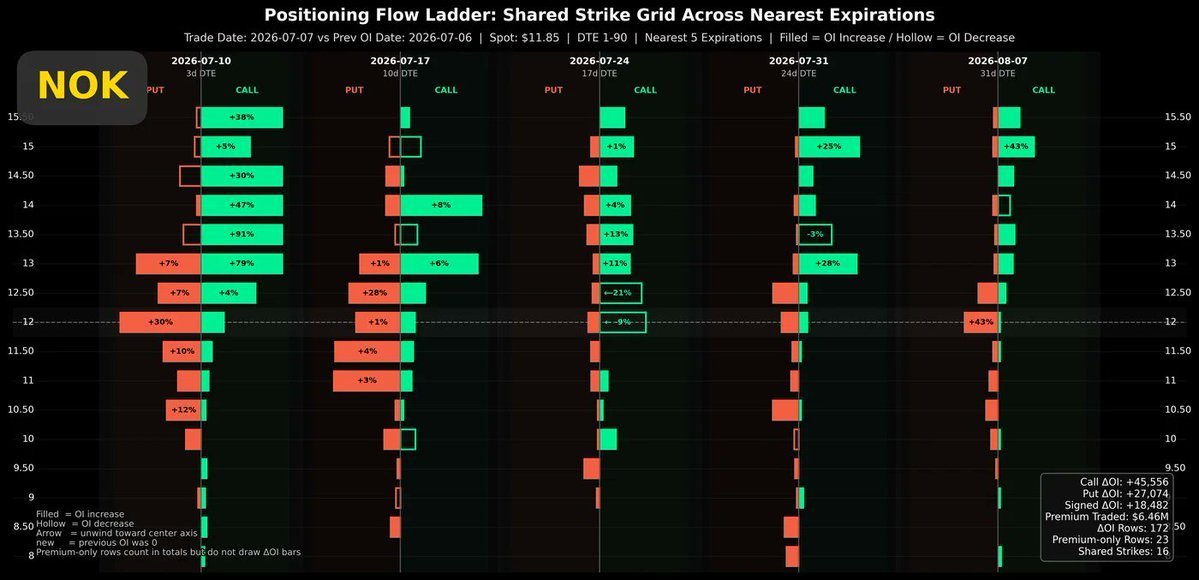
The above chart shows the option position changes for $Nokia Oyj(NOK.US) during Tuesday's (07/07) trading. Only near-term options have seen relatively active new put positions, while relatively longer-term options are still dominated by calls.
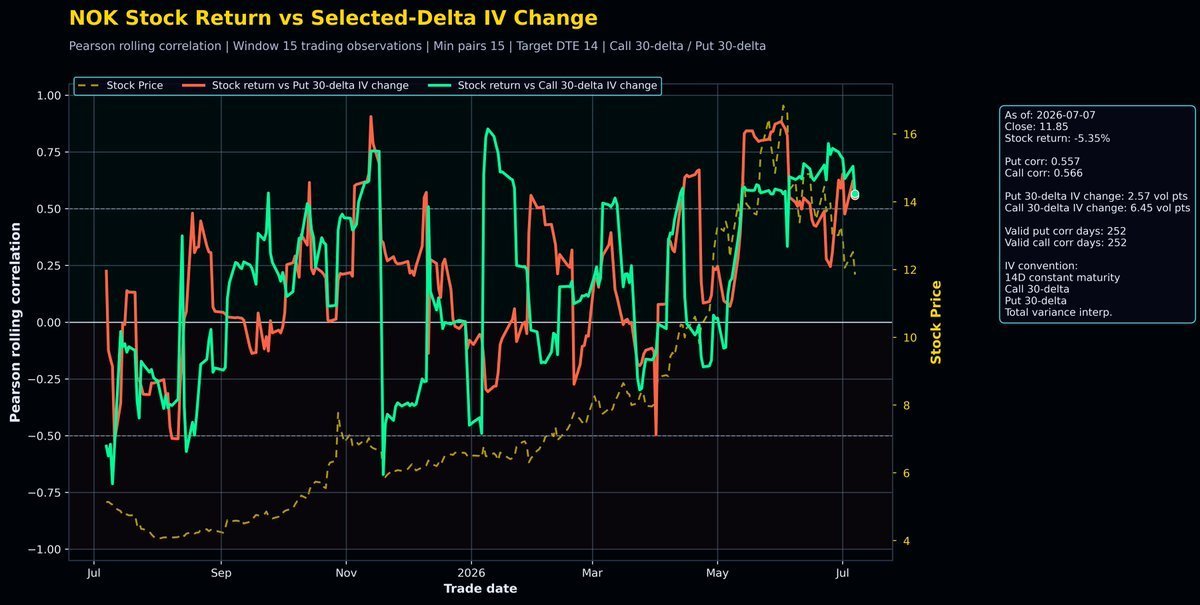
Even though we see good signs in volatility and the volatility spread, the correlation coefficient is still not ideal. Usually, when a stock price hits bottom, the correlation coefficient between stock returns and option volatility shows a strong negative correlation.
During this period from Nokia's stock price forming a top and starting its persistent decline, the correlation coefficient has never officially declined. Although historical records show that reaching -0.25 is already a strong negative correlation for $Nokia Oyj(NOK.US), the correlation coefficient has remained oscillating around +0.5 since the last top formation.
Summary: $Nokia Oyj(NOK.US) has fallen for so long, and we finally see some buy signals lighting up. Positives are intensified panic chasing puts, rising volatility, and a sharp increase in the volatility spread. Negatives are the correlation coefficient still stuck in a top-like state.
We hope the stock price breaks the downtrend, and the correlation coefficient can return to a negative position (-0.5), which would be perfect. I'm considering buying a leap call anyway, but without clear signals and major buying points appearing, we suggest it's better to observe with empty hands. Otherwise, the risk of buying rashly remains quite high. Patience, patience, and more patience.
Also, I believe I have been objectively presenting data, without bias or hype. It seems very few people see my articles and comments, which has reduced my enthusiasm for writing during this period. If you have any good suggestions, please share them. Thank you very much 🙏
The copyright of this article belongs to the original author/organization.
The views expressed herein are solely those of the author and do not reflect the stance of the platform. The content is intended for investment reference purposes only and shall not be considered as investment advice. Please contact us if you have any questions or suggestions regarding the content services provided by the platform.
