

 Likes Received
 Posts
PostsHas $Intel(INTC.US) stock price consolidation completed?

Friends who have been following my analysis for a long time should know that I really appreciate the consolidation pattern of $Intel (INTC.US) stock price at high levels. But we still wonder, can good stock price consolidation data prevent a post-surge price from undergoing a 40% or 50% level of consolidation and correction?
Currently, if measured from the peak, $Intel (INTC.US) stock price has already fallen 26%. This would be a quite deep decline for a regular stock, but for a stock like Intel with persistently high volatility, we cannot yet declare it has entered a bear market.
Recent Intel-related news:
1. On Thursday, 07/23, the Q2 earnings report will be announced after the US market closes.
2. NVDA may evaluate using Intel's 14A process for I/O chips due to TSMC's tight capacity. If realized, this would be significant validation of Intel's foundry business recovery.
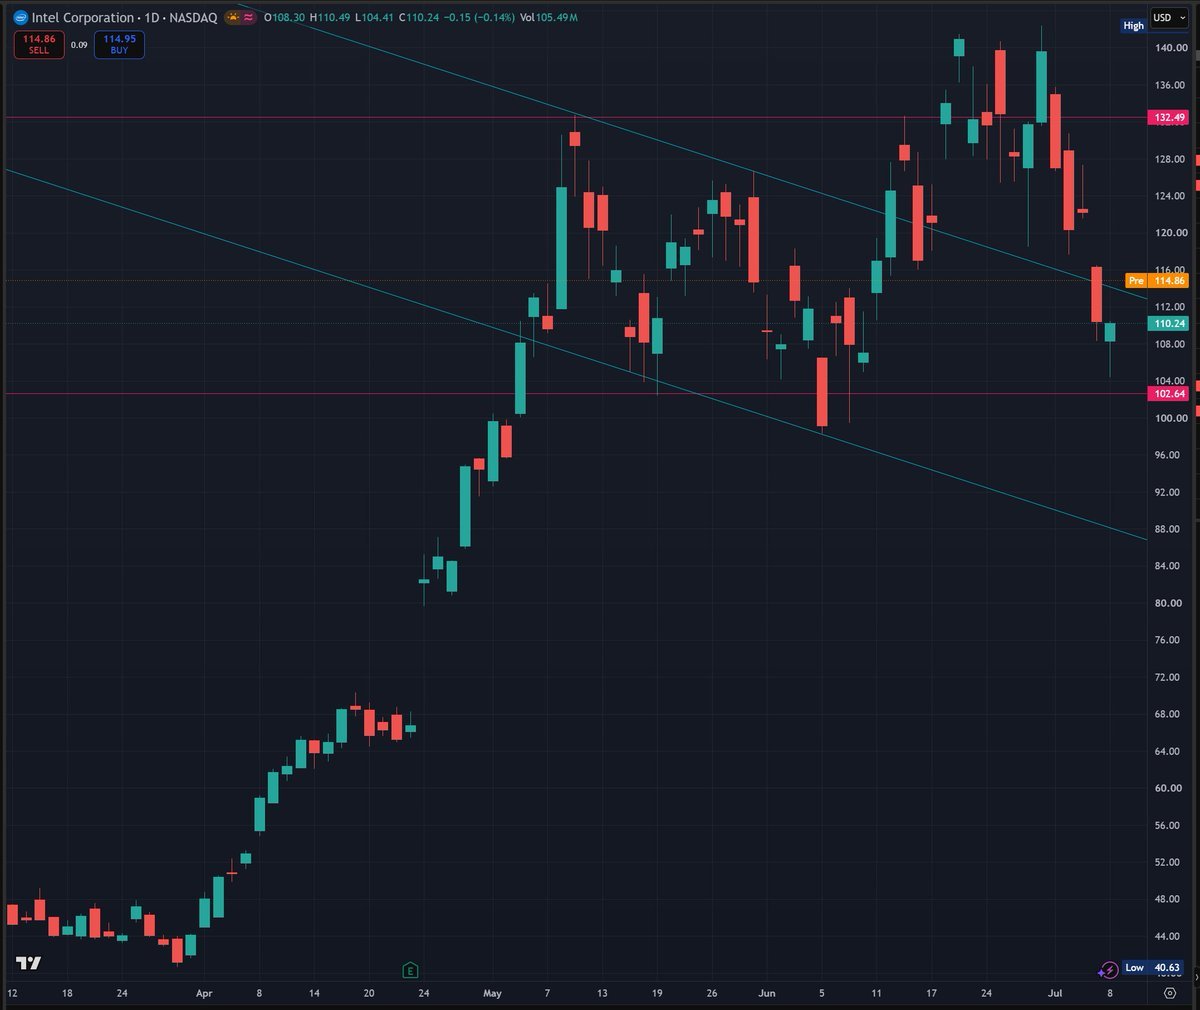
From 05/07 to 06/11, the stock price formed a bull flag pattern for a full month. After breaking the upper boundary on 06/16, the first pullback occurred. The price attacked upward again after the pullback. I thought it could launch a post-bull flag rally just like in the textbook scenario.
Unfortunately, in the last two trading sessions, the stock price fell below the original bull flag's upper boundary. There is a key support zone around 98~102. As long as the price doesn't break through this support zone, the logic of high-level sideways consolidation remains unchanged.
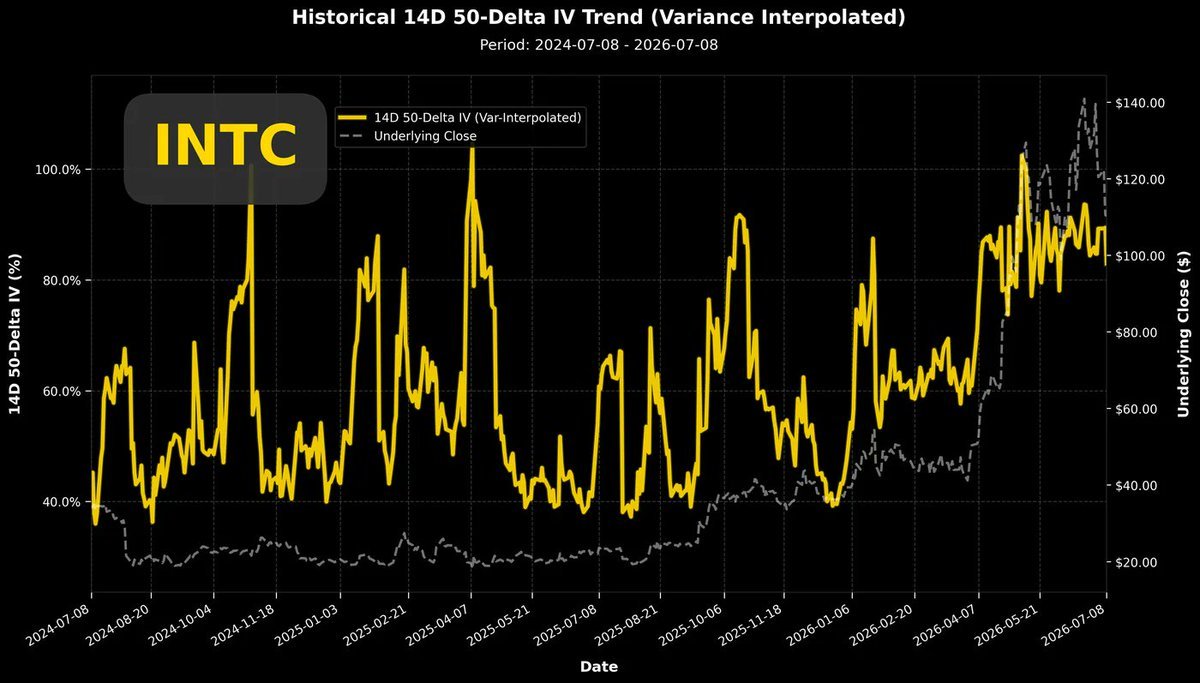
The chart above shows Intel's two-year volatility trend. Volatility decreased slightly in the most recent trading session, but its current position is still within the oscillation range, making it impossible to determine a trend.
Although the volatility benchmark value continues to oscillate horizontally, given that earnings will be released on 07/23, it's difficult for the benchmark to fall.
I boldly expect volatility for the week of 07/23 to reach a high of 120%.
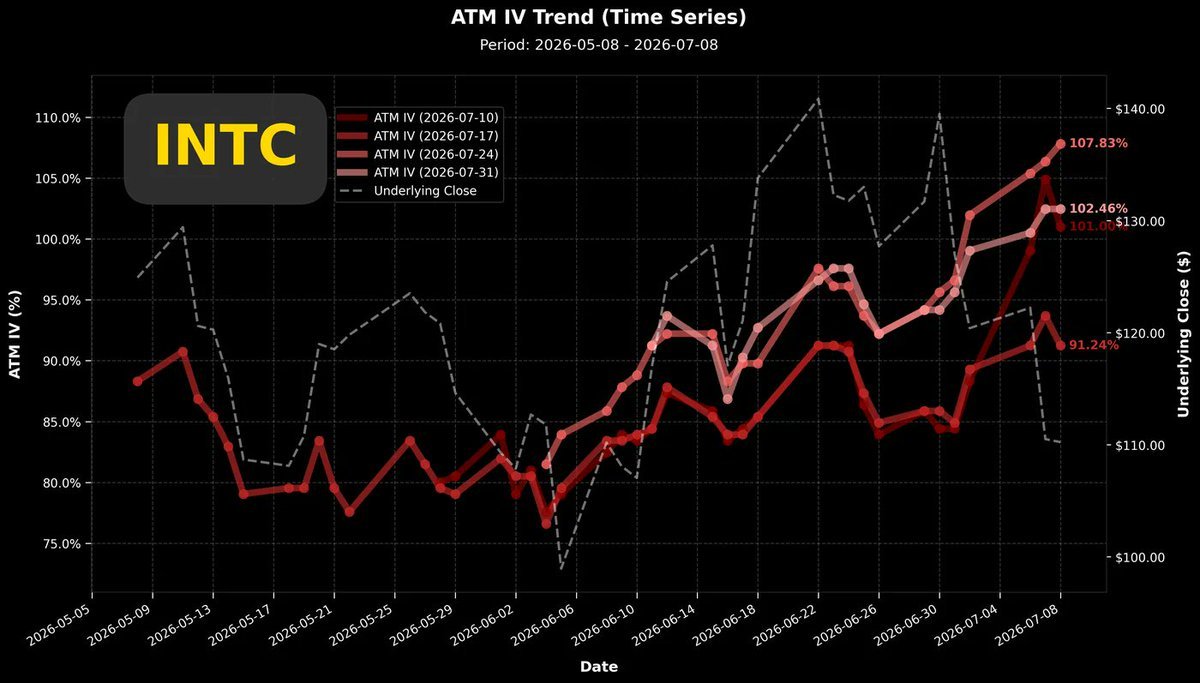
The chart above shows the recent at-the-money volatility trend. The earnings effect has already started to take hold. The option with the highest volatility in the chart is for 07/24. It can be seen that the volatility for earnings week options has already reached 107%, and there are still two weeks left until earnings week.
Coupled with the recent price drop nearing the key lower support, this kind of deeply fallen stock often sparks bullish enthusiasm before earnings, pushing volatility to historical levels.
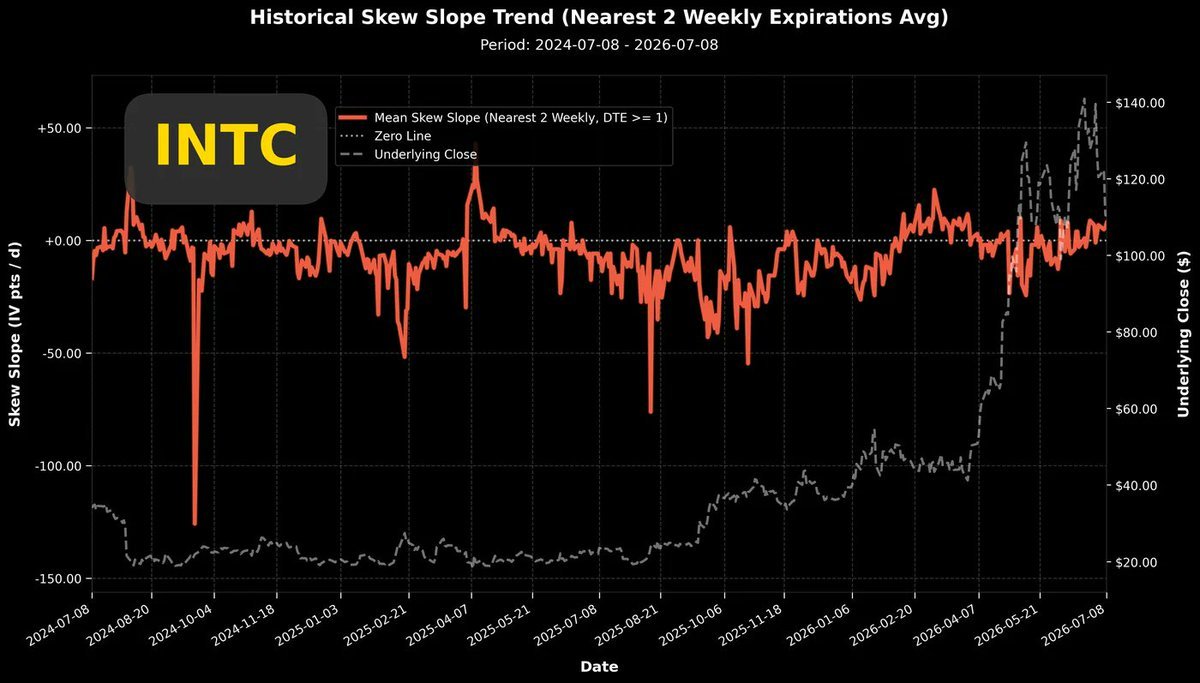
The chart above shows Intel's two-year volatility skew. The current signal pattern is quite good: the stock price has fallen deeply, and the volatility skew continues to rise. If judged solely by this chart, I would think the local bottom of the stock price has been reached.
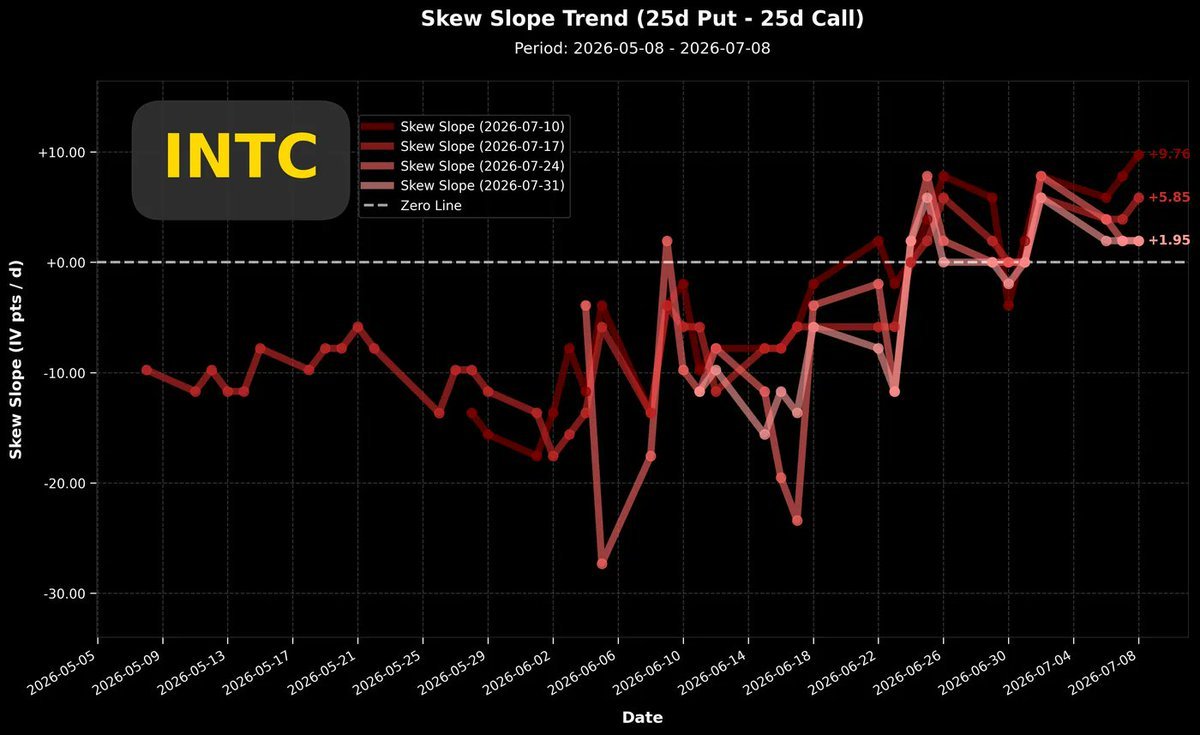
The chart above shows the recent volatility skew. This chart allows for a clearer observation of the increased buying frenzy for recent put options. Unfortunately, the market seems to have already shown signs of betting bullish (+1.95) on the earnings week price, so you can see that the volatility skew for relatively longer-term options is closer to the zero line and shows no signs of sustained increase.
What we fear most is seeing a crowded long situation like in mid-June just before earnings. If combined with earnings that merely meet market expectations, it could cause a sharp post-earnings price drop.
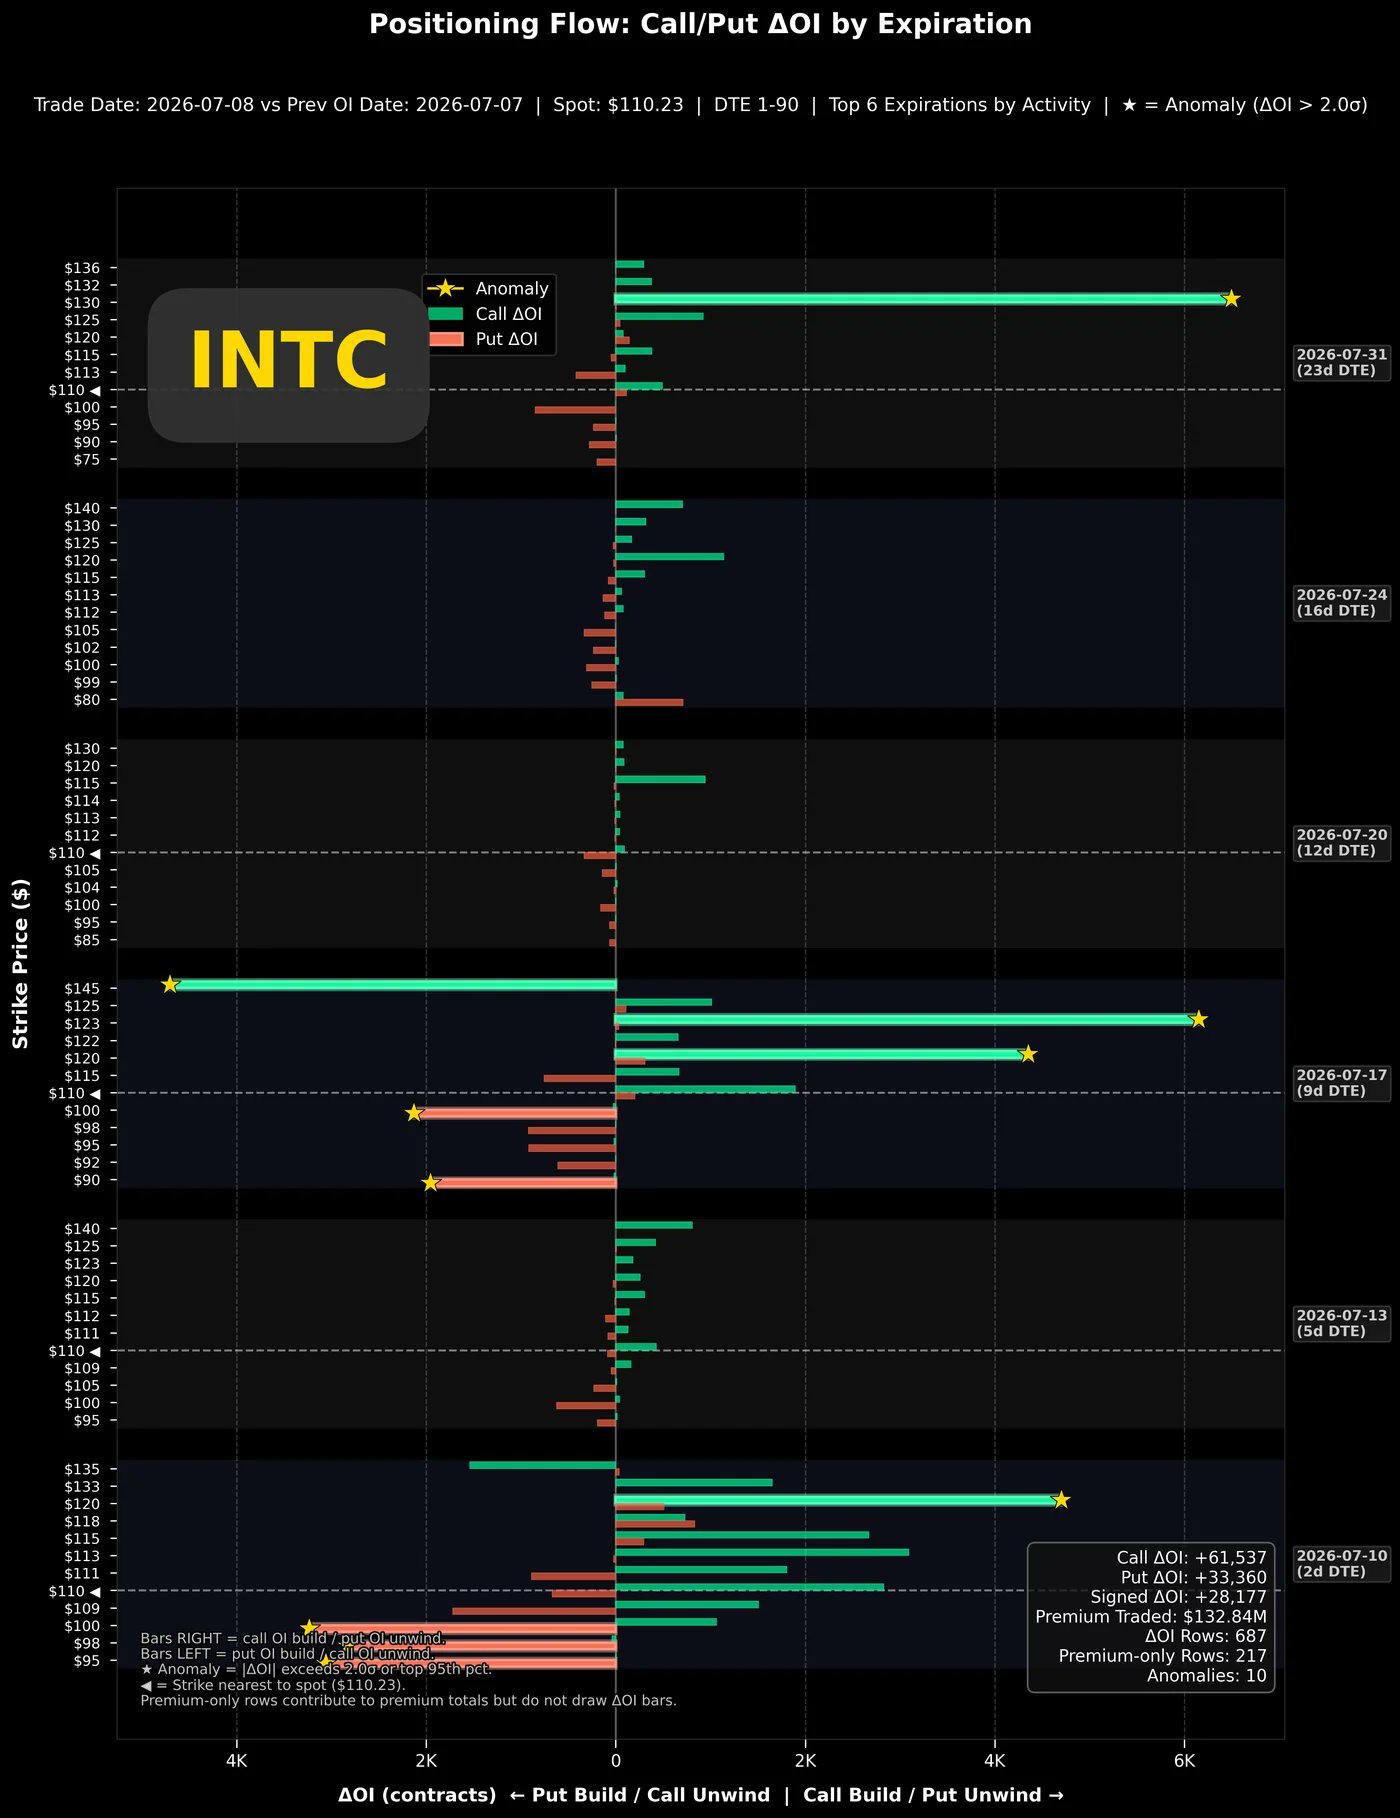
The chart above is the single-day position change chart for $Intel(INTC.US). This chart still shows a large number of new long positions in call options. The difference is that recent options still have some new put positions, but options two or three weeks out are dominated by call options.
$Intel(INTC.US) bulls remain very active and waiting for an opportunity. We will continue to monitor closely, hoping these bull armies don't mobilize just before earnings.
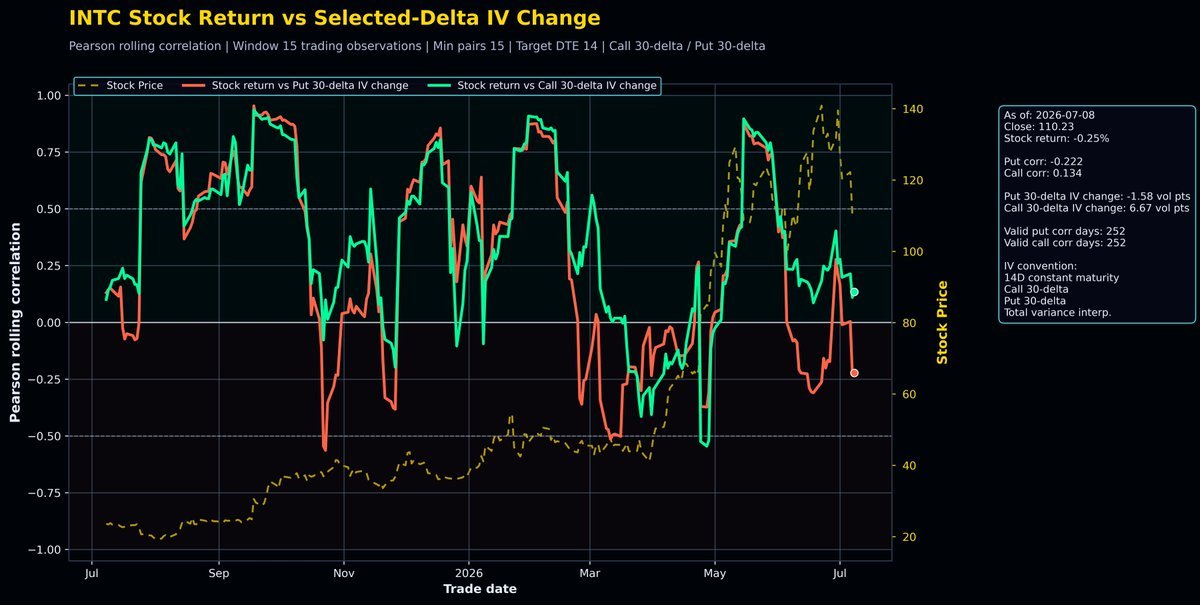
When the stock price surged to a new all-time high in the second wave, the correlation coefficient did not follow. As the price has fallen recently, the correlation coefficient, led by put options (red line), is falling rapidly, which is a good sign. I hope the correlation coefficient can reach -0.50 before the stock price falls much further.
Summary: The stock price is near key support, the volatility skew is rising, and the earnings effect may push volatility to new highs. These are positive factors for a price increase. However, the correlation coefficient hasn't bottomed yet, and the volatility skew is still not large enough, which are relatively negative factors.
If you are very optimistic about this earnings report based on fundamentals or other factors, then I would suggest you establish long positions "now." However, I suspect that as we approach the earnings date this time, a crowded scene of bulls rushing to buy call options will occur. Once this happens, the call options in your hands will be able to enjoy substantial volatility gains. But I strongly advise you to take profits before the earnings announcement, or at least partially take profits to harvest volatility and avoid the "Sell the News" effect.
The copyright of this article belongs to the original author/organization.
The views expressed herein are solely those of the author and do not reflect the stance of the platform. The content is intended for investment reference purposes only and shall not be considered as investment advice. Please contact us if you have any questions or suggestions regarding the content services provided by the platform.
