F
Fattycat
Featured

🥇 Gold vs ₿ Bitcoin: Who Wins After the Fed Decision?

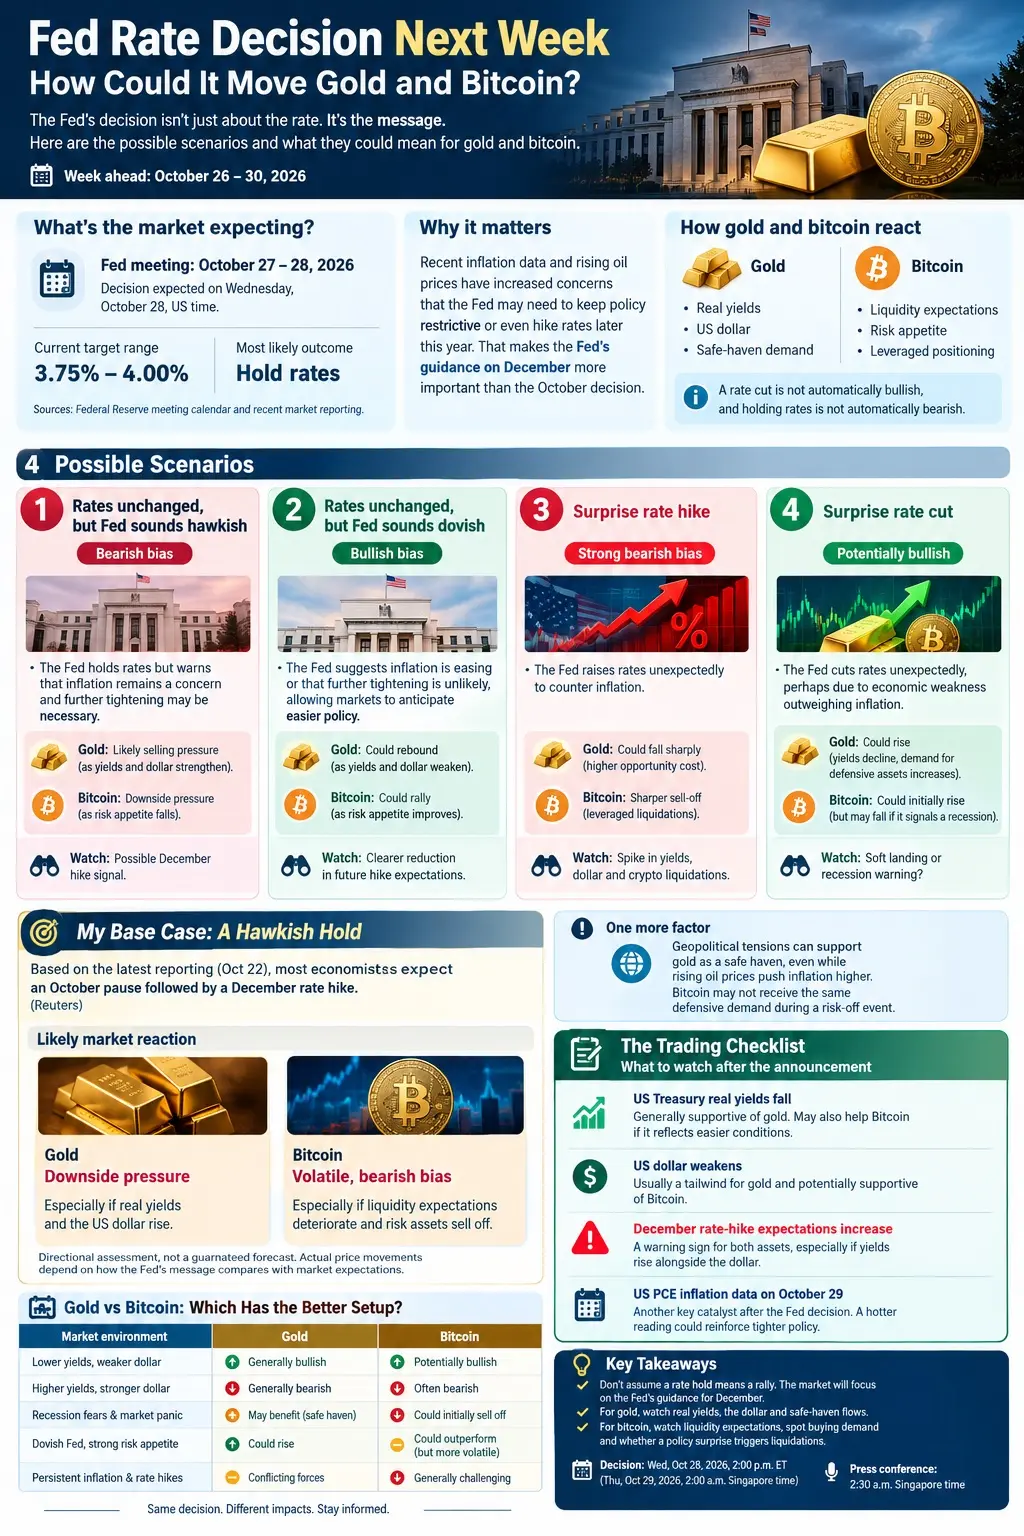
Next week Federal Reserve meeting is set to move both gold and Bitcoin. The same news can affect each asset quite differently.

Let’s us walk through four possible outcomes 👇

🟠 Scenario 1: Rates Unchanged Plus Hawkish Tone

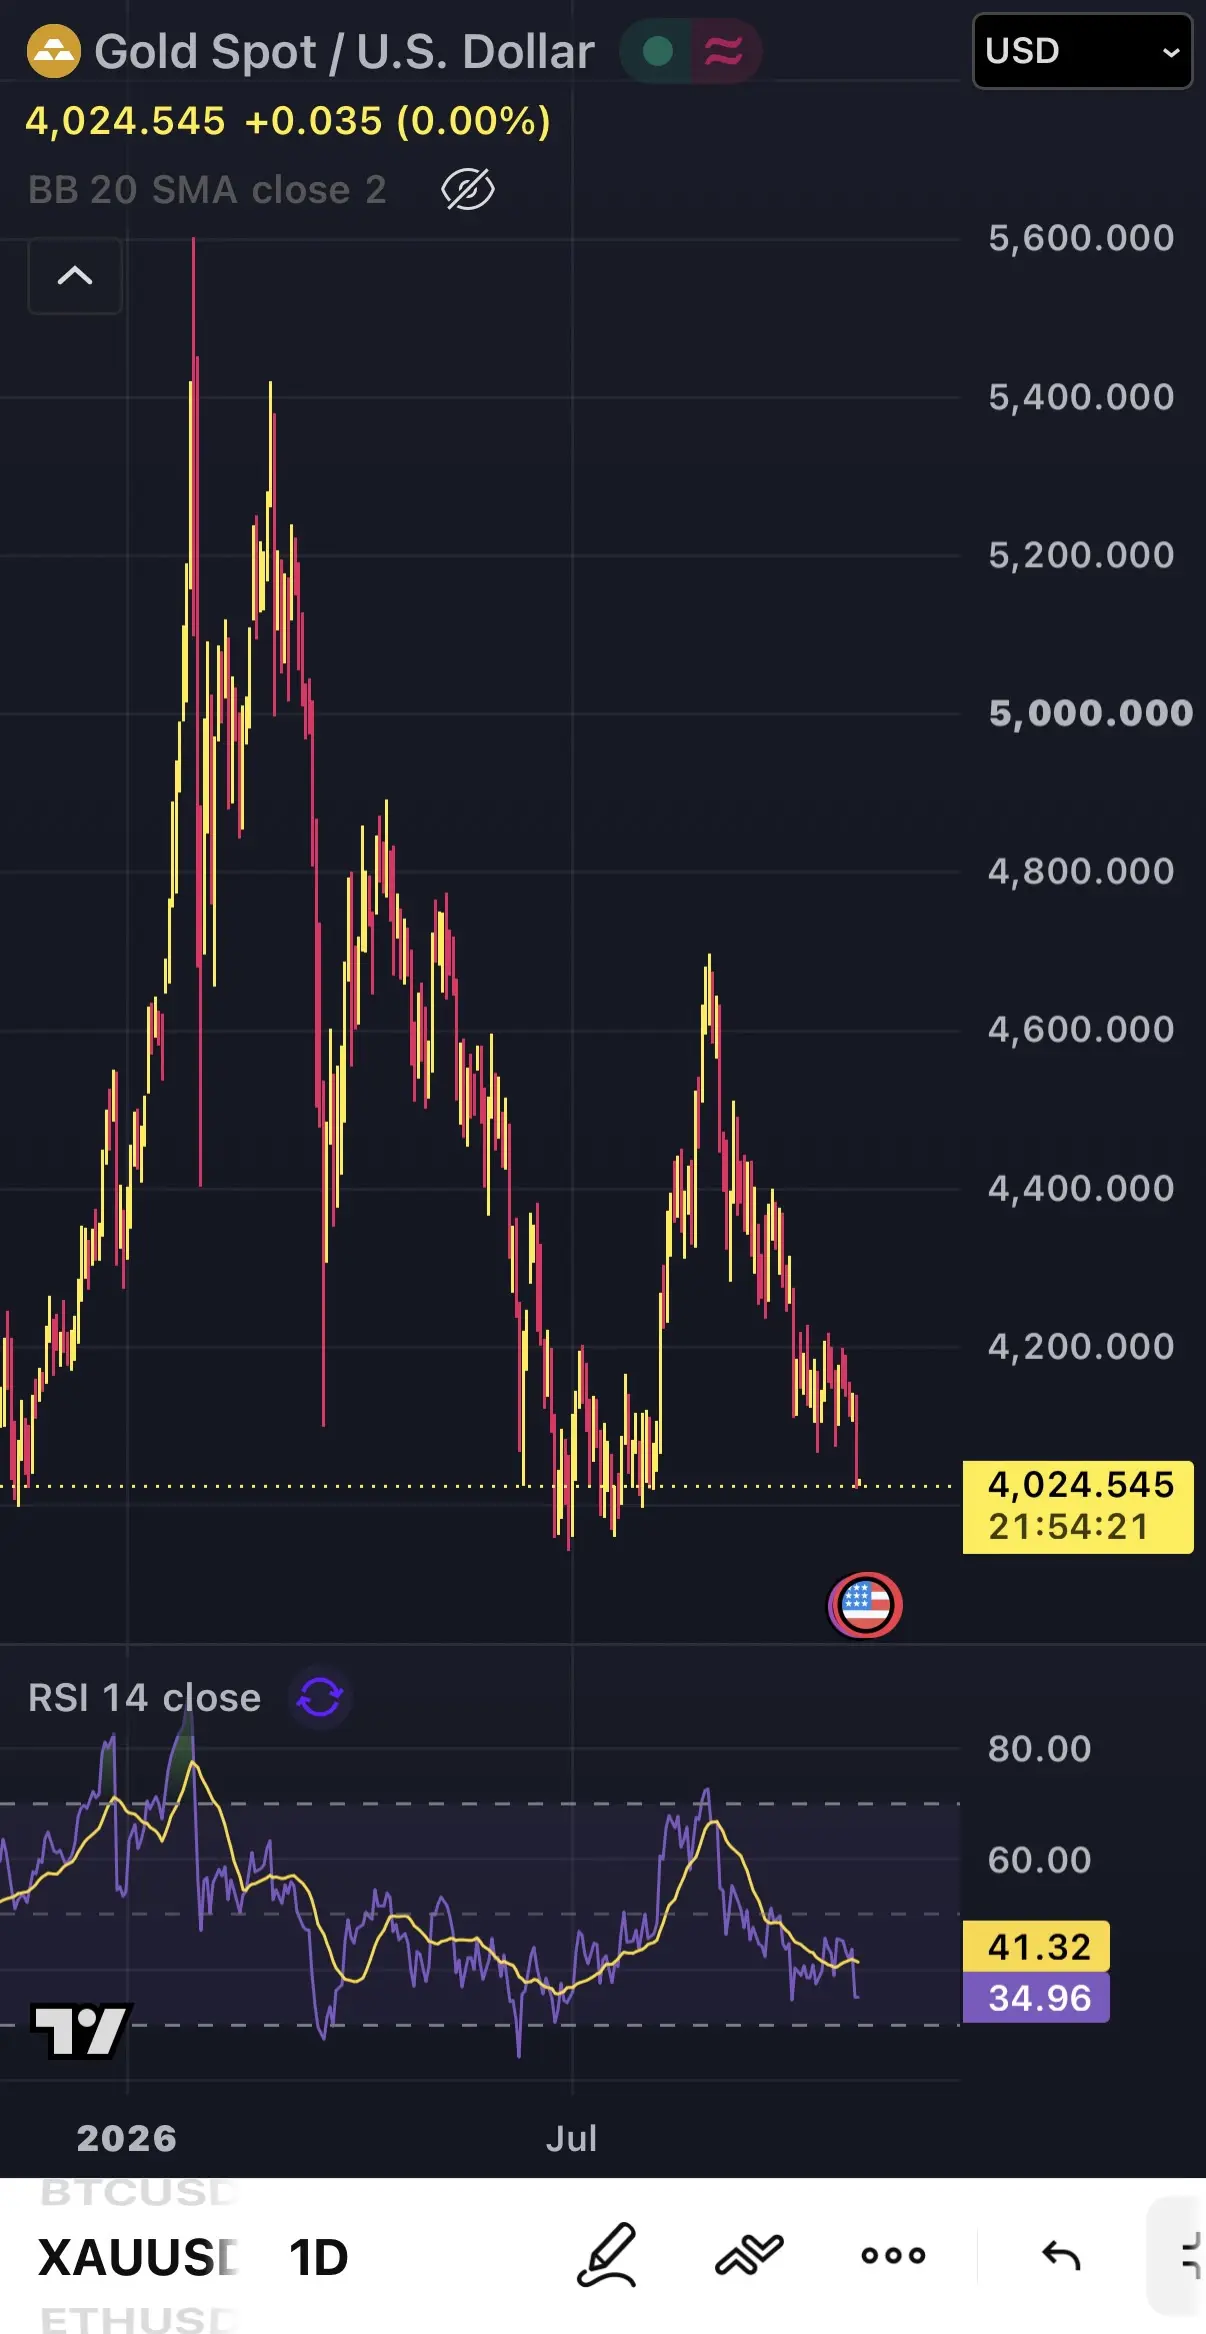
• 🥇 Gold: May dip on a stronger US dollar and rising real yields

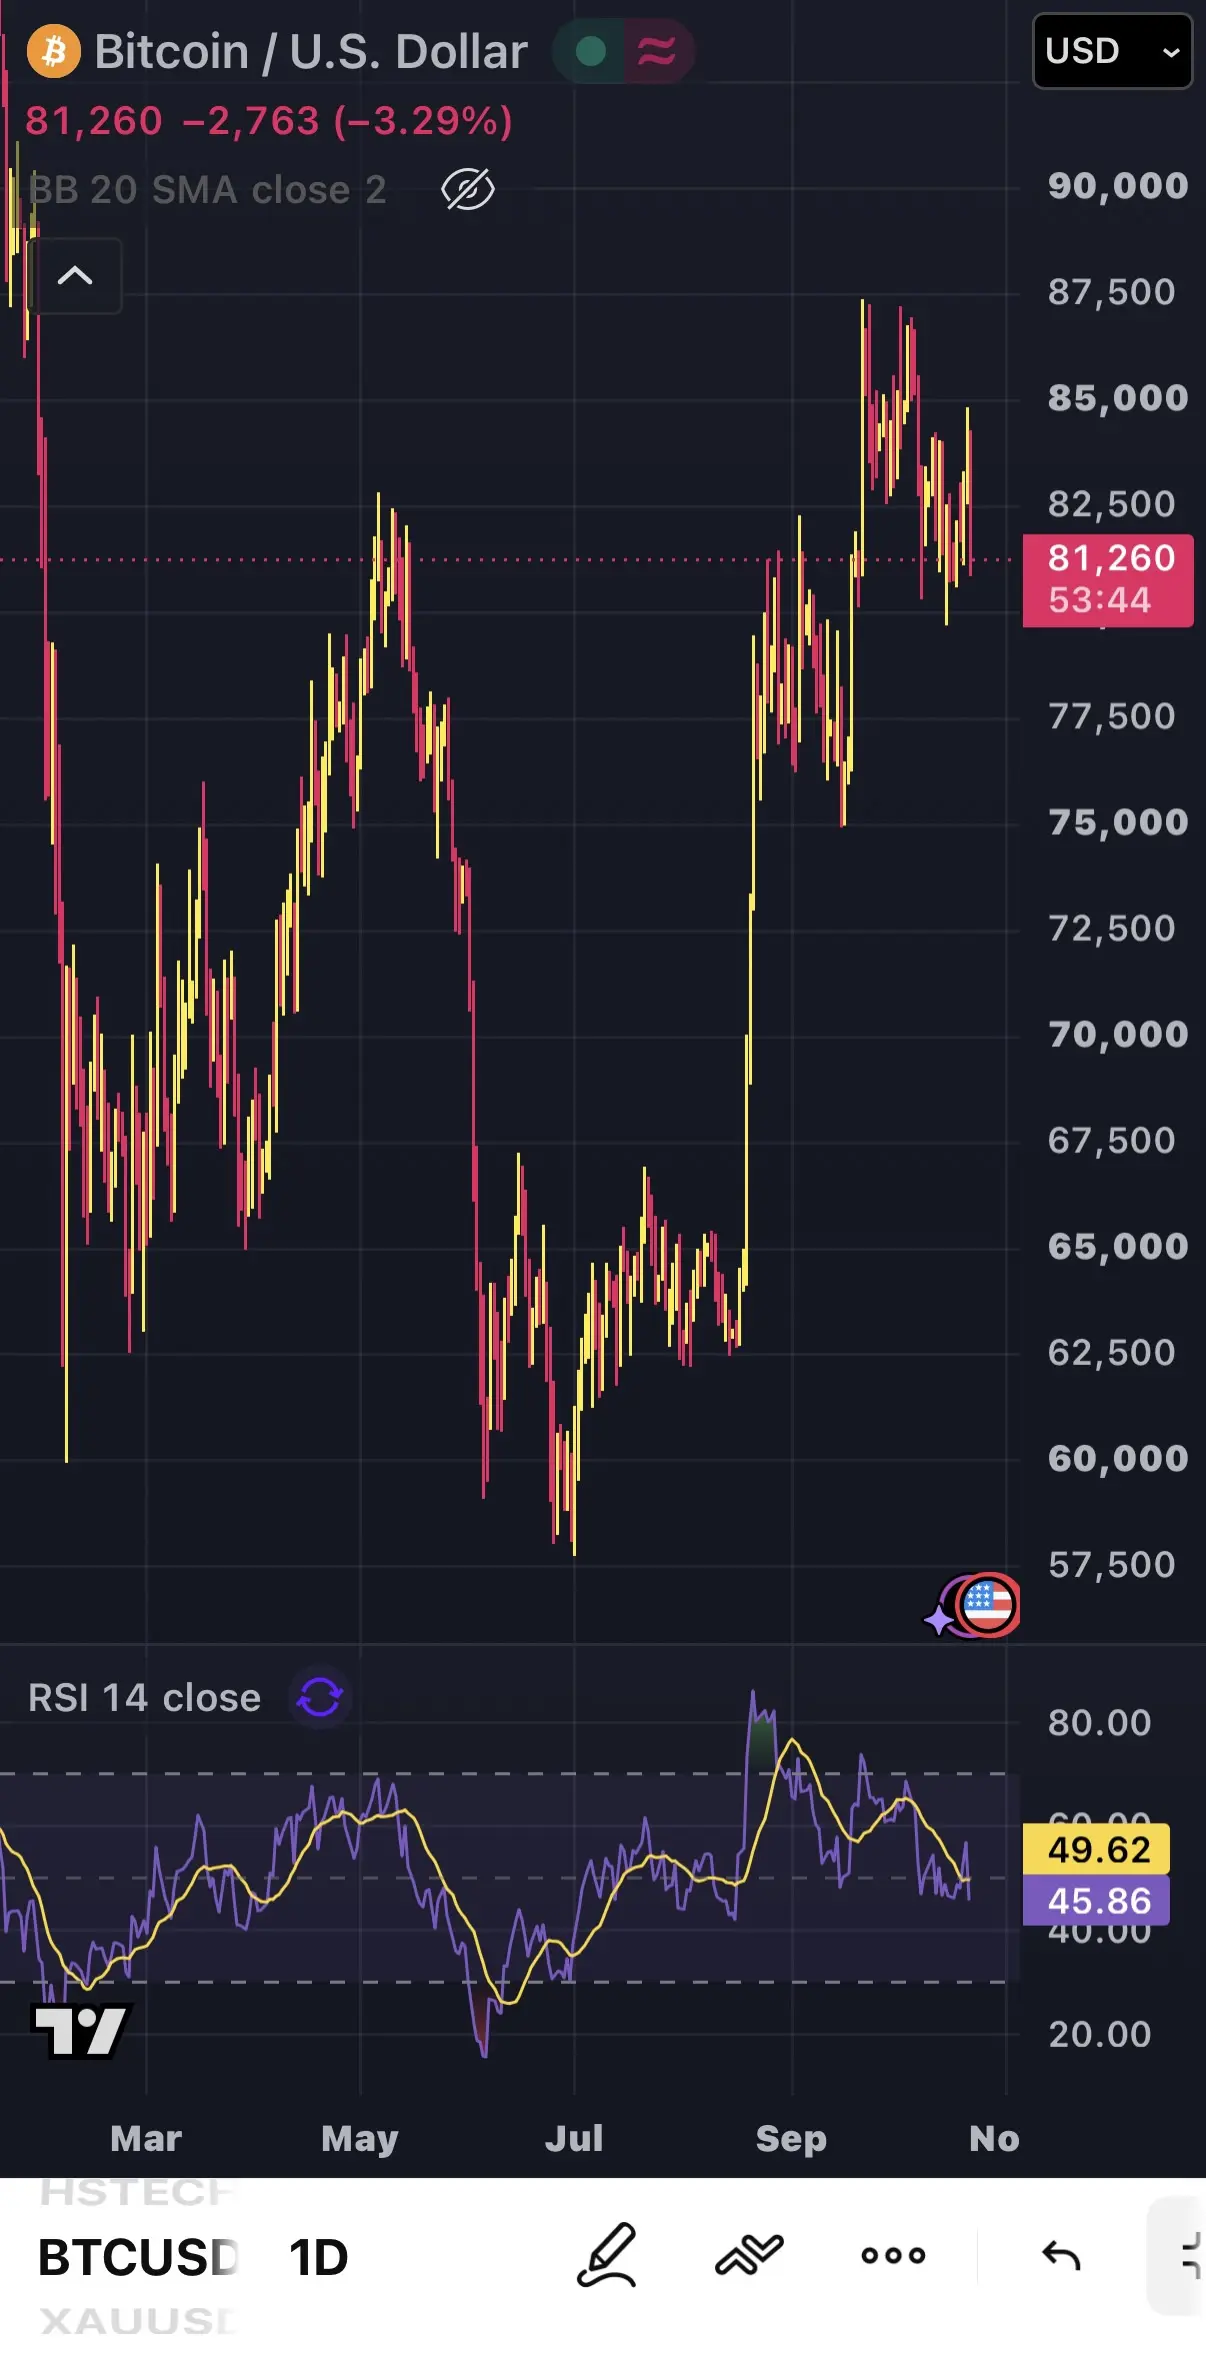
• ₿ Bitcoin: Could face selling pressure as investors turn more cautious

🟢 Scenario 2: Rates Unchanged Plus Dovish Tone

• 🥇 Gold: May rise as yields and the dollar soften

• ₿ Bitcoin: Could rally on improved risk appetite

🔴 Scenario 3: Surprise Rate Hike

• 🥇 Gold: Higher yields would likely weigh on price. Safe-haven demand may limit losses though

• ₿ Bitcoin: Sharp downside risk. Tighter conditions could force leveraged positions to unwind

🟢 Scenario 4: Surprise Rate Cut

• 🥇 Gold: May gain from lower yields and defensive flows

• ₿ Bitcoin: Could bounce on easier conditions. Recession worries might cap gains though

🎯 The main key difference

Gold is driven by real yields, the US dollar, and demand for safety.

Bitcoin is more sensitive to liquidity conditions, investor risk appetite, and market positioning.

📌 Bottom line

A hawkish Fed can weigh on both assets. A dovish stance can lift both too. Gold tends to hold up better during uncertainty. Bitcoin can deliver stronger gains when markets are in a risk-on mood.

Watch the Fed’s guidance, Treasury yields and the dollar. Do not just focus on the rate decision itself.

⚠️ Above write up are only possible scenarios, not guarantees. Sometimes Gold and bitcoin can be idiotic. Markets move on surprises not just what everyone expects.

Your turn: If the Fed shocks the market, which asset do you back. Gold or Bitcoin? 👇

$Gold.com(GOLD.US)$BTC/USD(BTCUSD.HAS)
图片 1,共 3 张
Gold Spot/U.S. Dollar USD 4,024.545 +0.035(0.00%) BB 20 SMA close 2 5,600.000 5,
图片 3,共 3 张
谋
谋定后动

Featured[Mou Weekly] The Knife of Credit Cuts Those Who Don't Borrow (Week 42, 2026 | Issue #292)

Last week, the Nasdaq 100 fell 5.5%, marking its worst week since the April 2025 tariff storm; the Philadelphia Semiconductor Index dropped for eight consecutive days, its longest streak since 2008; the VIX closed at 20.1 on Friday, standing above 20 for the first time since July 29. The knife started with a single bond. On Monday, it hit optical modules; Tuesday, memory chips; Wednesday, companies borrowing to build data centers; and Friday, software and cybersecurity firms. By close, every layer of the AI supply chain had been slashed. Yet among those getting cut, some hadn't borrowed a dime. In four days, from one bond to an entire industry chain: Monday, Oct 12...

一周四刀:AI链逐日失血 四大指数按10月9日收盘重设为100,方框为当日导火索 100 98 -2.0% -3.0% 96 一ow一Ⅲ6叹QT -5.5% 9
同一把刀,不同的伤口 刀按因子下:砍AI链里今年涨得多的,模拟芯片和老软件几乎没动 neocloud (CRWV NBIS IREN APLD CIFR) -2
危机只在一层,恐慌才在整条链 左:这周真正变贵的只有B+档;右:CoreWeave五年期CDS从368到1,195 AI公司的三档融资成本 CoreWeave的
三CNBC MARKETS BUSINESS INVESTING TECH POLITICS & POLICY VIDEO INVESTING CLUB JOI+4
C
Captain's Compass

【Market Predict & Win】September CPI Tonight: Wall Street Can't Agree. Can You? 🔥

7 Banks Say 2.4%. 6 Say 2.5%. That's How Close This One Is.At 8:30pm SGT tonight, the US releases September CPI. It's the last inflation print before the Fed's next decision on 28 Oct.Last month, the ...

Where does headline CPI land tonight?
Single choice
48 voted in PollsPoll ended
September CPI Forecasts Wall Street institutions' forecasts for U.S. September C
U.S.CPI Scenarios Stock Market View vl 1 Based on the median headline CPI YoY fo
F
Fattycat
Featured

📊 US CPI Tonight: Will Gold Shine or Face Pressure? 🥇

All eyes are on tonight’s US CPI release!

The latest inflation numbers will move gold prices, Fed rate expectations, and the US bond market.

Just remember, markets react not only to the figures themselves but also to how they stack up against forecasts.

🔴 Inflation hotter than expected

Gold may come under selling pressure as the US dollar and Treasury yields climb. Markets could price in higher-for-longer interest rates, pushing any rate cuts further out.

🟢 Inflation cooler than expected

Gold could find strong support. A weaker dollar and falling real yields tend to lift gold, while hopes for future rate cuts may rise.

🟡 Headline up, core inflation cools

This one could trigger mixed moves. Energy costs may lift headline CPI on the other hand a softer core numbers signal easing underlying inflation. Gold and bonds may swing both ways initially.

👀 What to watch closely

Focus on monthly core CPI, the US dollar, the 2-year Treasury yield and real yields.

These tell you if the reaction is likely to last.

⚠️ One key note: A single CPI report won’t decide the Fed’s next move. Jobs data, other inflation gauges, and broader economic conditions all matter too.

Will tonight’s numbers surprise us or you have something in mind.

Check out the full infographic for all three scenarios and what they mean for gold, rates, and bonds.

Not financial and investment advice. Do your own due diligence.

图片 1,共 1 张
F
Fattycat
Featured

🚨Will the Fed Coming Minutes Spark Market Volatility?🤔

Here is what retail investors need to watch and how different assets may move.

🔷What to Look For

1️⃣ Words Matter:

Notice whether they say “several” or “a few” officials support raising rates. Watch also the debate between persistent inflation and a cooling job market.

2️⃣ Timing Focus:

Markets see December as the likely window for any policy change, not October.

3️⃣ Important Context:

These September notes came out before we saw very weak NFP at just 29,000 jobs and softer PCE inflation data.

4️⃣ Balance Sheet Watch: Any talk about adjusting QT directly affects market liquidity and Treasury yields.

🔷How Assets May React

1️⃣ Bonds and US Dollar: Hawkish tone pushes yields higher and strengthens the dollar. This tests stock market strength.

2️⃣ REITs and Tech: Higher yields keep weighing on S-REITs. A stronger dollar adds pressure to HK and China tech shares.

3️⃣ Gold and Crypto: Tighter policy drags on gold and Bitcoin. A more dovish outlook would give both a relief boost.

See both infographics for the full picture!

For educational purposes. Not financial and investment advice ☺️.

图片 1,共 2 张
图片 2,共 2 张
F
Fattycat
Featured

🚨 This Week NFP Could Be the Market’s Next Big Trigger🤔

The U.S. Non-Farm Payrolls and unemployment report on 2 October may move the Fed, Treasury yields, the U.S. dollar, gold and Bitcoin significantly.

Here is the reasons. It is not just about how many jobs are added. The market cares whether the data shifts expectations for the Fed’s next move.

📉 Scenario A - Weaker Jobs Picture

Fewer jobs, higher unemployment, softer wage growth

→ Less chance of further Fed hikes

→ Lower yields and a weaker U.S. dollar

→ Support for gold and potentially Bitcoin

📈 Scenario B - Stronger Jobs Picture

More jobs, lower unemployment, firmer wage growth

→ Expectations for higher rates or rates staying elevated

→ Higher yields and a stronger U.S. dollar

→ Downward pressure on gold and Bitcoin

⚠️ Important Twist

Extremely weak jobs data could also spark recession fears. Gold may rise as a safe haven, while Bitcoin could act more like a risk asset and fall.

So look beyond the headline number. Watch the full picture:

NFP → Unemployment rate → Wage growth → Data revisions → 2Y Treasury yield → DXY → Gold & BTC

📊 Key Levels to Watch

Gold - Resistance at $4,300–$4,354. Support at $4,230 and $4,200

Bitcoin - Upside at $85,000–$85,800. Support at $83,800–$84,000 and $81,000–$81,400

Please refer to infographic for the full scenario map and levels.

The real question is not just how many jobs were created. It is what this means for the Federal Reserve.

For educational purposes ONLY☺️. Not investment and financial advice . Always do your on due diligence.

NFP & UNEMPLOYMENT How They Move the Fed, Gold and Bitcoin The 2 October 2026 U.
T
TheInvestingIguana
Featured

Iggy's Journal: US Treasury Yields Hit a 2007 High. Singapore's Own Bonds Just Followed.

28 September 2026, Morning

Yesterday's video asked why a US Treasury shock barely touched CPF and T-bills. This morning there's a more direct answer sitting in the data: Singapore Government Securities did move, just not through the channel most people check first.

The Numbers

Wall Street closed Friday's session with a genuine tech-led rally, Dow up 0.93 percent to 51,828.62, S&P 500 up 0.51 percent to 7,743.41, Nasdaq up 0.48 percent to 27,068.72, driven by gains in Microsoft, Qualcomm, and Dell as crude oil eased and Treasury yields pulled back slightly from their 2007-era peak. Brent fell 2.14 percent to $104.32 on signs of a possible compromise over Middle East maritime transit. USD/SGD sits at 1.2771. Back home, the actual transmission channel showed up in the SGS curve for the week: the 2-year yield rose 11 basis points to 1.93 percent, the 5-year climbed 5 basis points to 2.21 percent, the 10-year added 4 basis points to 2.47 percent, and 3-month SORA OIS repriced to 1.59 percent, all moving in response to global bond pressure and August's core inflation print of 2.2 percent. Separately, MAS is reviewing its stance on cross-border stablecoins under its Payment Services Act consultation, considering tokens co-issued by a domestic and international operator, and DWS expanded its Xtrackers ETF lineup on SGX to include direct, dual-currency access to the S&P 500, Nasdaq 100, and MSCI World.

(more in comment; out of space)

图片 1,共 1 张Long image
谋
谋定后动

Featured[Weekly Strategy] 5% Yield on Government Bonds, 30% Profit (Week 39 of 2026 | Issue No. 289)

Last week, the 10-year U.S. Treasury yield rose by about 20 bps to around 5.2%, its highest level since 2007. In the same week, the Nasdaq 100 ETF gained 3.2%. The bond market is sounding the alarm while the stock market is crunching the numbers: specifically, the two figures in the headline—a 5% sovereign yield and 30% earnings growth. Rising rates and equities together isn't a new phenomenon; let's put your mind at ease. Historically, it's not uncommon for both U.S. rates and stocks to surge. During the 2013 'Taper Tantrum,' the 10-year yield jumped from 1.6% to 3%, while the S&P 500 rallied nearly 30% for the full year. In the second half of 2016...

上周:利率涨了20个基点,纳指涨了3.2% 红线:10年期美债收益率 蓝柱:纳指100ETF(QQQ)收盘价 760 0- 5.25 PMI创五年多新高 单日+
三CNBC MARKETS BUSINESS INVESTING TECH POLITICS & POLICY VIDEO INVESTING CLUB JOI
这一轮利率上涨,涨的是实际利率,不是通胀预期 实际利率:扣掉通胀之后借钱的真实成本 今年2月以来10年期收益率的上升 10年期TIPS拍卖实际收益率 80- 3
三成的盈利:科技和通信是主引擎 标普5002026年三季度盈利增速预期,连续第三个季度超过25% 能源 111.4% 信息技术 63.5% 通信服务 51.3%+4
L
LazyCat

⚠️ Yield Curve Alert: What Soaring Long-Term US Yields Mean for Singapore Portfolios

Global fixed income markets have shifted dramatically. The US 30Y Treasury yield has climbed to 5.479% at the time of my writing—its highest level since June 2004. Meanwhile, the 10Y yield rose to 5.194% (a high since July 2007), leaving the 3-years and below yield as the last bastion of sub-5%.

🤔 Why Yields Are Spiking

While 2Y yields track immediate Fed policy, 10Y and 30Y yields price in long-term inflation, structural growth, and heavy US deficit spending (risk premium). That term premium repriced higher after S&P Global's Flash Composite PMI ran hot at 58.4 (strongest since July 2021) and Boston Fed President Susan Collins signaled inflation could stay "notably above 2%".

🔨 Impact on Local Markets & Banks

* Higher SORA & Loan Repricing: Because SG interest rates track US benchmarks, higher yields keep SORA elevated. This expands net interest margins (NIMs) for local banks—with UOB gaining the highest Net Interest Income boost due to its heavy SGD loan share, while DBS and OCBC leverage massive wealth AUM to capture high-yield asset inflows.

* Pressure on S-REITs & Growth Stocks: Higher risk-free yields raise capital costs & debt refinancing hurdles across REITs and highly leveraged equities.

* Attractive Fixed Income Yields: Locking in multi-decade high yields via SGD bond funds, high-grade corporate credit, or regional financial dividend ETFs offers compelling income shielding for portfolios.

👀 What to monitor?

Durable Goods Order (strong > yield higher), final Michigan Consumer Sentiments & Inflation Expectations (upside surprise > bond sell-off, lift 10Y further) & fed speeches (🦅 persistent inflation ⬆️ yield curve pressures; 🫸 against aggressive tightening > temporary bond relief).

🚨 Then the bigger test of whether the 30Y yield hold above the 5.3% into the next week, since a level unvisited since 2004 rarely settles on a first try....

T
TheInvestingIguana
Featured

Iggy's Journal: The 10-Year Treasury Just Pushed Past a 2007 High. Singapore's Banks Felt It the Next Morning.

25 September 2026, Morning

Wall Street's overnight session looked calm on the surface, three flat-to-slightly-down index moves. The bond market underneath it wasn't calm at all.

The Numbers

The Dow fell 0.31 percent to 51,349.98, the S&P 500 was essentially flat, down 0.02 percent to 7,704.13, and the Nasdaq actually closed up 0.01 percent at 26,939.37. None of that tells the real story. The 10-year US Treasury yield pushed past 5.11 percent and touched 5.20, retesting a level not seen since 2007, while Brent crude extended its rise for a second straight session, up 3.56 percent to $106.75, on the same Strait of Hormuz tension that pushed it through $103 the day before. USD/SGD sits at 1.2796. Back home, the STI closed Thursday's session down 0.5 percent at 5,683.37, on turnover of S$1.8 billion, dragged specifically by the banking trio: DBS down 0.3 percent to $77.48, OCBC down 0.2 percent to $31.59, and UOB down 0.8 percent to $42.50. Separately, StarHub and Keppel confirmed they've entered preliminary talks over a potential consolidation involving M1, still talks, no terms disclosed yet.

My Personal Take

A calm-looking index number can hide a genuinely unsettled bond market, and that's exactly what happened overnight. When the 10-year yield retests a level from 2007, every income asset back home gets repriced against that number whether the headline mentions it or not, and Singapore's own banks led the STI lower the very next session. That's not proof of causation on its own, but it's the kind of alignment worth watching rather than dismissing as coincidence. Oil rising two sessions running on the same geopolitical story is the other thread I'm not done with yet, one day of a move is noise, two is starting to look like a pattern.  


Not financial advice. Iggy's Forensic Compliance Standards apply.

图片 1,共 1 张
F
Fattycat
Featured

⚠️ Surging Bond Yields - The Summit-Era Market Shock

Right as the Trump & Xi summit unfolds, rising bond yields are sending major shockwaves through global financial markets. 🫣

The U.S. 10-year Treasury yield has surged to 5.121%. The yield curve has un-inverted to a positive spread of +0.213% and the 30-year yield has climbed to 5.408%.

Higher risk-free discount rates are fundamentally repricing growth assets and tightening global liquidity conditions.

🔷Growth & Tech Stocks Take the Hardest Hit

Future earnings are valued less now hence stock multiples compress sharply. At the same time, the stronger U.S. yields lift the dollar.

This puts double pressure on cross-border leaders like Alibaba, Tencent, JD.com and Xiaomi as currency depreciation and capital flowing out of emerging markets.

🔷Gold Caught Between Opposing Forces

Non-yielding gold faces headwinds from rising opportunity costs. But geopolitical tensions in the Middle East provide safe-haven demand that partially offsets the drag.

🔷How to Navigate the Volatility

To manage this heightened selling pressure, traders can use indicators including Volume Delta, Volumatic VIDYA, RSI, and Bollinger Bands. These help track institutional distribution and spot where downward momentum may exhaust itself near key support levels.

Please refer to the infographic “Rising Yields Revalue the Market” for the full picture.

The 5% Ripple Effect: How Rising 】Yields Revalue the Market 10-Year Yield Breach
图片 2,共 3 张
Bongs v Region A-Z Yield Change 7:40 PMEDT 0.00% US 6-MO 4.35% +0.007 U.S.6Month
F
FaithAnchor
Featured

$DBS(D05.SG)

Fed Hike: A Mixed Bag for Singapore Banks

The Fed’s surprise 25bp hike to 3.75–4% changes the rate narrative. For Singapore banks, it’s less about an immediate earnings boost and more about how long rates stay elevated.

FY2026 numbers already show margin pressure. DBS’ NII has softened, while OCBC and UOB have also seen NIMs edge lower as funding costs rise and the rate cycle turns.

A higher-for-longer environment could slow further NIM compression, but it’s not a free lunch. Higher funding costs, weaker loan demand and rising credit risks could offset some of the benefits. Tariffs, energy inflation and heavy AI capex add another layer of uncertainty for corporate borrowers.

Valuations also leave less room for disappointment. DBS trades at a premium to book, while UOB remains comparatively cheaper on both price-to-book and earnings multiples.

Technically, all three local banks remain at elevated levels after their strong runs.

The key question now: can higher rates protect margins without triggering higher credit costs?

Not financial advice. Investors should conduct their own research and consider their risk tolerance.

Fed Hike: A Mixed Bag for Singapore Banks X DBS 9 OCBC The Fed's surprise 25bp h
T
TheInvestingIguana
Featured

Iggy's Journal: Wall Street Fell on a Yield Not Seen Since 2007. Singapore's T-Bill Just Printed at 1.70%.

24 September 2026, Morning

I'm writing this one from an airport, one more flight before I'm actually home, so bear with me if it reads a touch leaner than usual. Wall Street had a rough overnight session, and the number underneath the headline drop is worth more of your attention than the drop itself.


The Numbers

The Dow fell 0.68 percent to 51,511.59, the S&P 500 dropped 0.75 percent to 7,706.03, and the Nasdaq led the slide, down 1.13 percent to 26,936.04. The driver was the bond market: the 10 year US Treasury yield pushed toward its highest level since 2007 after a stronger than expected September business survey reinforced bets on further Fed hikes, and Brent crude jumped over 4 percent past $103 a barrel on renewed Strait of Hormuz worries. Back home, the STI's last official close was 5,710.00 on 23 September, down 0.24 percent, as Singapore's own core inflation accelerated to 2.2 percent for a third straight month, the highest reading since September 2024. USD/SGD sits at 1.2797. 

MAS's scheduled six month T-bill auction this morning cut off around 1.70 percent, the first genuinely clean rate figure I've had in hand all week, worth comparing against your own last renewal. 


My Personal Take

Rising global yields and a domestic inflation print landing on the same news cycle is really one story wearing two costumes. Every income asset on this board now has to justify itself against a higher hurdle, not because anything changed at the company level, but because the alternative your money could sit in instead just got more expensive. I'm also keeping half an eye on the Trump-Xi state visit kicking off in Washington today. A two month trade truce extension is the kind of headline that moves sentiment fast without changing a single Singapore balance sheet. What would change my view here is a number or a term sheet, not a headline.

Not financial advice.

WALL STREET YIELDS HIT 2007 LEVELS 24 SEPTEMBER 2026 WALL STREET & YIELDS SINGAP
T
TheInvestingIguana
Featured

Iggy's Journal: Inflation Ticks Up for a Third Straight Month. The STI Barely Noticed.

23 September 2026, Evening

(No infographic for this post; I'm on a plane right now) 


The STI closed at 5,709.9, down 13.85 points, a quiet 0.24 percent day. Underneath that quiet, Singapore just posted its highest core inflation reading in two years, and the room is genuinely split on what MAS does about it in October.


The Numbers

Core inflation rose to 2.2 percent in August from 2 percent in July, the third straight monthly increase, while headline inflation, which includes accommodation and private transport, ticked up to 2.3 percent. Airline ticket costs jumped 12.9 percent, the sharpest rise in nearly four years, and services inflation climbed to 2 percent from 1.7 percent the month before. MAS already tightened the SGD NEER slope twice this year, in April and again in July, and economists are now split on whether October brings another small tightening or a hold. DBS's Chua Han Teng summed up the tension in four words, inflation "firmed but not accelerating."  

My Personal Take

Barclays called this data "more benign" than what MAS was pricing in back in July, and I think that's the real story hiding under a boring index day. The central bank tightened twice this year on the expectation that growth would eventually show up as inflation. Now the inflation is showing up, just slower and milder than the move that was meant to get ahead of it. That's not a policy mistake, it's a central bank managing a moving target in real time, but it does mean the case for October restraint gets a little stronger with every print like this one. If your T-bill or fixed deposit is coming up for renewal around then, this is exactly the kind of data that decides whether your next rate looks better or worse than the last one.


Cheers, Iggy