What is the US stock order book?
US Order Book provides 60 levels Bid and Offer, covering pre-market, regular, post-market, and overnight trading sessions.
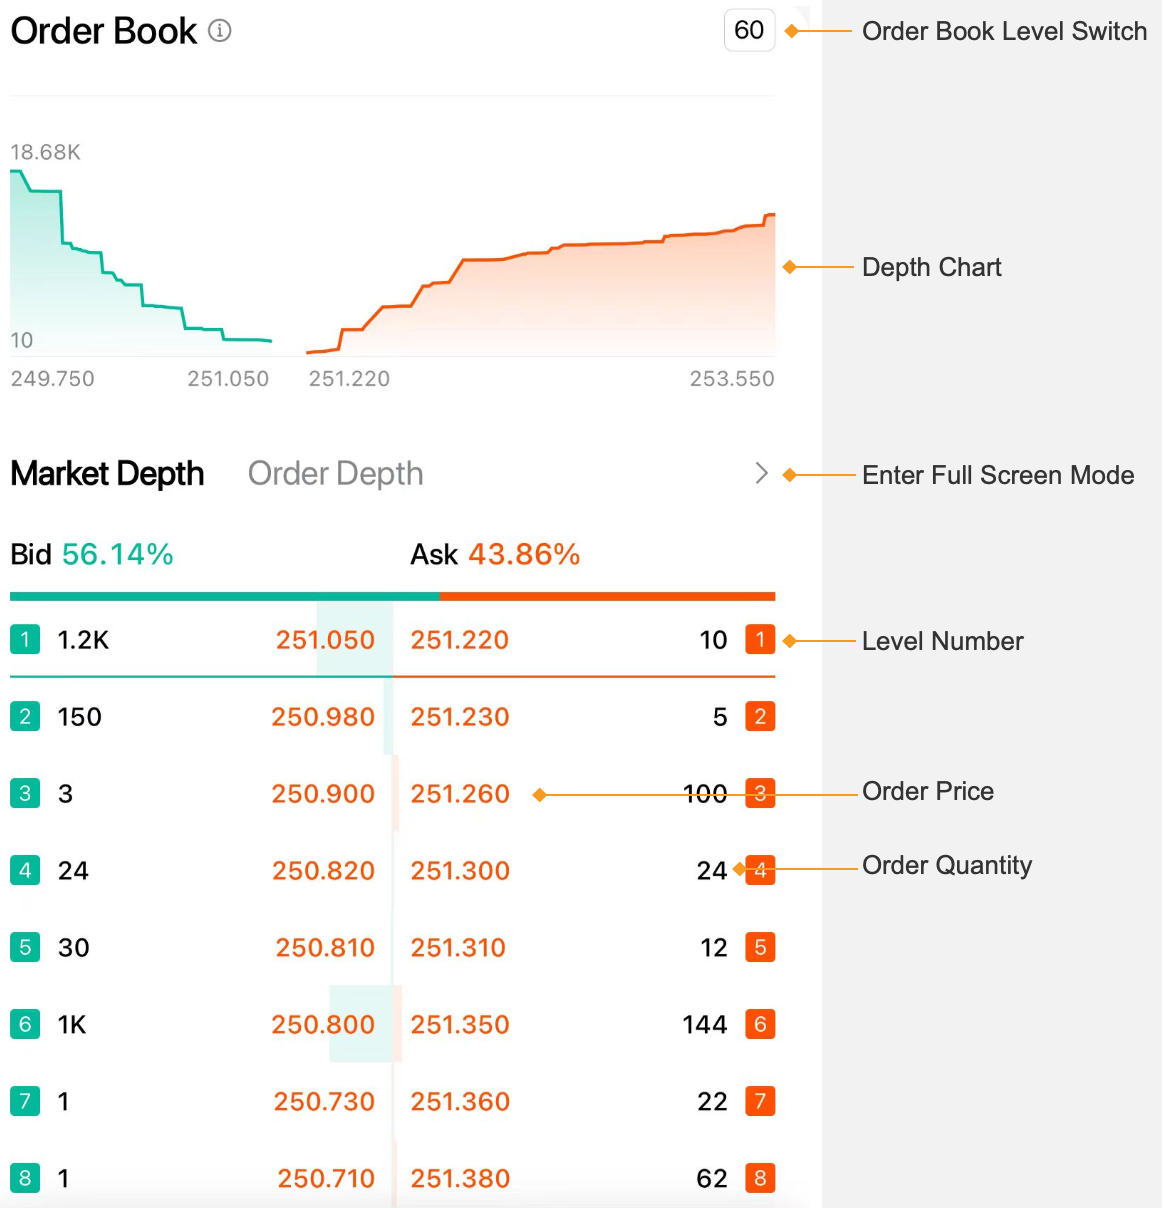
1. Feature Overview
1.1 Depth Chart
The Depth Chart displays the number of buy and sell orders at various price levels. It is based on the top 60 levels of buy and sell orders.
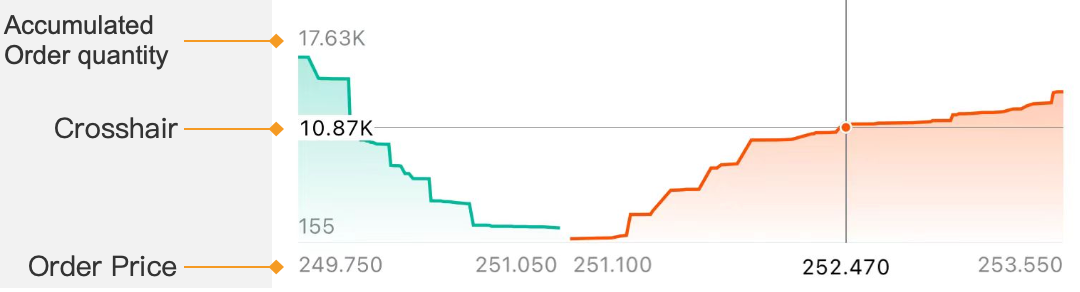
- Horizontal Axis: It displays order prices. From left to right, the four prices are: the low price of the 60 bid levels, the high price of the 60 bid levels (best bid price), the low price of the 60 ask levels (best ask price), and the high price of the 60 ask levels.
- Vertical Axis: It displays the order quantity required to be filled when reaching this price level. The bottom value is the smaller of the best bid and best ask quantity, while the top value is the larger of the total buy quantity and total sell quantity of the 60 levels.
- Crosshair: It displays the selected price level and the order quantity required to be filled to reach that price.
With the Depth Chart, you can easily see the quantity of buy and sell orders at different price levels and understand the current market's buying and selling demand:
- Width: It reflects the distribution of order prices.
- Height: It displays the trend of total buy and sell order quantity.
- Steepness: It shows the price levels where orders are concentrated and their respective quantities.
1.2 Market Depth
Market Depth provides detailed bid and ask quotes, covering up to 60 levels. Users can select from different depths, including 1, 5, 10, 20, 40, or 60 levels.
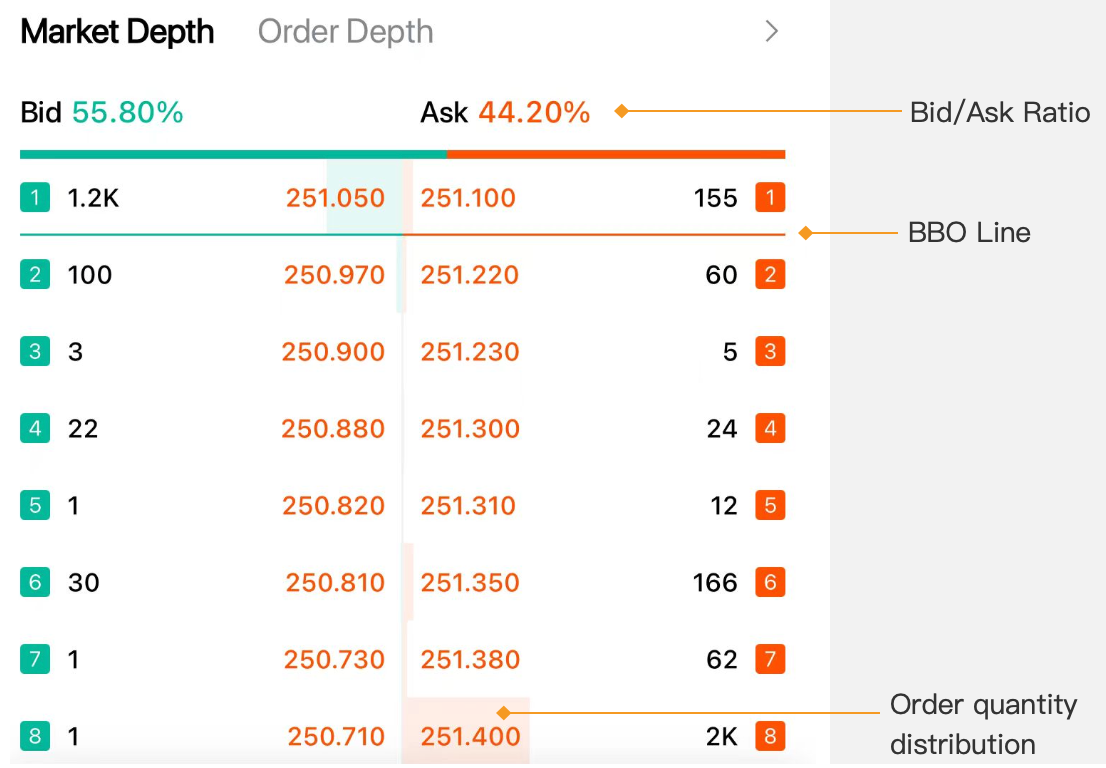
Bid/Ask Ratio:
- Bid Ratio: This refers to the ratio of the "total buy quantity" to the "total order quantity" for a security on Nasdaq. The "total order quantity" is the sum of the "total buy quantity" and the "total sell quantity".
- Ask Ratio: This refers to the ratio of the "total sell quantity" to the "total order quantity" for a security on Nasdaq.
Note: The Bid/Ask Ratio provides an insight into total order quantity distribution of a security on exchange, not limited to the top 60 levels.
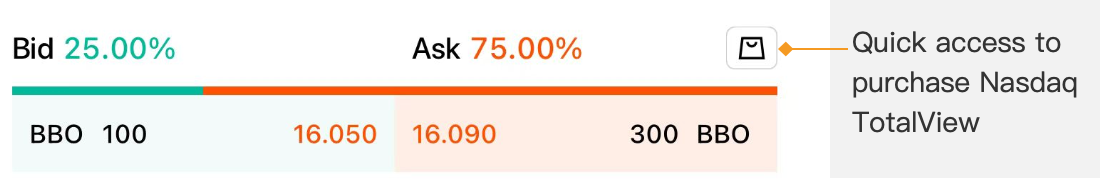
BBO Line:
It identifies the orders within the best bid and offer (BBO) in the order book.
- Bid Side: Orders with prices higher than or equal to the best bid price are displayed above the bid BBO line.
- Ask Side: Orders with prices lower than or equal to the best ask price are displayed above the ask BBO line.
| BBO Type | Explanation |
| NSDQ BBO | Nasdaq TotalView and NSDQ BBO both represent data from Nasdaq Stock Exchange, so the best bid and ask prices in Nasdaq TotalView are the same as those in NSDQ BBO. |
| National BBO | National BBO aggregates the best quotes from 17 exchanges across the United States, representing the highest bid and the lowest offer from all quotes, excluding odd-lot orders. Therefore, when it is NBBO, the BBO line may span multiple quote levels. |
Order Size Bar:
The colored order size bar visually shows the distribution of bid/ask order quantities.
The area of bar is drawn on the basis of current maximum order quantity, and the bar on each level is displayed proportionally according to its order quantity compared to the maximum.
Note: On the Quote page, it takes the selected maximum order quantity as the benchmark, while under full screen mode, it takes the maximum order quantity of 60 levels as the benchmark.
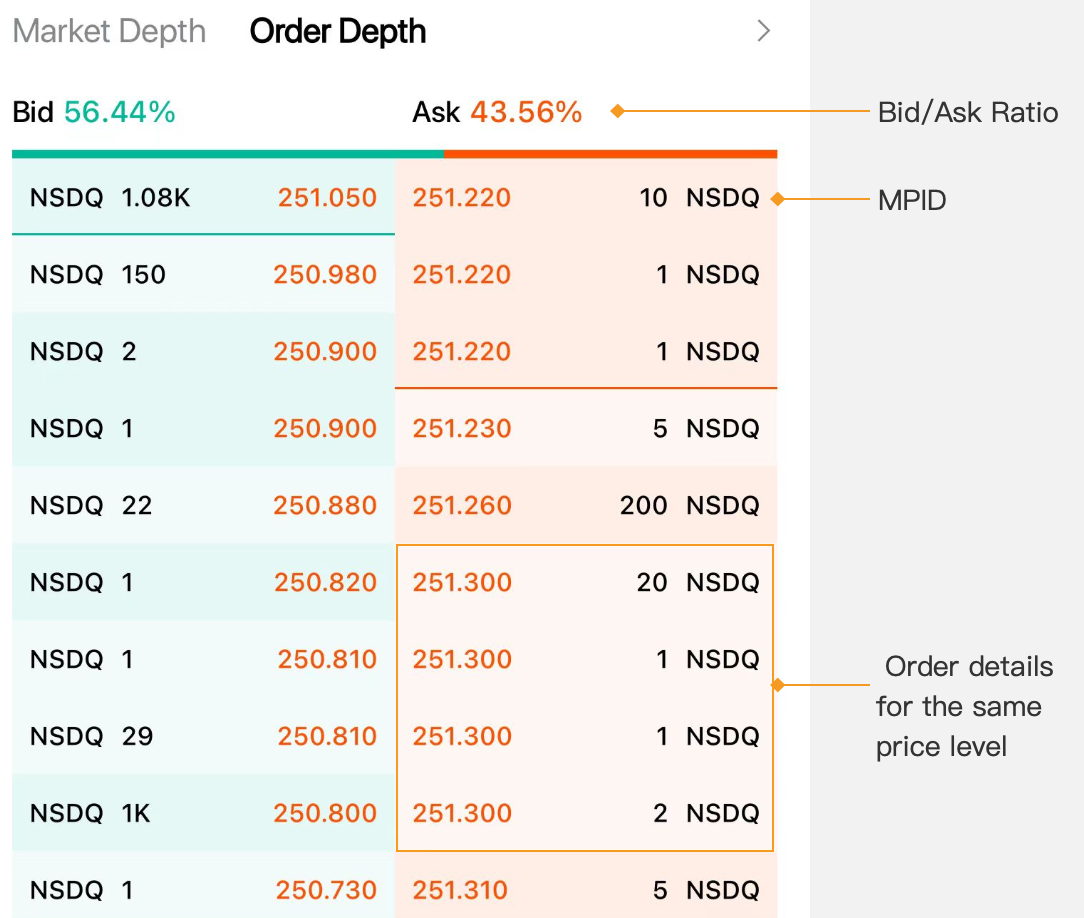
1.3 Order Depth
Order Depth provides detailed information for each bid/ask order across all 60 levels.
- MPID (Market Participants ID) Indicates the ID of a market participant. If a MPID is not provided by participants, it is shown as NSDQ, indicating that the order is from the Nasdaq exchange. BLUE indicates orders from Blue Ocean Exchange during overnight trading.
- The bid/ask ratios and BBO line rules adhere to the standards set by Market Depth.
2. Differences Between Nasdaq TotalView and BBO
| Market Data | NSDQ BBO | National BBO | Order Book |
| Description | Nasdaq best bid and offer | Best bid and offer from 17 US exchanges | 60-level of bid and offer |
| Level | Level 1 | Level 1 | Level 2 |
| Exchange | Nasdaq | 17 US exchanges | Nasdaq & Blue Ocean |
| Order Book Data | 1 level of bid and offer | 1 level of bid and offer | 60 levels of bid and offer |
| Order Depth | No | No | Yes |
| Depth Chart | No | No | Yes |
3. FAQs
3.1 During which trading sessions is Nasdaq TotalView provided?
| Trading Session | Nasdaq TotalView |
| Pre-market trading | Nasdaq TotalView |
| Regular trading hours | Nasdaq TotalView |
| Post-market trading | Nasdaq TotalView |
| Overnight trading | Blue Ocean LV2 |
| Market closed | None |
3.2 How do I gain access to Nasdaq TotalView?
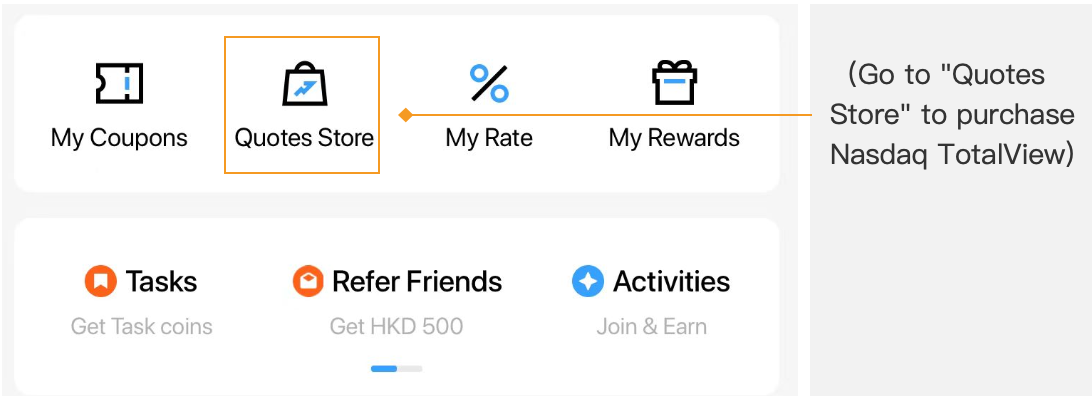
You can visit the "Quotes Store" to purchase access via the following methods:
① Tap the quick access entry in the top right corner of the BBO page. This will redirect you to the "My Quotes" page where you can purchase Nasdaq TotalView.
② Go to "Me -> Quotes Store" to purchase market data access.
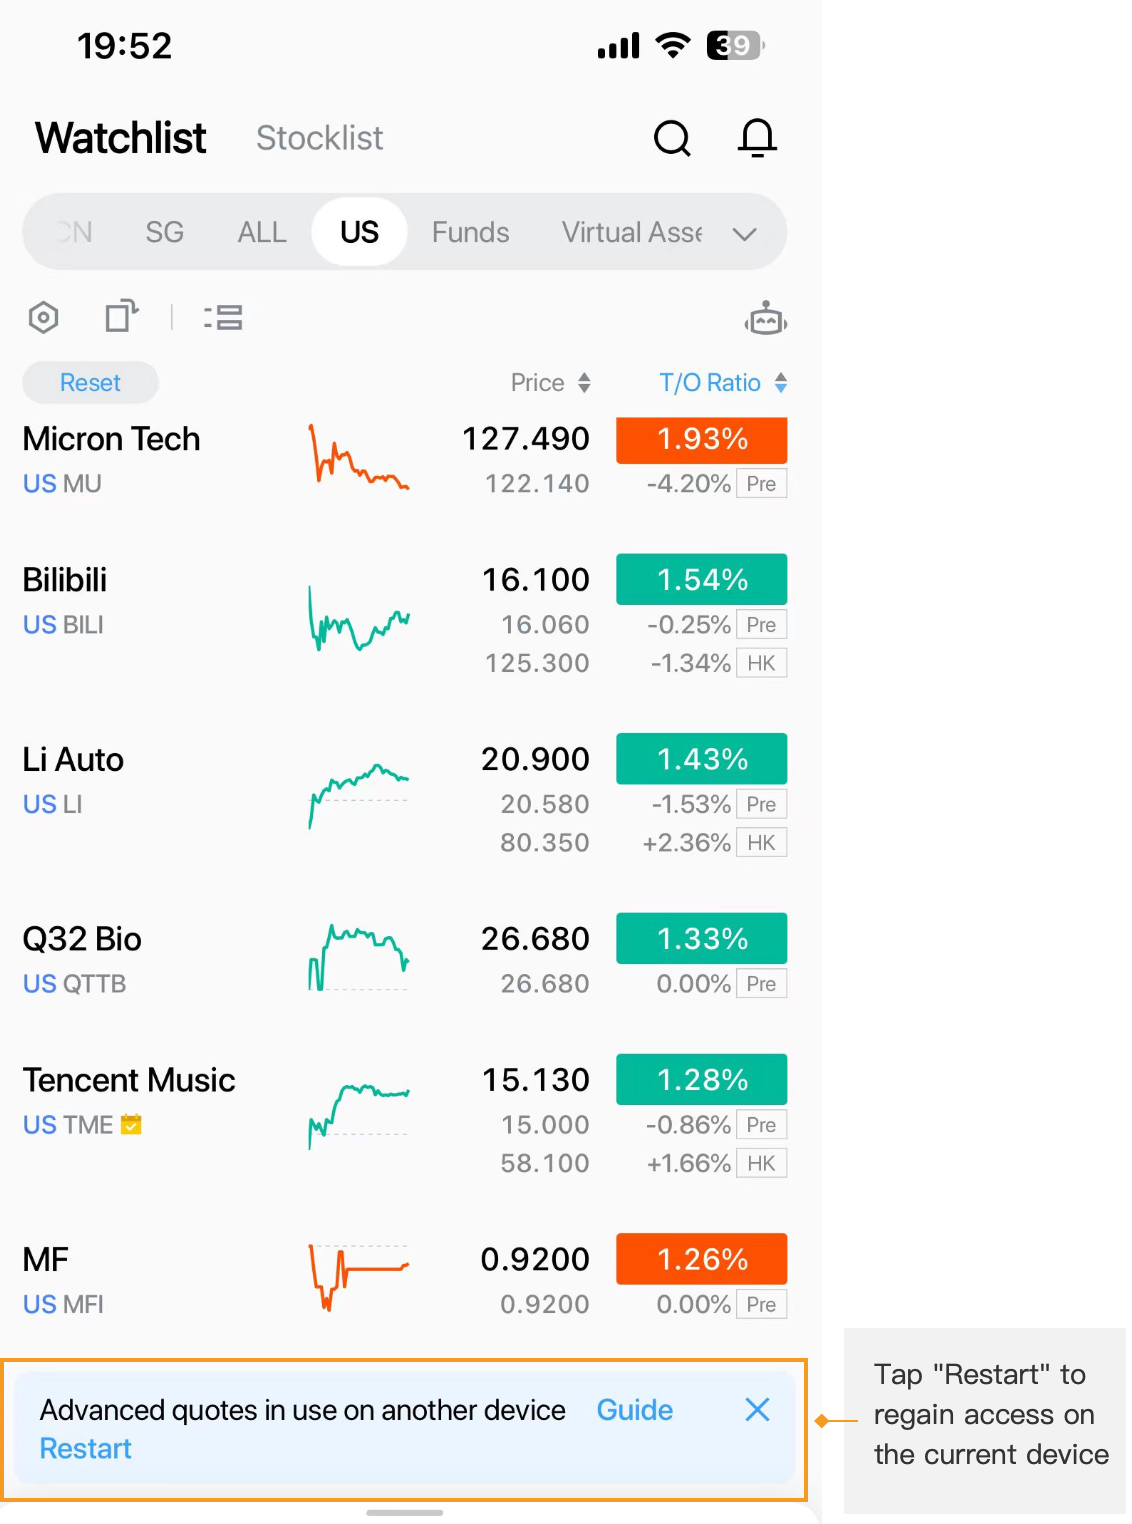
3.3 I have already purchased access to Nasdaq TotalView. Why am I unable to see the data after launching my terminal?
Due to exchange regulations, advanced paid market data is restricted to a single device. When multiple devices are logged in simultaneously, only the most recently logged-in device will display the data, while the older device will show a message indicating that the market data has been occupied.
To resolve this, tap "Restart" to regain access on the current device.
Key Takeaways: Depth charts, depth quotes, and order details visualize multi-level bid/ask quantity distribution, helping you understand the strength of buying and selling forces and liquidity. The bid/ask ratio reflects order quantity structure, and BBO lines indicate optimal price ranges. In the bar chart, bar length scales in proportion to the maximum order quantity. Long-press on the depth chart to activate a crosshair and check the price and the corresponding accumulated order quantity needed. The number of price levels displayed can be changed. You can purchase access to order book on the quote page or by tapping Me > Quotes Store. The access is limited to one device only. You can tap Restart to restore access on the current device.
Disclosures
This article is for reference only and does not constitute any investment advice.
Office hours of HK Hotline and Whatsapp: 9:00 - 18:00 * (GMT+8) on trading days
Office hours of Global Hotline: Trading days 24 hours; Non-trading days 9:00 - 18:00 * (GMT+8)
Outside of the above service hours, if you have any questions, please contact our online customer service.
Office hours of online customer service:
© 2026 Longbridge
* Offers are subject to terms and conditions

A licensed corporation recognized by the SFC (CE No. BPX066). Holder of License Types 1 (Dealing in Securities), 2 (Dealing in Futures Contracts), 4 (Advising on Securities) and 9 (Asset Management). Also a registered HKEX participant and HKSCC participant.

Registered with the Monetary Authority of Singapore (MAS), Long Bridge Securities Pte. Ltd. is a Capital Markets Services Licence holder and Exempt Financial Adviser (Licence No. CMS101211).

A broker dealer registered with the Securities and Exchange Commission (SEC)(CRD: 314519/SEC: 8-70711), a member of the Financial Industry Regulatory Authority (FINRA) and Securities Investor Protection Corporation (SIPC).

New Zealand registered Financial Service Provider (FSP number: FS600050) and a member of the Financial Dispute Resolution Scheme, a New Zealand independent dispute resolution service provider.
The content and materials published here on this website is for general information only and should not be regarded or deemed to be an offer, invitation, or solicitation, recommendation or advice to buy, sell, subscribe or dispose of any investment products or financial services. It does not take into account the specific personal circumstances, investment objectives, financial situation or particular needs of a person and may be subject to change without notice.
Please consult your financial or other professional advisers if you are unsure about the information contained herein. Investments involve risks. Be aware that investments may increase or decrease in value and that past performance is no guarantee of future returns, you may not get back the amount originally invested. You should not make any investment decision based on this content alone.