Desktop Update Log
Version 2.36.0
Updated: 01/21/2026
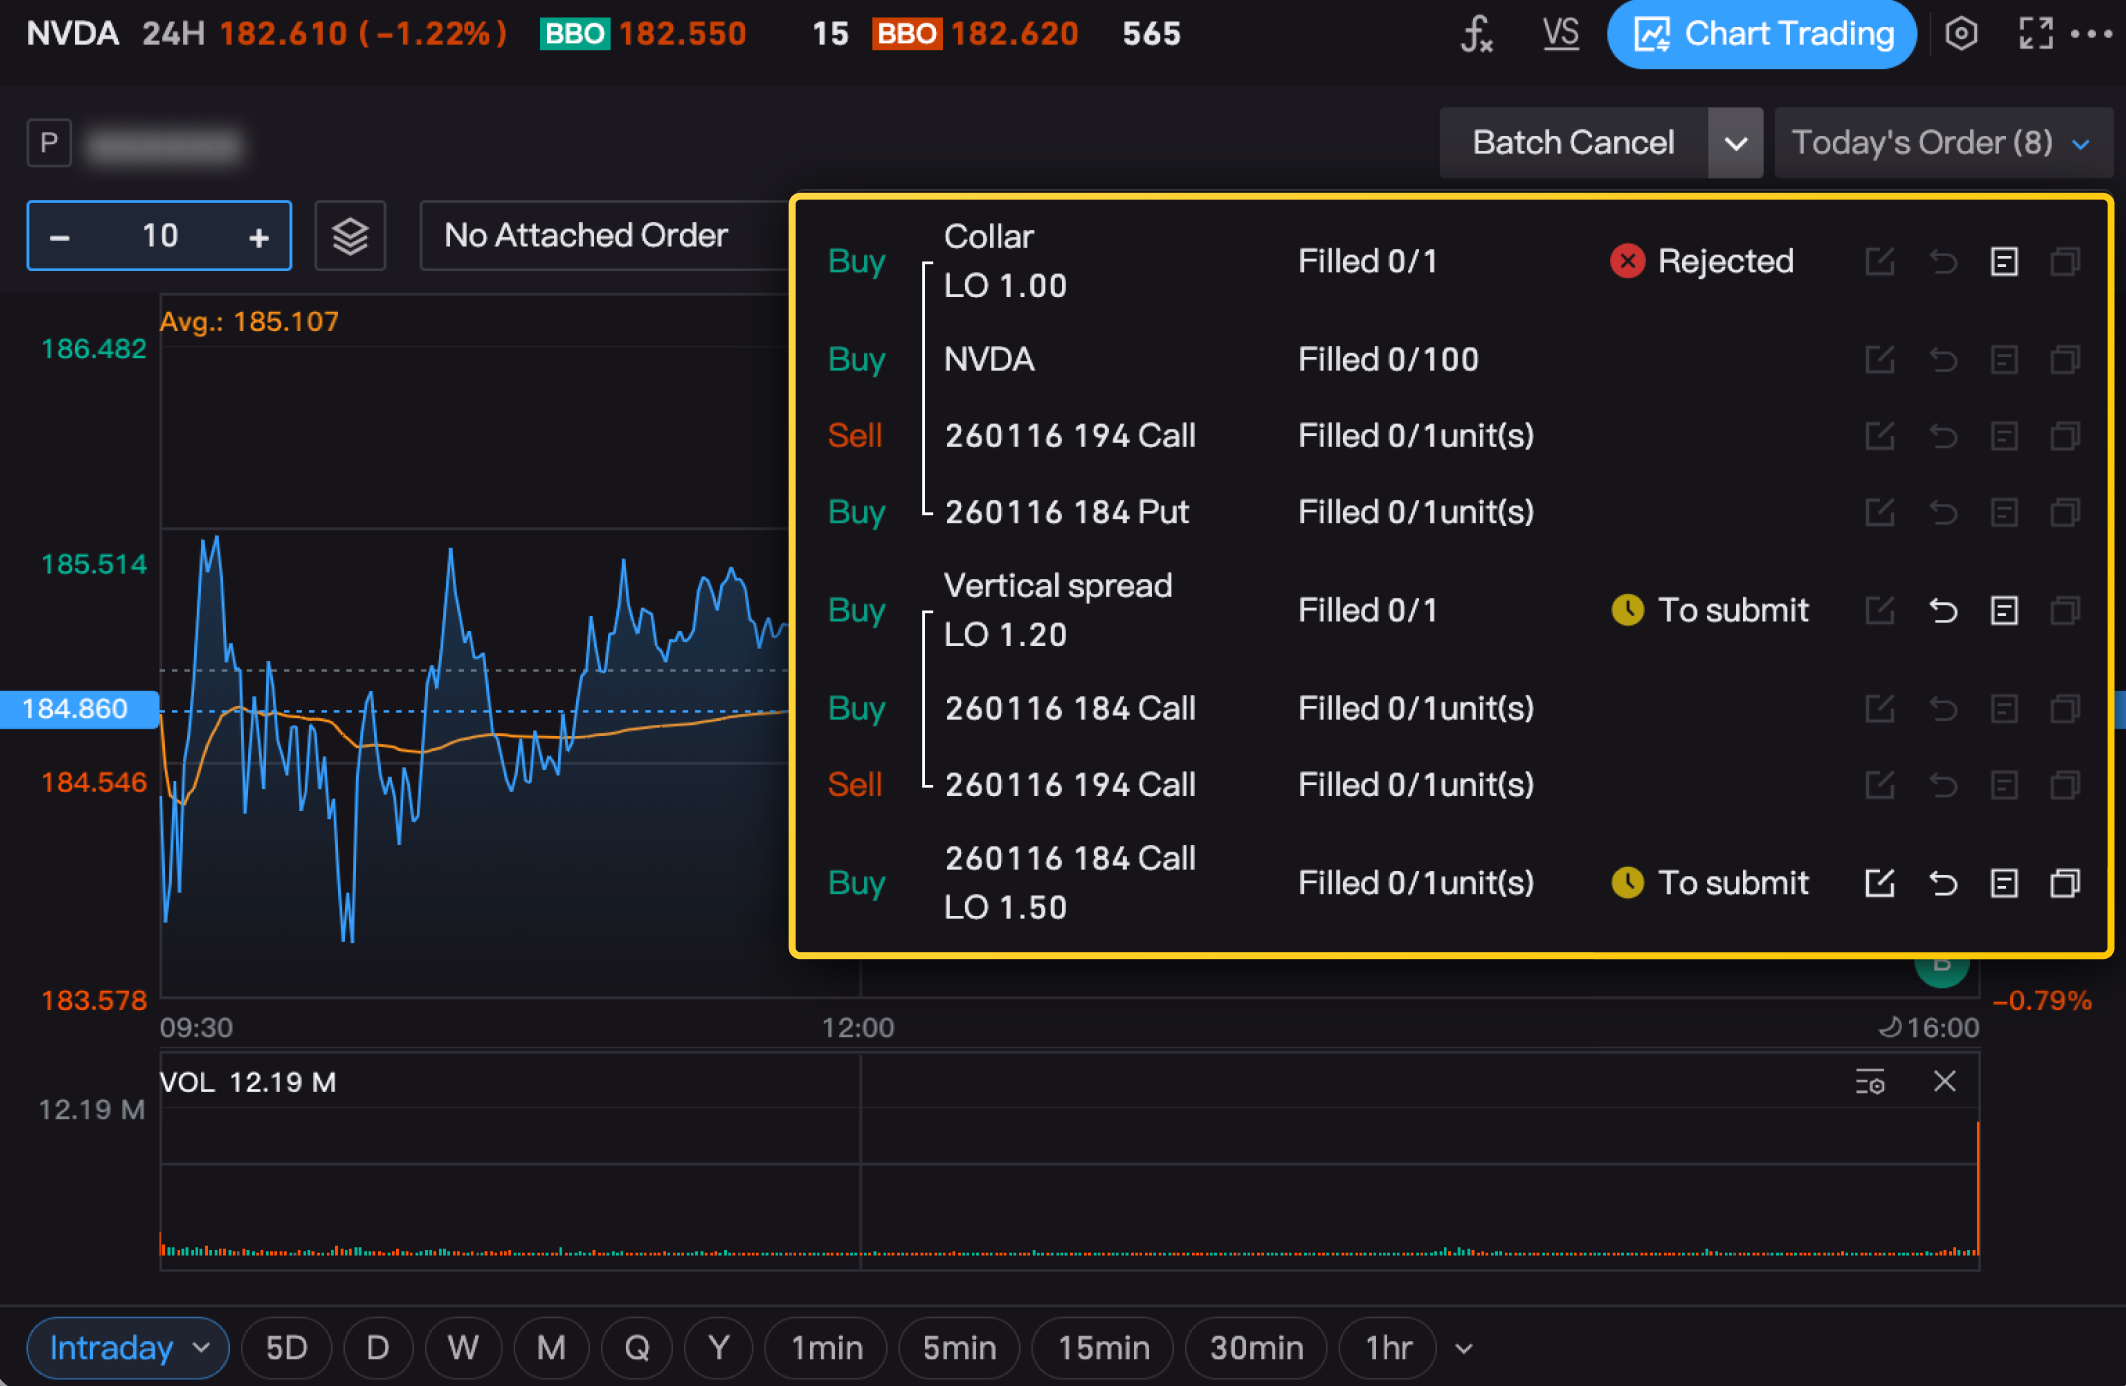
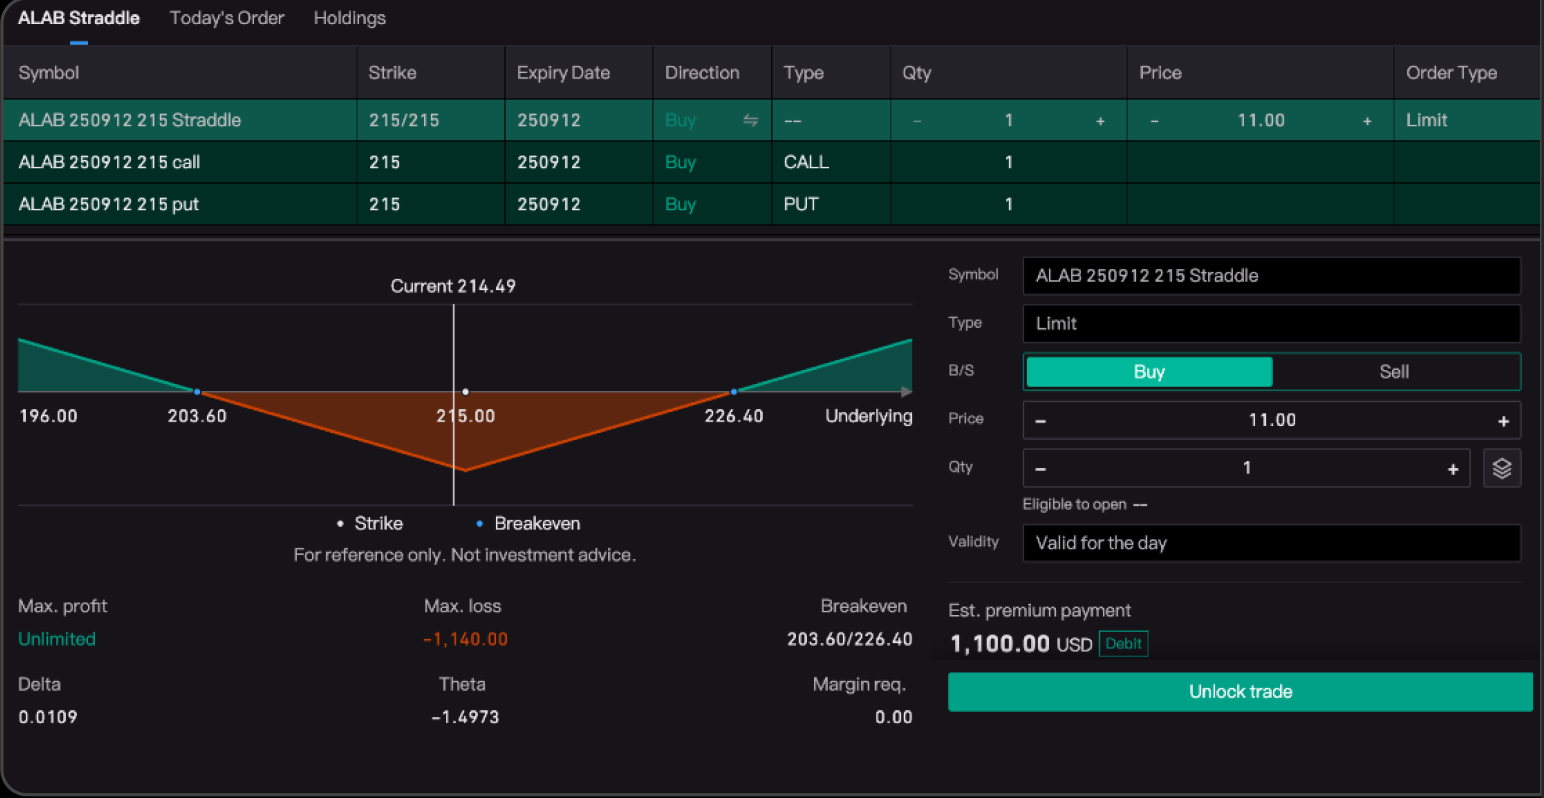
- Improved Options Order Display for Chart Trading
“Today’s Order” now offers a clearer view of single and multi-leg options orders, making it easier to monitor your trades.
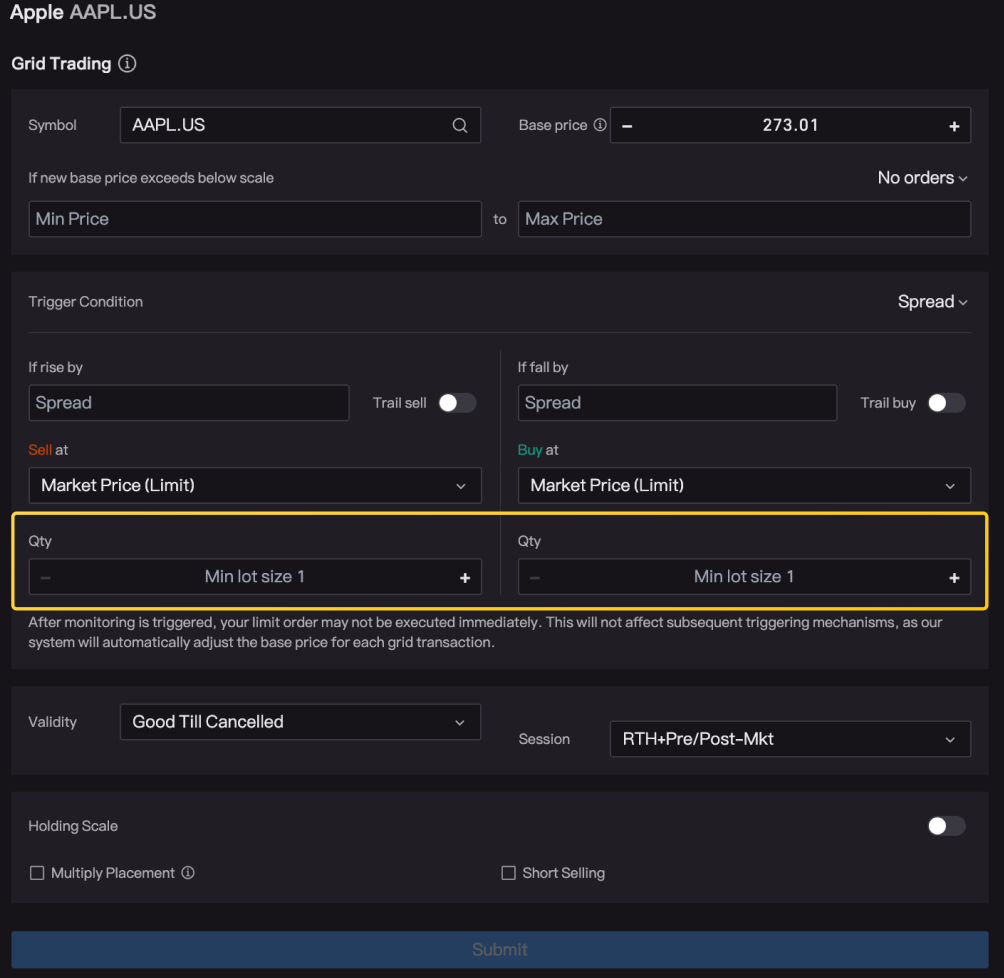
- Grid Trading Now Supports Separate Buy/Sell Quantities
Grid trading now allows you to set separate buy and sell quantities, giving you greater control over your strategy.
Version 2.35.0
Updated: 11/27/2025
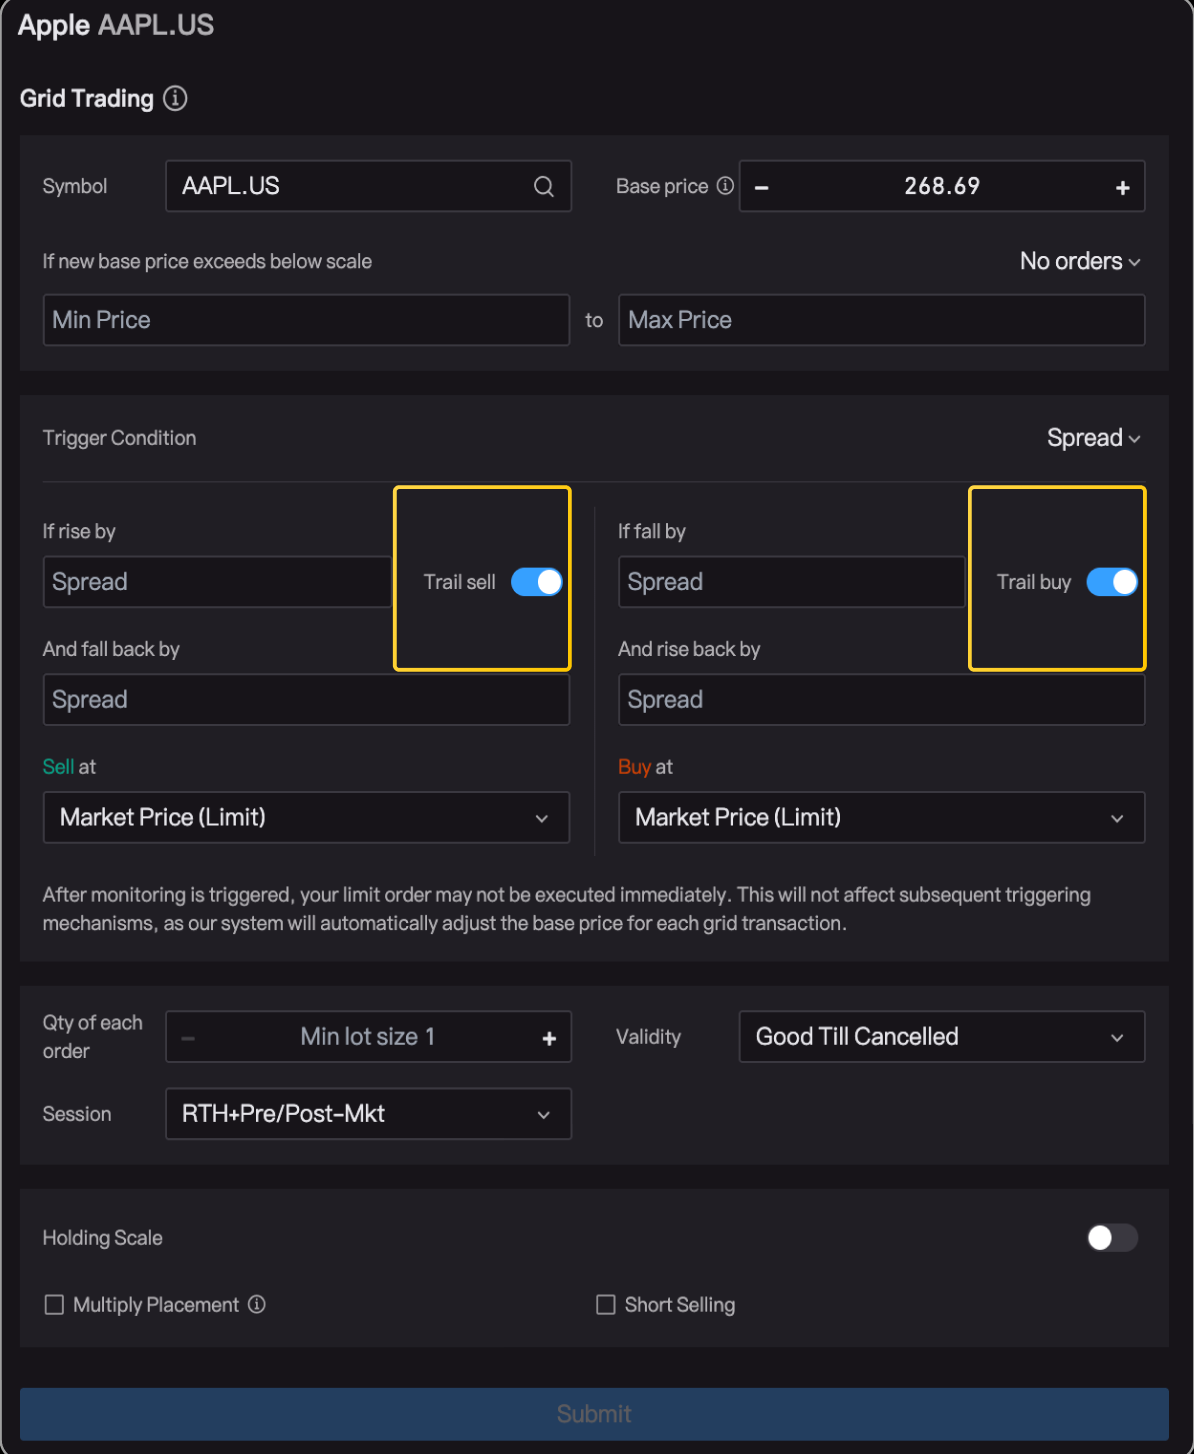
- Grid Trading Now Supports Trailing Buy & Trailing Sell
Set trailing buy and trailing sell thresholds to capture price swings—buy low, sell high, and optimize your grid trading strategy.
Access: New Tab → Select "Grid Trading" template.
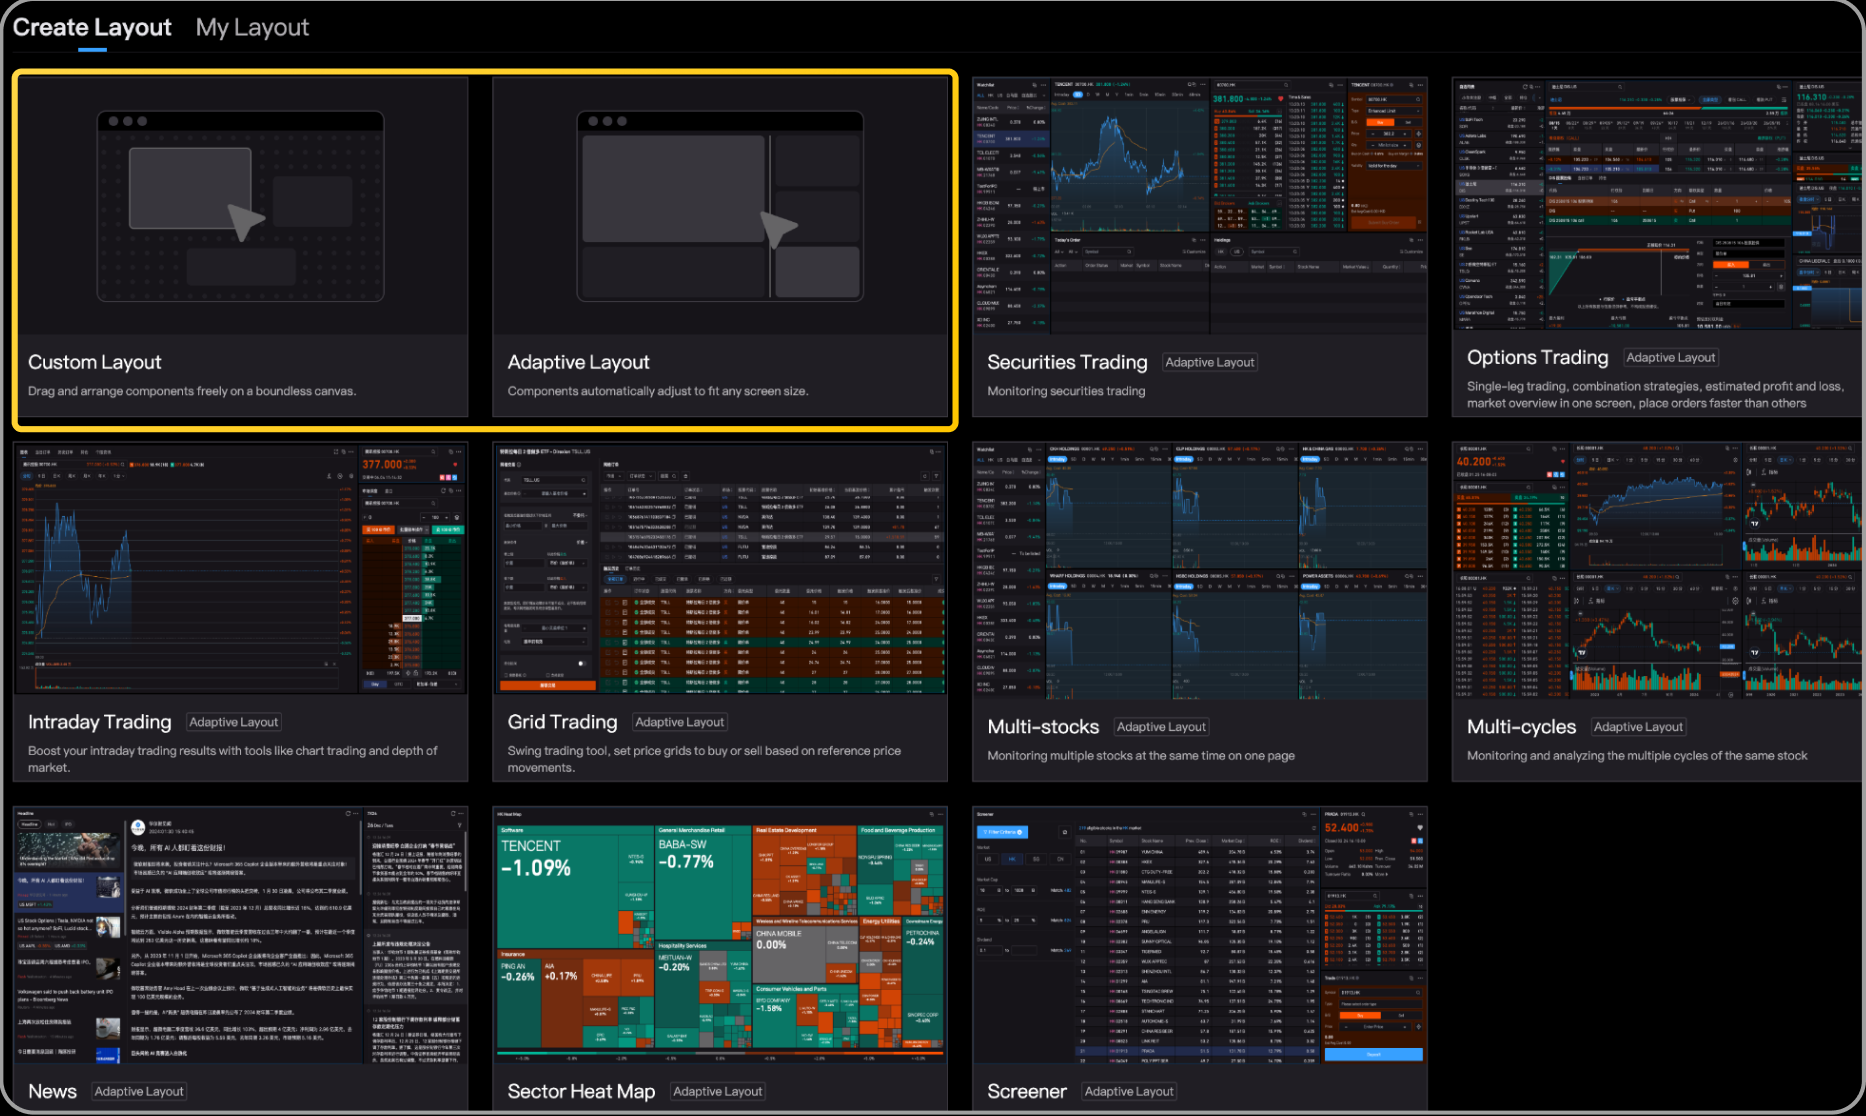
- Layout Setup Introduces One-Click Custom & Adaptive Layouts
When opening a new blank tab, select a custom or adaptive layout with one tap for a faster, more intuitive setup.
Version 2.34.0
Updated: 11/11/2025
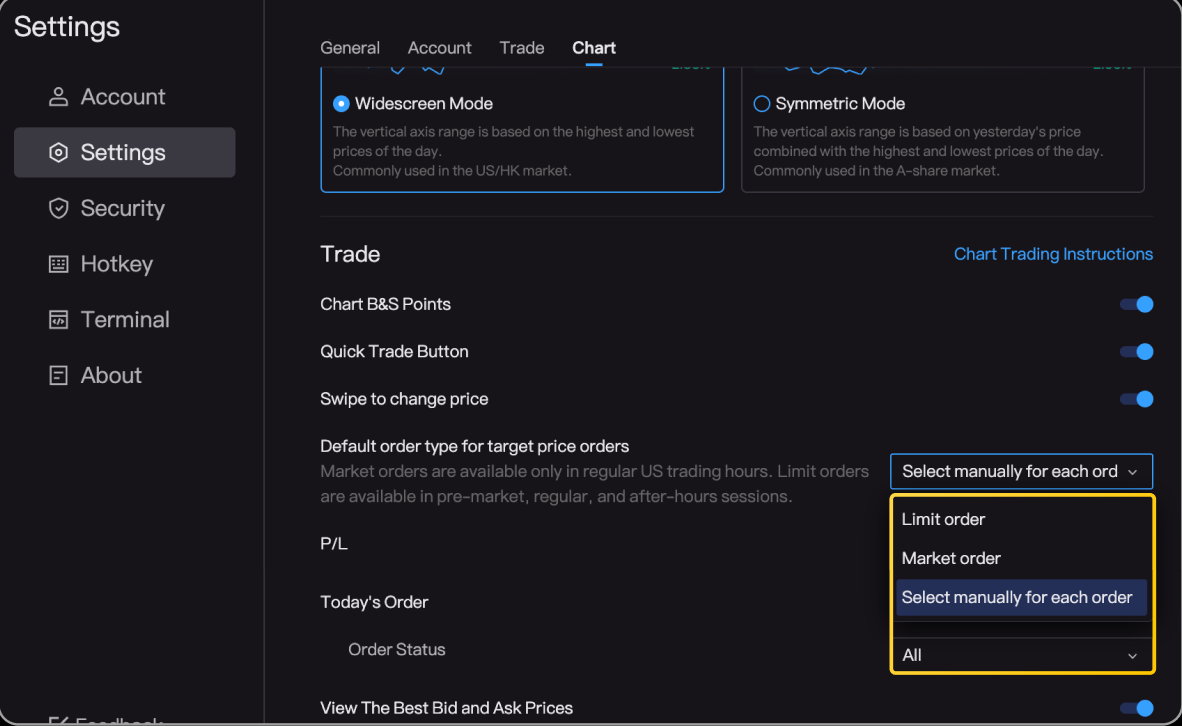
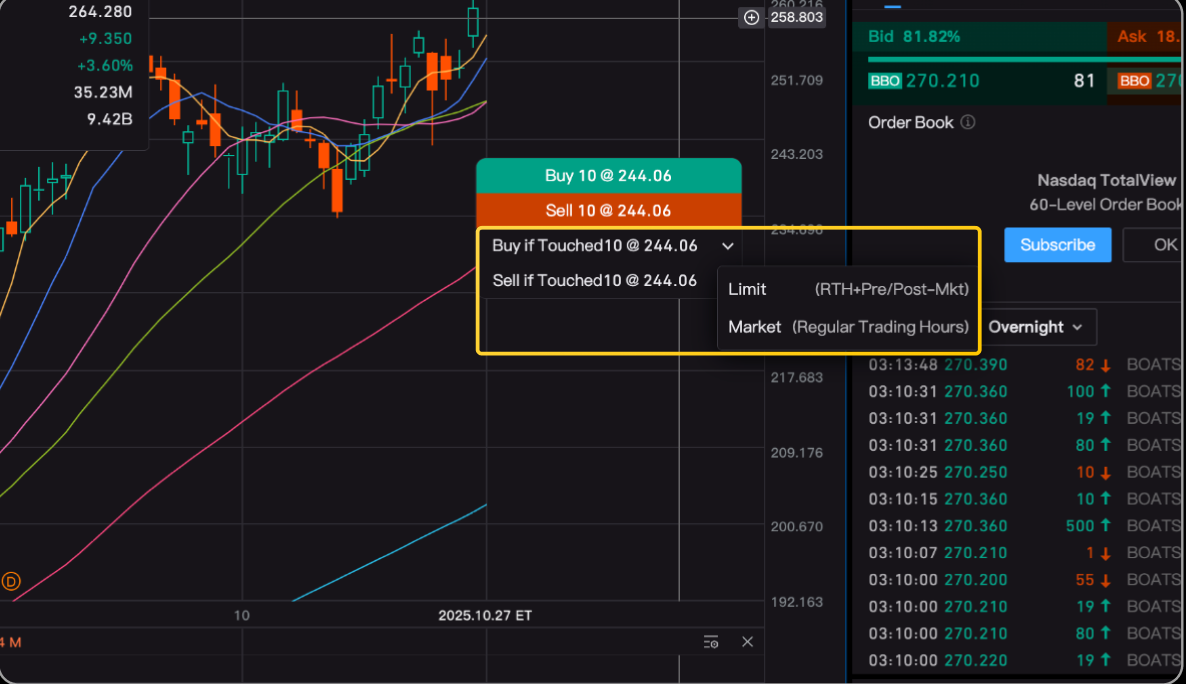
- Chart Trading: Enabling Market Orders in Conditional Trading
When placing a conditional order in chart trading, you can now select Market order or Limit order. Adjust this setting under Settings > Chart > Trade for more flexible execution.
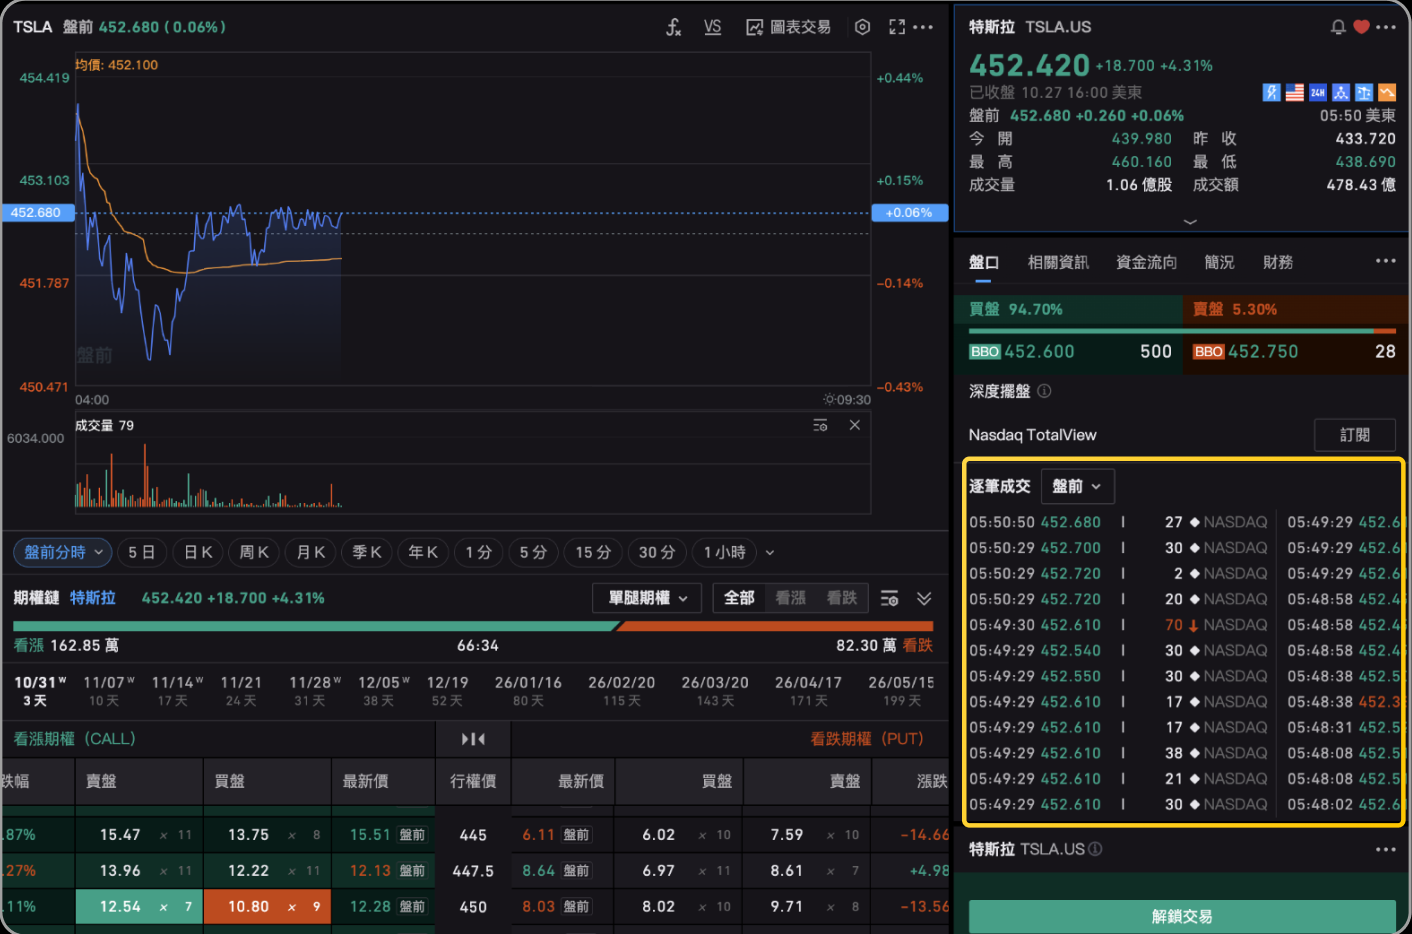
- Tick Data: Filtering by Session & Showing Exchange Info
You can filter transactions by trading session (pre-market, regular, after hours, overnight, or all). We’ve also added an Exchange field so you can quickly see the exchange for each transaction.
Version 2.33.0
Updated: 10/11/2025
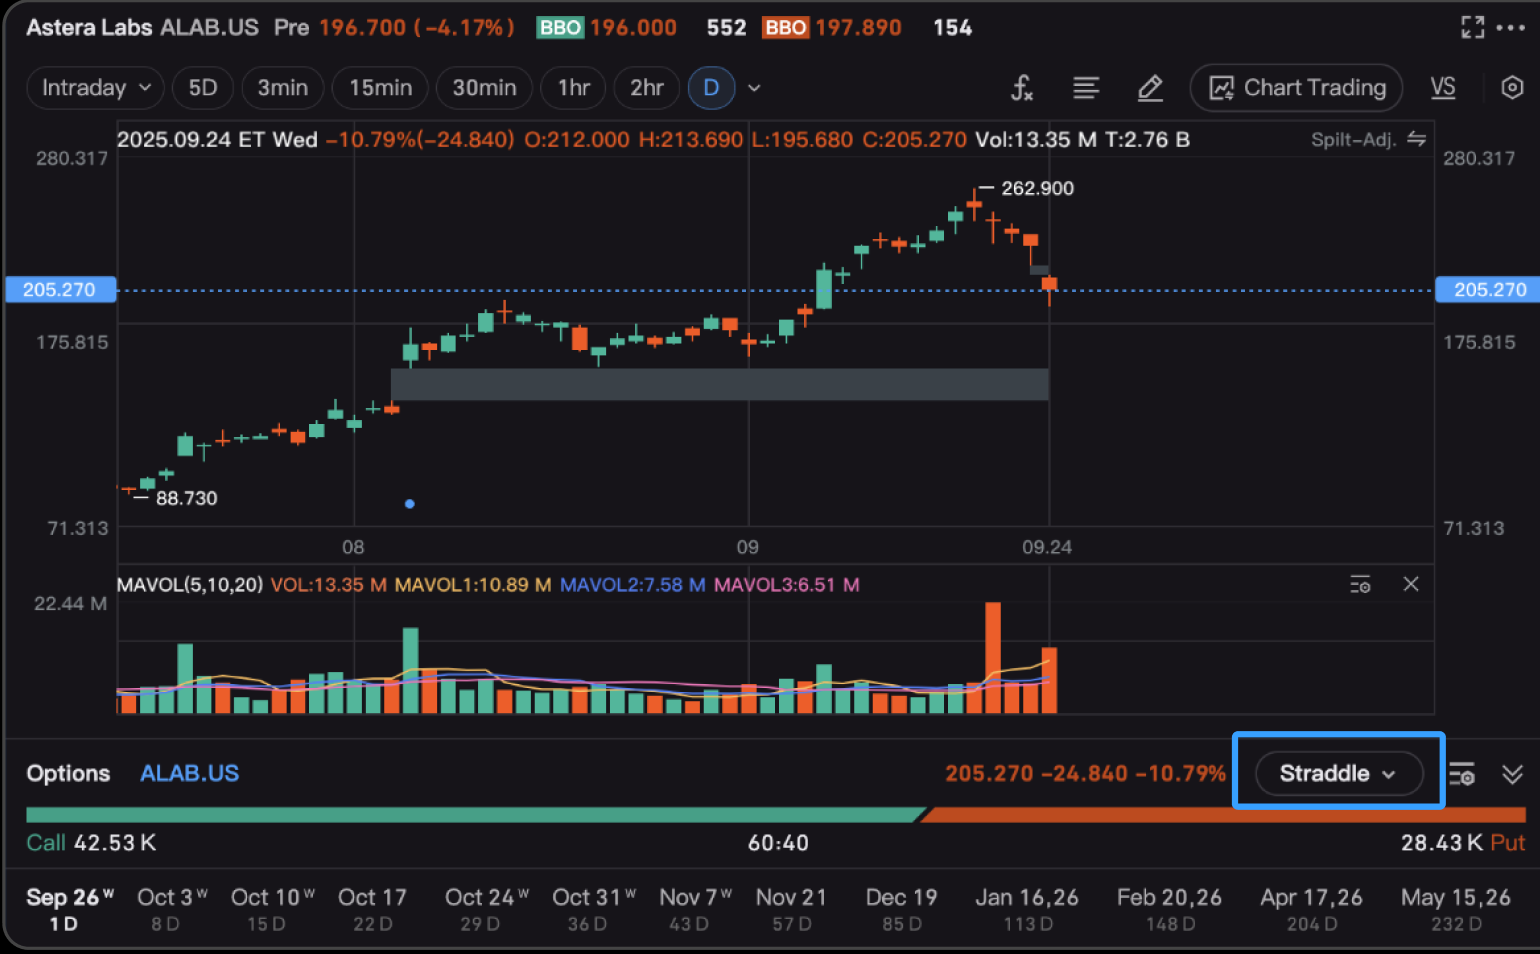
- New in Options Chain: 5 Advanced Strategies
Trade vertical spreads, covered stock, collars, straddles, and strangles directly on the options chain-giving you more ways to trade strategically.
Version 2.32.0
Updated: 09/12/2025
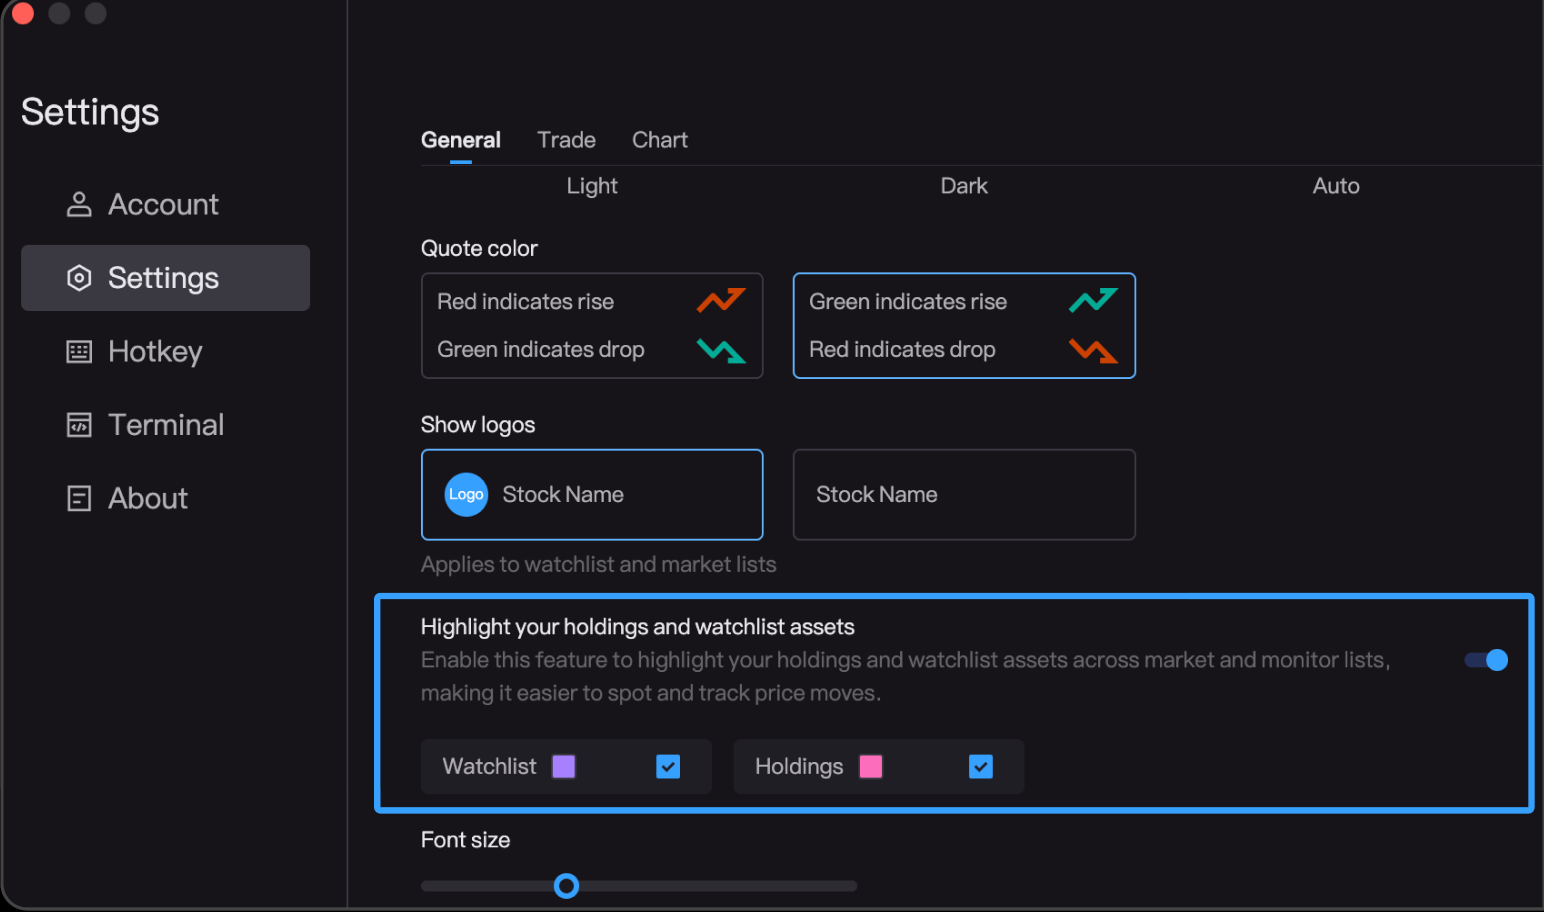
- Highlight Positions & Watchlists in Lists.
Highlight your holdings and watchlist assets in Settings > General to quickly spot them in relevant lists.
Version 2.31.0
Updated: 08/29/2025
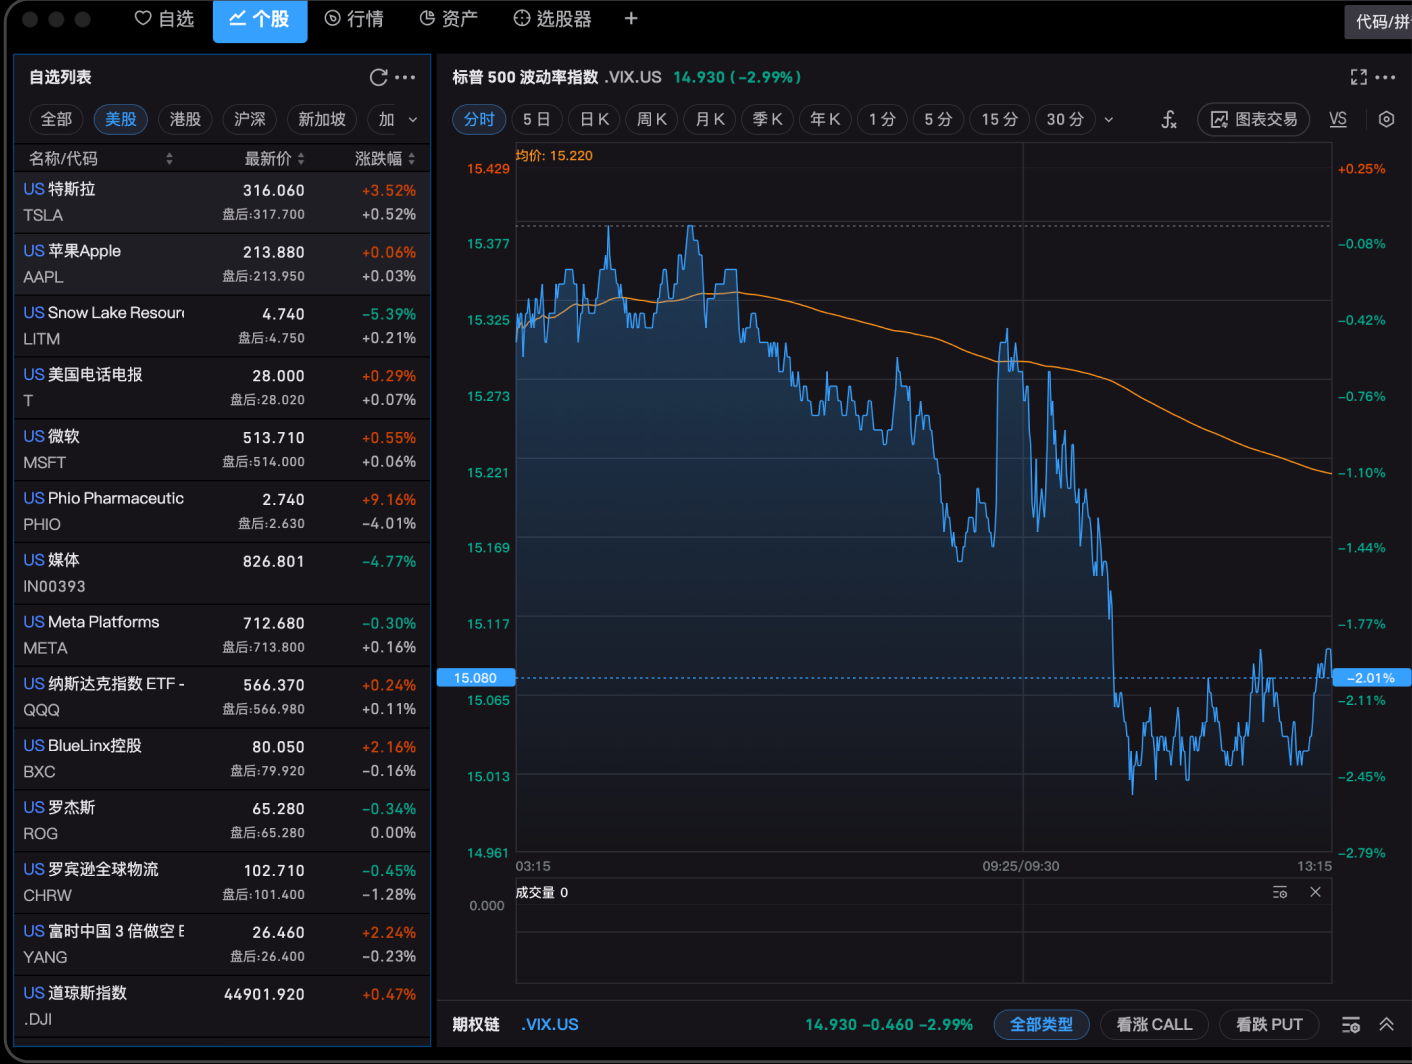
- S&P 500 VIX: Track Real-Time Market Sentiment.
The Volatility S&P 500 Index is now available on the stock index page. This helps you spot risks during high volatility and identify opportunities to buy undervalued stocks.
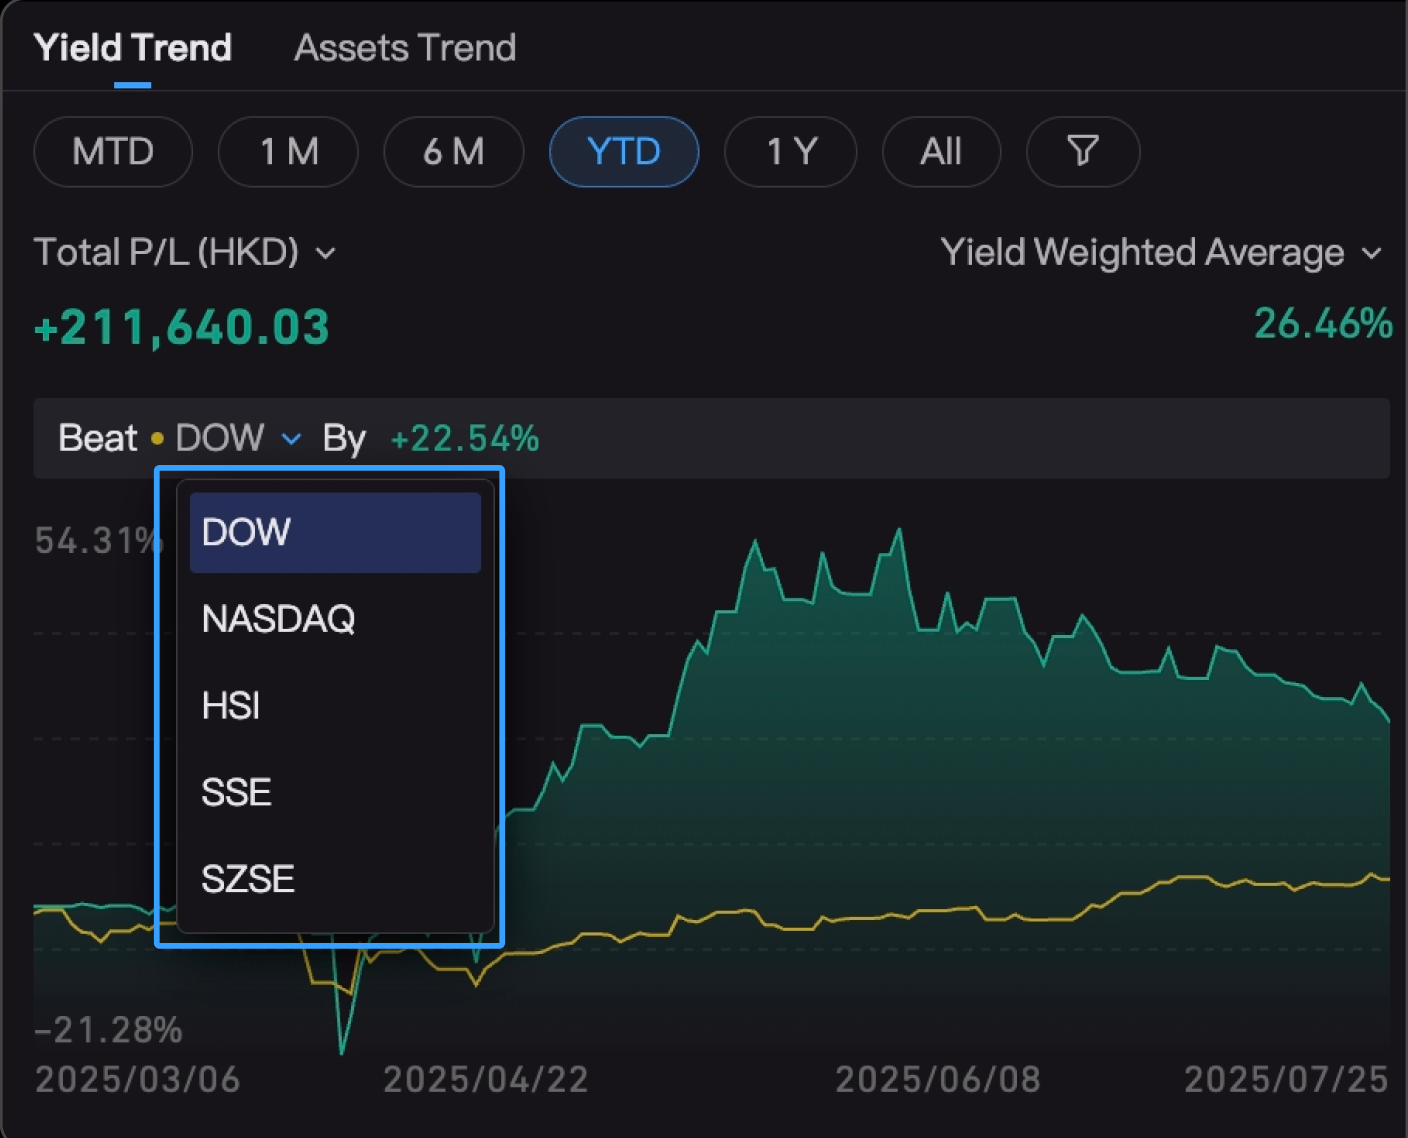
- Yield Comparison: Compare Against Major Market Indices.
Compare your returns with major market indices like the Dow Jones, Nasdaq, and SSE Composite. Head to Portfolio > Asset Analysis > Yield Trend for a clearer performance view.
Version 2.30.0
Updated: 07/23/2025
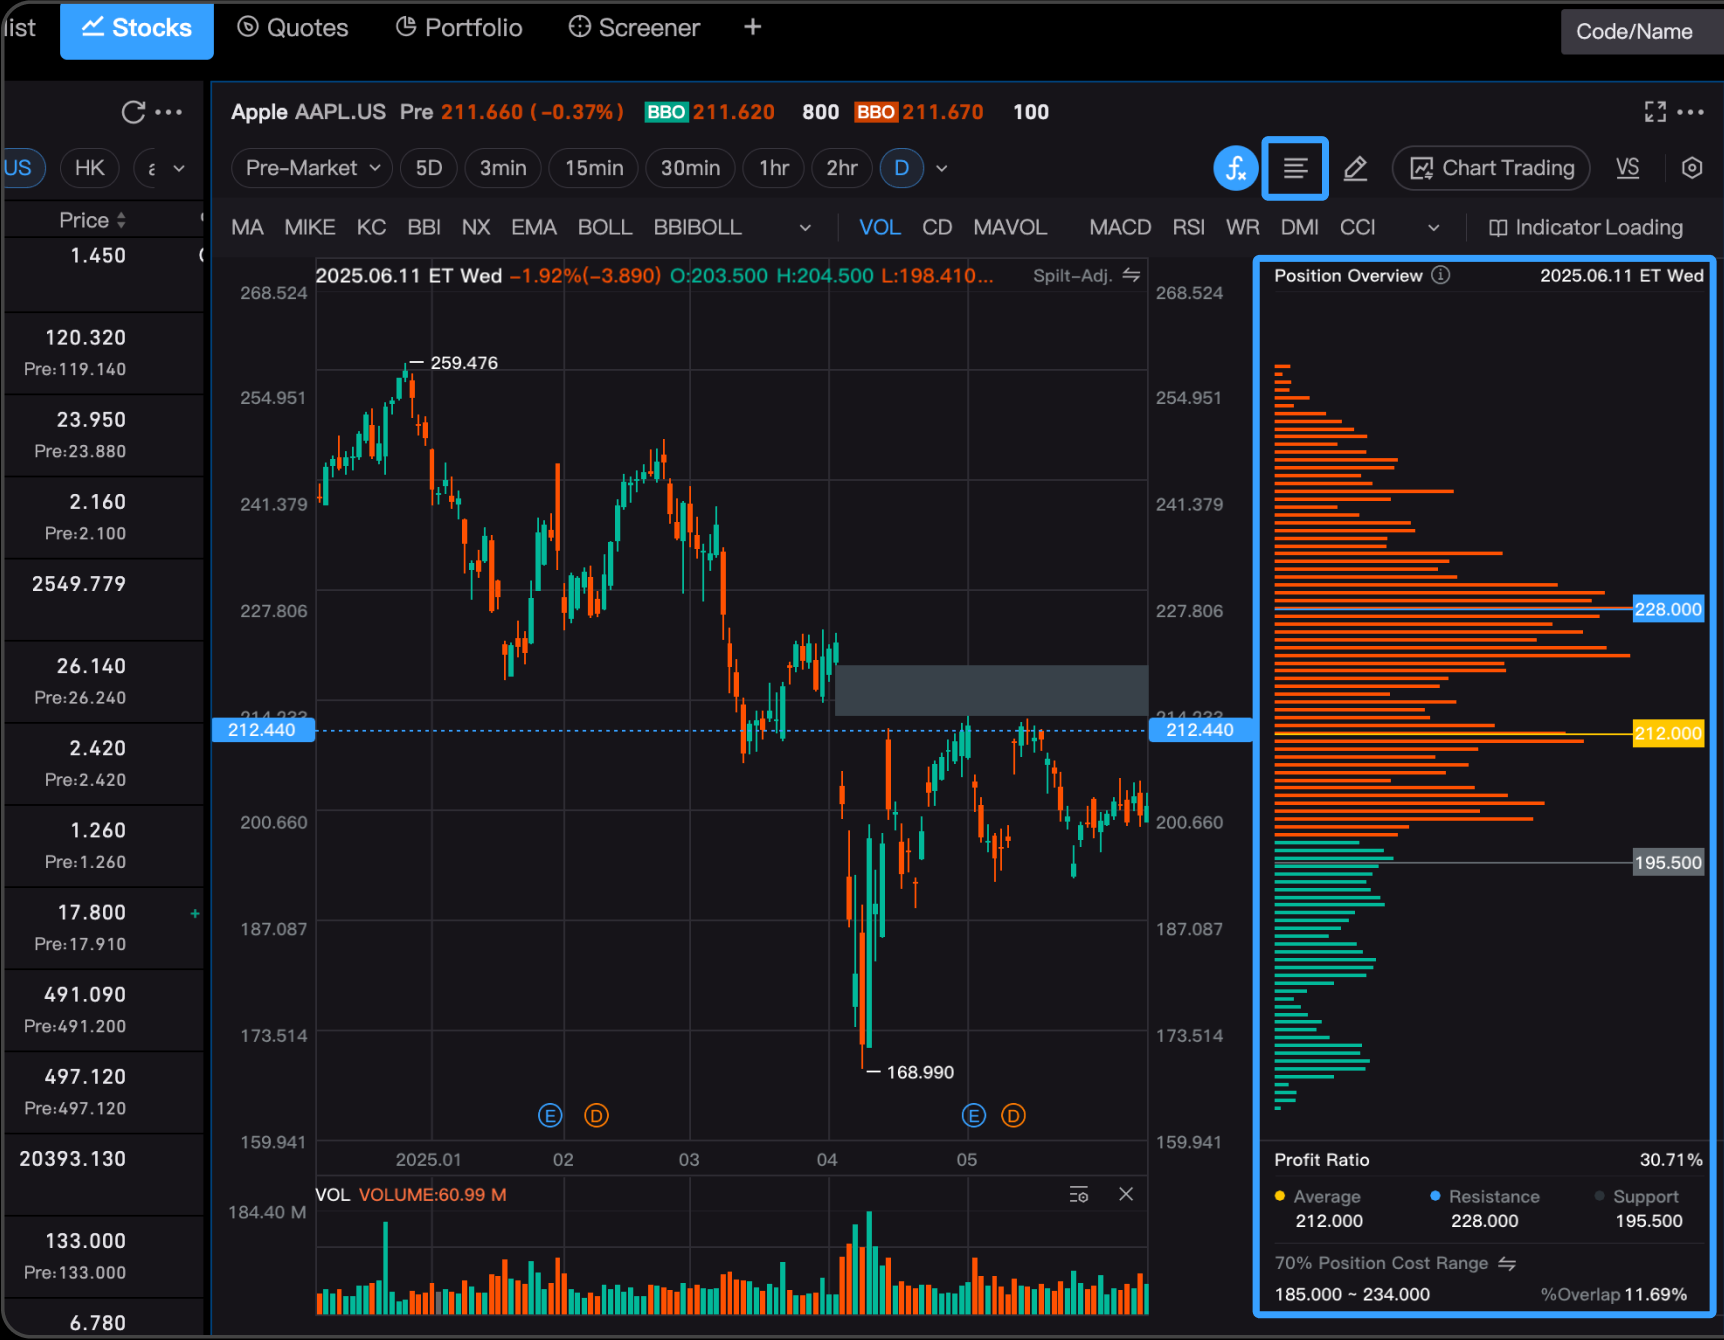
- New Cost Distribution Chart on the Stock Details Page.
Tap the second button in the top-right corner to turn on cost distribution. Track real-time costs and support/resistance levels—giving you the insights to make smarter holding decisions.
Version 2.29.0
Updated: 07/03/2025
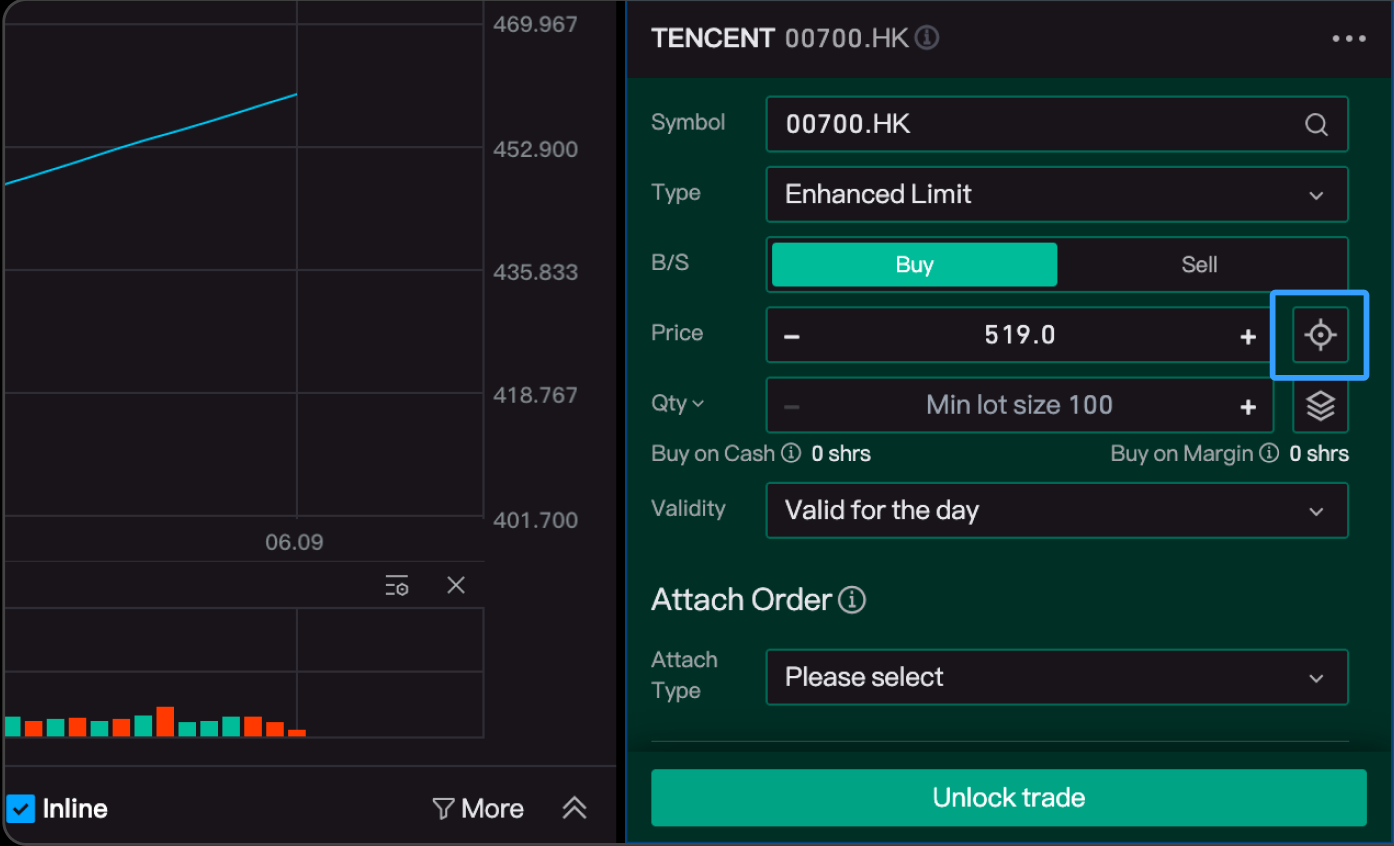
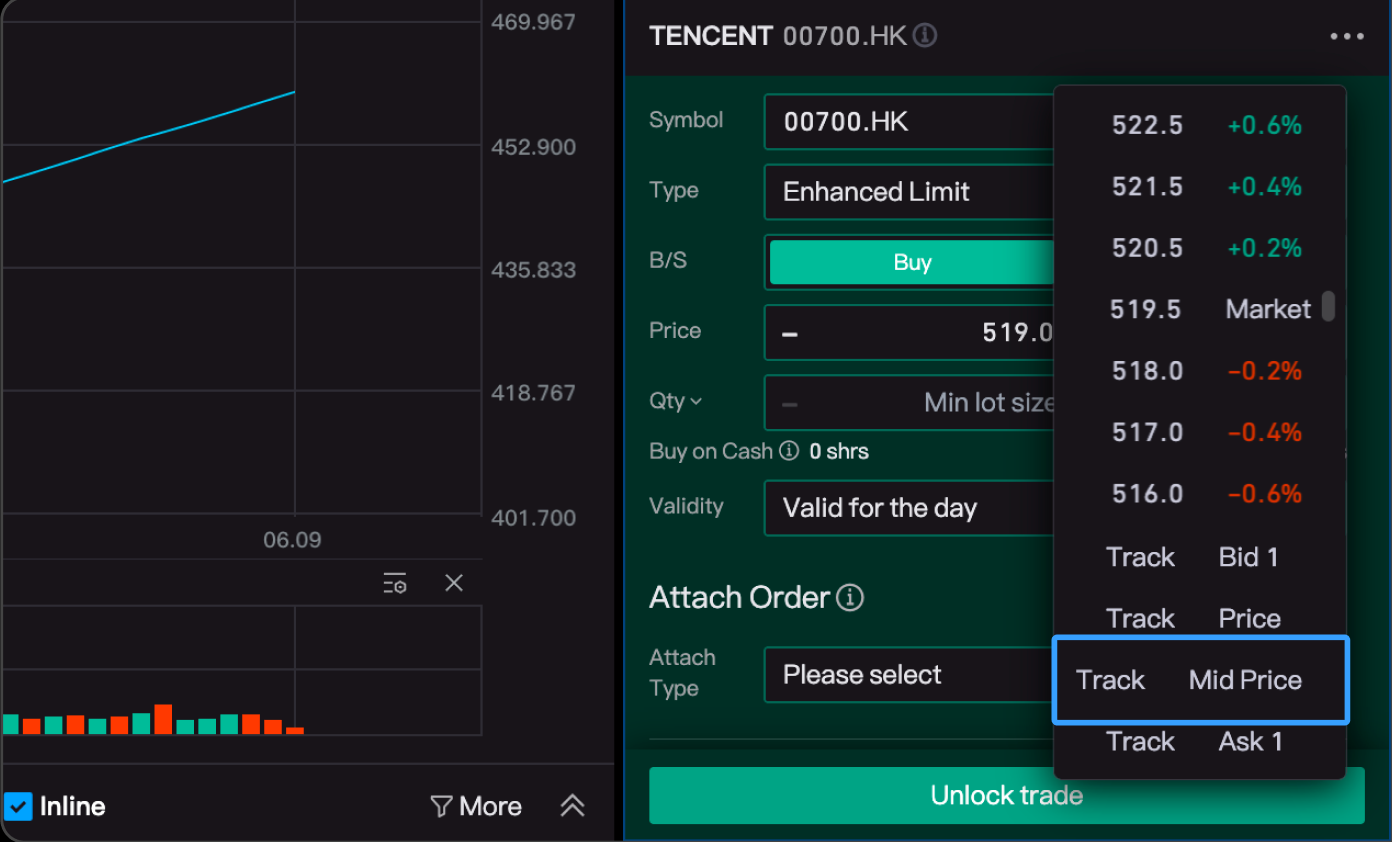
- Optimize Trades with Mid Price Tracking.
The mid price reflects market averages more accurately than bid/ask prices, which helps you reduce spread costs and boost trade success.
Version 2.28.0
Updated: 06/05/2025
Click to view the 2.28.0 release notes.
- Index Widget: Time/K-Line Toggle.
- Market Movers: Dual-Column View.
- Drawing Tools: Magnetic Snap.
Version 2.27.0
Updated: 05/21/2025
Click to view the 2.27.0 release notes.
- Added stock logos in component lists to improve visual recognition.
- Optimized gap display on K-line charts for better visual experience.
Version 2.26.0
Updated: 04/23/2025
Click to view the 2.26.0 release notes.
- New "Capital Flow" Feature on Stock Details.
- Enhanced Yield Chart.
- Smarter Market Data Layout.
Version 2.25.0
Updated: 03/31/2025
Click to view the 2.25.0 release notes.
- Introducing a new swing trading tool–grid trading.
- The market chart now includes a Stock Overlay feature, allowing you to easily compare multiple stock trends.
Version 2.24.0
Updated: 02/26/2025
Click to view the 2.24.0 release notes.
- New moving average trend line has been added to intraday charts for major indices and sectors.
- Seamless sync of technical indicators and drawings across devices in TradingView mode.
- Chart interface now includes a new button for switching between adjusted data displays.
- Upgraded chart trading with improved order tracking for the day.
- Order list now supports data export.
- Easily re-enable the "close confirmation for page layout" prompt.
Version 2.23.0
Updated: 02/03/2025
Click to view the 2.23.0 release notes.
- Introducing the Option Calculator.
- Historical intraday data at your fingertips.
- Enhanced Watchlist with richer data.
- Effortlessly set take-profit/srop-loss orders by dragging the stock holdings line in chart trading mode.
- Optimized order widget and added new action shortcuts.
- Expanded trade statistics in "Today's Stats" widget.
Version 2.22.0
Updated: 12/29/2024
Click to view the 2.22.0 release notes.
- Introducing Take Profit and Stop Loss orders for more comprehensive exit strategies.
- Enjoy operational convenience by using Touch ID for transaction password verification.
- The Quote Widget now includes expanded price data for HK stocks settled in RMB counter and ADRs.
- Optimized Watchlist Smart Sorting for global markets.
- Lock your page layout to prevent accidental changes.
Version 2.21.0
Updated: 12/04/2024
Click to view the 2.21.0 release notes.
- New customization setting to display Candlestick Gap.
- Flexibly switch between "Widescreen Mode" and "Symmetric Mode".
- Enhanced Options Chain view with the display of Days to Expiry, Old label, and special expiry labels.
- "Trailing to Buy" and "Trailing to Sell" conditional orders now support price monitoring.
- Limit orders can now be set for "Take Profit" and "Stop Loss" attached orders.
- "Funds Details" feature has been added to the Asset Analysis widget.
- The new Clock widget is now available for tracking Beijing and US Eastern Time.
Version 2.20.0
Updated: 11/17/2024
Click to view the 2.20.0 version update introduction.
- Candlestick chart now covers pre-market, post-market, and overnight sessions.
- Trading volume trends added to "Options".
- Introduced new indicators to ETF BBO data.
- Easily restore list settings to default.
Version 2.19.0
Updated: 10/27/2024
Click to view the 2.19.0 version update introduction.
- Quick close feature is now available for Chart Trading and DOM.
- Enhanced Chart Trading for a better user experience.
- You can now drag to amend your order outside the chart in Classic Mode.
- More time options for candlestick charts with forward classification for minute charts.
- Pre-market, post-market, and overnight rankings are now available and can be accessed via "Quotes" -> "US Market Data".
- Easily save a new tab as your layout for future use.
Version 2.18.0
Updated: 10/02/2024
Click to view the 2.18.0 version update introduction.
- Desktop trading now supports coupons! Commission, Cash and Platform Fee coupons can now be used to enjoy savings on your trade.
- The Asset panel has been fully redesigned! The Asset panel now features Yield Trend and Assets Trend charts with support for comparing major indices, and includes a new stock P/L leaderboard.
- Efficiently manage your watchlist by dragging and dropping stocks for custom sorting.
- Enhanced messaging for quotes currently in use, with a new guide on "Single Device Usage for Quotes Access".
- Optimized carousel, The carousel now displays real-time market data for the ongoing trading session.
Version 2.17.0
Updated: 09/05/2024
Click to view the 2.17.0 version update introduction.
- Chart trading now supports preset take-profit and stop-loss rules for attached orders.
- The Asset Analysis widget now includes Yield Trend and Assets Trend charts, giving you a comprehensive overview of your portfolio.
- Optimized indicator loading for charts in classic mode.
- The height of candlestick and intraday charts in classic mode can now be adjusted.
- Improved 5D chart with stock price adjustment capabilities.
- Enhanced candlestick data view with flexible display options.
- Other technical and interaction optimizations.
Version 2.16.0
Updated: 08/17/2024
Click to view the 2.16.0 version update introduction.
- Introducing the "Remark" feature: You can now set a preferred name for the stocks in your Watchlist. Right-click on a stock and select "Remark".
- We've added a feature that lets you access financial data for individual stocks. Navigate to the "Widget Toolkit", select "Stocks", and click on "Financials".
- You can disable the "Order Book Supports Quick Edits" feature via "Settings" -> "Trade" to avoid accidental changes to your orders.
- Other technical and interaction optimizations.
Version 2.15.0
Updated: 08/01/2024
Click to view the 2.15.0 version update introduction.
- Nasdaq TotalView is now available in Quotes Store, free for all Longbridge account holders in August!
- Depth of Market now supports placing orders from 60 levels of the order book for US Stocks.
- We've introduced a new "Asset Analysis" feature for in-depth asset evaluation.
- Currency Exchange feature is now available for desktop.
- New layout management feature helps you easily retrieve saved layouts.
- You can now collapse the Quotes and Trade modules with just one click.
Version 2.14.0
Updated: 07/01/2024
Click to view the 2.14.0 version update introduction.
- Introduced the Depth of Market widget, allowing you to place orders directly from the DOM order book for a competitive trading advantage.
- Added a new intraday trading panel that includes both chart trading and Depth of Market. You can choose to open this panel in the Adaptive Layout.
- Added new features to set, change, and reset trade password, accessible via "Settings" - "Account".
- Optimized the web boost feature to enhance loading speed. You can enable this feature via "Settings" - "General" for an improved user experience on certain H5 pages.
Version 2.13.0
Updated: 06/12/2024
Click to view the 2.13.0 version update introduction.
- Added best bid and ask prices to the chart and supports order placement.
- After enabling chart trading, you can cancel orders in bulk and submit conditional orders, such as buy/sell if touched, based on your desired price.
- Settings - Sound Alerts. Multiple sound options are available for selection.
- Optimized the horizontal widget arrangement for enhanced user experience.
Version 2.12.0
Updated: 2024.04.29
Click to view the 2.12.0 version update introduction.
- Widget toolkit now includes layout management, allowing one-click saving of layouts, as well as reading and restoring historical layout data.
- Portfolio tab - holdings now support the function of sorting the stock names alphabetically.
- Added a trading statistics tool for users to view daily transaction data, including the number of trading orders and transaction amounts.
- Charting now offers a 'Period Statistics' feature. Access it via the line-drawing tool in classic mode by selecting the 'Enable Period Statistics' icon.
- Added top banner market carousel, enabling selection of specific groups for intra-group stock rotation.
- Other fixes and technical optimizations.
Version 2.11.0
Updated: 2024.04.20
Click to view the 2.11.0 version update introduction.
- A new Message Center has been added to the upper right corner, allowing you to access messgaes such as historical price movement, order status, and asset movement.
- Supports direct purchase of market quotations through the "Quotes Store" on the PC side and access to market quotations.
- The exit popup supports settings, and you can enable the double confirmation switch for exiting in the settings page.
- Other fixes and technical optimizations.
Version 2.10.0
Updated: 2024.03.29
Click to view the 2.10.0 version update introduction.
- Introduce the "Indicator Loading" feature to classic mode.
- Category-based search is now available for both today's orders and past orders.
- The deposit feature is now accessible via the desktop version.
- Add a feature for adjusting font sizes.
- Other fixes and technical optimizations.
Version 2.9.0
Updated: 2024.01.29
Click to view the 2.9.0 version update introduction.
- Introduce a line-drawing feature on the candlestick chart in classic mode, offering support for over thirty different drawing types.
- Add a simulated trading feature, allowing you to seamlessly switch to the “Demo Account” with just one click from your regular account for order placement.
- Easily summon the quote details window by clicking the quote icon in the stock name column of the market data list, which eliminates the need for navigating to individual stock pages and significantly optimizes the process of viewing stock quotes.
- Refine the standards for defining Heat Map periods by including new standards such as "Year-to-date Percentage Change" alongside the existing ones.
- All widget data related to your assets now can be hidden, ensuring enhanced protection for your data privacy.
- Other fixes and technical optimizations.
Version 2.8.0
Updated: 2024.01.10
Click to view the 2.8.0 version update introduction.
- The system menu bar now enables swift access to the "Trade" and "Mini Quote" widget tools.
- Introduce new widgets for "Headline" and "Stock News" to the widget toolkit. You can also open the "News" layout page directly through the adaptive layout.
- Other fixes and technical optimizations.
Version 2.7.0
Updated: 2023.12.22
Click to view the 2.7.0 version update introduction.
- Supports component label splicing. After splicing, you can view the content by switching Tab. For detailed operating instructions, please refer to the "Instructions for Component Splicing" in the Help Center.
- Launch the self-developed K-line chart to open up a different chart experience. You can open chart settings and switch to "Classical Mode".
- Chart Trading supports stop-profit and stop-loss settings. Simply drag the TP and SL labels on the chart to submit Stop Profit and Stop Loss orders. (Remarks: TP - Take Profit, SL - Stop Loss.)
- The B&S points on the chart support jumping to historical orders to view the order details for that period.
- The mini market component style is optimized, and the broker seat number and broker name can be switched for viewing.
- Add average price field information to the market.
Version 2.6.0
Updated: 2023.11.15
Click to view the 2.6.0 version update introduction.
- Open the virtual asset market to Hong Kong, and you can check the virtual currency market through the desktop.
- Other technical and interactive optimizations to solve some known problems.
Version 2.5.0
Updated: 2023.10.26
Click to view the 2.5.0 version update introduction.
- Added US stock night trading, open to all hours of trading, and expanded US stock trading hours.
- Add additional orders and place stop-profit and stop-loss orders at the same time as placing the transaction order.
- Added update history to support viewing historical version updates.
- Optimize the order marking of conditional order types in chart trade.
- Optimize the IPO page to make the page smoother.
- Supports dragging column widths to view more data on the list.
- Optimize the login forgotten password process.
Version 2.4.0
Updated: 2023.09.07
Click to view the 2.4.0 version update introduction.
- Intraday charts support chart trading, and you can quickly place orders, modify or cancel.
- Add personalization settings such as header settings and smart sorting to the watchlist.
- Add the login method of Email and Login ID, and you can choose any login method.
- Optimize the intraday chart coordinate style.
Version 2.3.0
Updated: 2023.07.24
Click to view the 2.3.0 version update introduction.
- Added K-line chart trading, you can modify and cancel orders on the chart.
- Added a newsletter module component, which can conveniently view 7*24 information.
- When the order type does not match the current trading session, remind and support conversion.
- When the order time period changes, the default order type of the order component will be converted according to the trading time period.
Version 2.2.0
Updated: 2023.06.27
Click to view the 2.2.0 version update introduction.
- Added the subscription of new shares of Hong Kong stocks, and supports direct subscription of new shares through the desktop.
- The canvas layout supports the magnetic attraction function, and the introduction of the canvas is added.
- When the new version is updated, add the latest version update description.
- You can customize the grouping and order adjustment of the watch list through the settings.
- Optimize the option opening risk statement when the user trades options for the first time.
Version 2.1.1
Updated: 2023.05.26
Click to view the 2.1.1 version update introduction.
- Added custom mode with canvas layout support.
- Optimized performance of options chain widget, enhancing performance during high-frequency market data updates.
- Improved loading speed on the login page. Other minor optimizations for enhanced user experience.
Version 2.1.0
Updated: 2023.04.14
Click to view the 2.1.0 version update introduction.
- Optimized Sector Heat Map with screening for constituent stocks and price change.
- Moved the Screener portal to the top tab, making it easier for you to access.
- You can now view the current order's fees, including platform and third-party fees, directly in the order details.
- Margin-trading/short-selling information is displayed for eligible stocks in the market data and quote widget.
- Added a new version update prompt in the upper right corner to keep you updated on the latest version.
Version 2.0.0
Updated: 2023.03.22
Click to view the 2.1.0 version update introduction.
For details on the functions of version 2.0.0, please refer to the link above.
Office hours of HK Hotline and Whatsapp: 9:00 - 18:00 * (GMT+8) on trading days
Office hours of Global Hotline: Trading days 24 hours; Non-trading days 9:00 - 18:00 * (GMT+8)
Outside of the above service hours, if you have any questions, please contact our online customer service.
Office hours of online customer service:
© 2026 Longbridge
* Offers are subject to terms and conditions

A licensed corporation recognized by the SFC (CE No. BPX066). Holder of License Types 1 (Dealing in Securities), 2 (Dealing in Futures Contracts), 4 (Advising on Securities) and 9 (Asset Management). Also a registered HKEX participant and HKSCC participant.

Registered with the Monetary Authority of Singapore (MAS), Long Bridge Securities Pte. Ltd. is a Capital Markets Services Licence holder and Exempt Financial Adviser (Licence No. CMS101211).

A broker dealer registered with the Securities and Exchange Commission (SEC)(CRD: 314519/SEC: 8-70711), a member of the Financial Industry Regulatory Authority (FINRA) and Securities Investor Protection Corporation (SIPC).

New Zealand registered Financial Service Provider (FSP number: FS600050) and a member of the Financial Dispute Resolution Scheme, a New Zealand independent dispute resolution service provider.
The content and materials published here on this website is for general information only and should not be regarded or deemed to be an offer, invitation, or solicitation, recommendation or advice to buy, sell, subscribe or dispose of any investment products or financial services. It does not take into account the specific personal circumstances, investment objectives, financial situation or particular needs of a person and may be subject to change without notice.
Please consult your financial or other professional advisers if you are unsure about the information contained herein. Investments involve risks. Be aware that investments may increase or decrease in value and that past performance is no guarantee of future returns, you may not get back the amount originally invested. You should not make any investment decision based on this content alone.